
Markets & Finance
Gold Price Forecast & Oil Volatility: Hedging Against Middle East Tensions


In August 2026, the financial markets are being dictated not by corporate earnings, but by geopolitics. The recent escalation in Middle Eastern tensions—most notably disruptions affecting the Strait of Hormuz—has sent shockwaves through energy and commodity markets. UNCTAD reports that these geopolitical shocks have historically triggered oil price surges of over 60% and doubled natural gas prices in localized crises.
For portfolio managers and private investors, understanding the inverse relationship between global stability and the gold-oil nexus is the most critical wealth management task of the year.
The Oil Volatility Crisis: Why 2026 is Different
Historically, oil shocks were driven by clear supply-demand imbalances. In 2026, the volatility is driven almost entirely by geopolitical risk premiums. The Strait of Hormuz facilitates a massive percentage of the world’s liquefied natural gas (LNG) and crude oil.
When regional tensions spike, shipping insurance premiums skyrocket, vessels are rerouted, and the immediate cost is passed onto the consumer. Developing economies—particularly in South Asia and Africa that rely heavily on imported fuels—face immediate balance-of-payment crises when oil breaches the $85-$90 per barrel threshold.
- Actionable Strategy: Institutional investors are utilizing options contracts to hedge against sudden energy spikes. Retail investors should look toward energy sector ETFs (like XLE) not necessarily for long-term growth, but as a short-term hedge. If oil prices surge due to conflict, the gains in these ETFs can offset losses in the broader equities market.
The 2026 Gold Price Forecast: The Ultimate Safe Haven
As faith in fiat currencies wavers under the pressure of sticky inflation and geopolitical fractures, gold has cemented its status as the ultimate store of value. The macroeconomic climate for gold is arguably the strongest it has been in a decade:
- De-dollarization Efforts: Central banks in emerging markets are aggressively buying physical gold to diversify their reserves away from the US Dollar.
- Inflationary Hedges: With the IMF noting that global disinflation has stalled, gold remains a proven asset to protect purchasing power.
- Conflict Premiums: Every headline regarding geopolitical escalation adds a “fear premium” to the spot price of gold.
How to Execute a Gold Strategy
Simply buying physical gold is often inefficient due to storage costs and dealer markups.
- For Liquidity: Invest in highly liquid Gold ETFs (e.g., GLD or IAU) which track the spot price without the logistical hassle.
- For Leverage: Consider investing in gold mining equities. When the price of gold rises, the profit margins of mining companies expand exponentially, offering leveraged returns compared to the physical metal itself.
Frequently Asked Questions (FAQ)
1. Will oil prices drop if Middle East tensions resolve? Yes, the “geopolitical risk premium” would evaporate quickly, potentially causing a sharp 10-15% drop in crude prices. This is why oil should be treated as a hedge in 2026, not a core long-term holding.
2. Is it too late to buy gold in 2026? While gold is trading near historic highs, the underlying macroeconomic drivers (central bank buying and inflation) remain unresolved. Most wealth managers suggest maintaining a 5-10% allocation in gold regardless of the current spot price.
3. How do rising oil prices impact the broader stock market? High oil prices act as a regressive tax on consumers and compress profit margins for logistics, aviation, and manufacturing companies. Consequently, prolonged oil volatility generally drags down the S&P 500 and emerging market indices.
Discover more from The Economy
Subscribe to get the latest posts sent to your email.


The global Banking growth is becoming more uneven, capital is increasingly sensitive to financing costs, and investors must distinguish a convincing story from an investable price. This guide focuses on research methods and risks rather than predictions of guaranteed returns. The IMF October 2026 outlook projects 3.1% global growth and 4.7% inflation for 2026, while the IMF financial-stability assessment warns that market resilience coexists with important vulnerabilities.
Key takeaways
- Match each investment decision to its time horizon, currency and ability to withstand losses.
- Separate observable earnings or contractual cash flows from optimistic forecasts.
- Compare diversification, fees, taxes, liquidity and regulatory restrictions before committing capital.
- Track primary institutional evidence and update assumptions when conditions change.
- Readers in Pakistan should consider rupee exposure and availability of regulated investment channels.
Why this matters now
The central question behind global banking trends 2026 is not merely what may happen next. It is which economic mechanisms could change cash flow, purchasing power or risk. The Bank for International Settlements’ 2026 review describes an economy supported by technological investment but constrained by geopolitical and fiscal pressures. A robust financial plan must therefore survive both a favourable and an adverse scenario.
Digital banks are extending beyond borders
Technology can reduce the need to duplicate large physical branch networks, but banking remains subject to local licensing, deposit protection, consumer law and capital rules. Cross-border scale is a business model, not a regulatory exemption. Readers should distinguish a licensed bank from an e-money provider, broker or unregulated payments application. See the primary institutional research.
For practical analysis, separate the baseline, the upside case and the downside case. Document the specific development that would change your assessment. Assess timing: a promising long-term theme may still be inappropriate for cash needed within twelve months.
Artificial intelligence in credit and fraud
Banks use machine learning for transaction screening, fraud detection, service operations and risk analysis. The operational promise is significant, but opaque credit models can create unfair outcomes, and false-positive fraud alerts can disrupt customers. Model governance requires testing, human accountability, explainability and correction routes. Customer consent does not remove every data-protection obligation. See the primary institutional research.
For practical analysis, separate the baseline, the upside case and the downside case. Document the specific development that would change your assessment. Assess timing: a promising long-term theme may still be inappropriate for cash needed within twelve months.
Cybersecurity is now systemic finance risk
An attack against a large processing vendor can affect many institutions simultaneously. The IMF’s October 2026 stability assessment identifies sophisticated cyber threats alongside sovereign-yield and AI valuation shocks. Banks should test recovery procedures, third-party concentration, authentication controls and incident communications, not merely purchase security software. See the primary institutional research.
For practical analysis, separate the baseline, the upside case and the downside case. Document the specific development that would change your assessment. Assess timing: a promising long-term theme may still be inappropriate for cash needed within twelve months.
Compliance: technology must support judgment
Anti-money-laundering monitoring, sanctions screening and know-your-customer processes are increasingly automated. False matches and poor data can cause excessive account restrictions, while under-detection carries serious legal exposure. Institutions need measurable controls, independent audits and escalation channels. The Financial Stability Board provides international coordination context but rules vary by jurisdiction. See the primary institutional research.
For practical analysis, separate the baseline, the upside case and the downside case. Document the specific development that would change your assessment. Assess timing: a promising long-term theme may still be inappropriate for cash needed within twelve months.
What Pakistani customers and banks should do
Customers should verify a provider’s licensing status, understand complaint mechanisms, enable strong authentication and never disclose one-time passcodes. Financial firms need resilient payment systems, staff training and clear consent practices. Track SBP circulars for locally applicable requirements rather than extrapolating foreign regulations to Pakistan. See the primary institutional research.
For practical analysis, separate the baseline, the upside case and the downside case. Document the specific development that would change your assessment. Assess timing: a promising long-term theme may still be inappropriate for cash needed within twelve months.
Comparison and decision framework
| Question | Stronger evidence | Warning sign |
|---|---|---|
| What drives returns? | Audited cash flows, clear contract or transparent index | Undefined or projected returns |
| What can go wrong? | Explicit scenario and downside analysis | Claims of guaranteed gains |
| Is it affordable to hold? | Low transparent fees and adequate liquidity | Leverage, costly spreads or lockups |
| Is access legitimate? | Appropriate licensing and clear legal rights | Unverified brokers or custody |
| Is the exposure diversified? | Multiple independent sources of return | One company, sector or currency |
What it means for Pakistani savers and investors
A Pakistani reader faces both international investment risk and local purchasing-power risk. For example, a foreign asset can rise in US-dollar terms while the rupee conversion and transaction costs alter the realized local outcome. The opposite can also occur. Record the starting exchange rate, applicable taxes, custody charges and capital-transfer restrictions, and confirm current requirements with the State Bank of Pakistan and the relevant securities regulator. Overseas access should not be assumed universally available.
An emergency reserve, expensive consumer debt and near-term family obligations deserve attention before any speculative allocation. A portfolio that cannot meet a sudden cash requirement may force sales at the worst moment. The objective is not to remove risk—impossible in markets—but to choose risks that fit the investor’s actual liabilities.
Risks, limitations and uncertainty
Institutional forecasts are conditional and can change after policy decisions, commodity shocks, conflict escalation or unexpectedly weak earnings. Historic correlations are not binding promises about future asset performance. The analysis does not provide live stock prices, current investment product quotes, real-time exchange rates or individualized tax advice. Prices, regulations and product eligibility should be checked on the transaction date.
Frequently asked questions
Is this a guaranteed investment opportunity?
No. Every financial asset or strategy involves uncertainty. The existence of a popular investment theme is not evidence that an individual security is fairly priced.
What should beginners examine first?
Understand the product, the financial loss you could tolerate, fees and liquidity. Verify the provider and decide whether the money may be needed soon.
How do interest rates affect the analysis?
They influence financing costs, discount rates, exchange rates and demand. The effect differs by sector, maturity and business balance sheet.
Can Pakistani residents invest in foreign markets?
Access depends on current foreign-exchange, banking, brokerage, securities and tax rules, and on the investor’s individual circumstances. Check current regulations and regulated providers rather than assuming access.
How often should this analysis be refreshed?
Review institutional economic releases monthly and re-evaluate immediately after material earnings, regulatory or policy changes. Avoid reacting mechanically to every daily market movement.
Is diversification enough to prevent losses?
No. Diversification may reduce company-specific risk but cannot eliminate broad market, currency, inflation or systemic risks.
Conclusion
Sound financial decisions begin with verifiable evidence, reasonable valuation, awareness of uncertainty and a plan that survives adverse outcomes. Readers should compare multiple independent sources and avoid letting a compelling headline substitute for due diligence.
Discover more from The Economy
Subscribe to get the latest posts sent to your email.
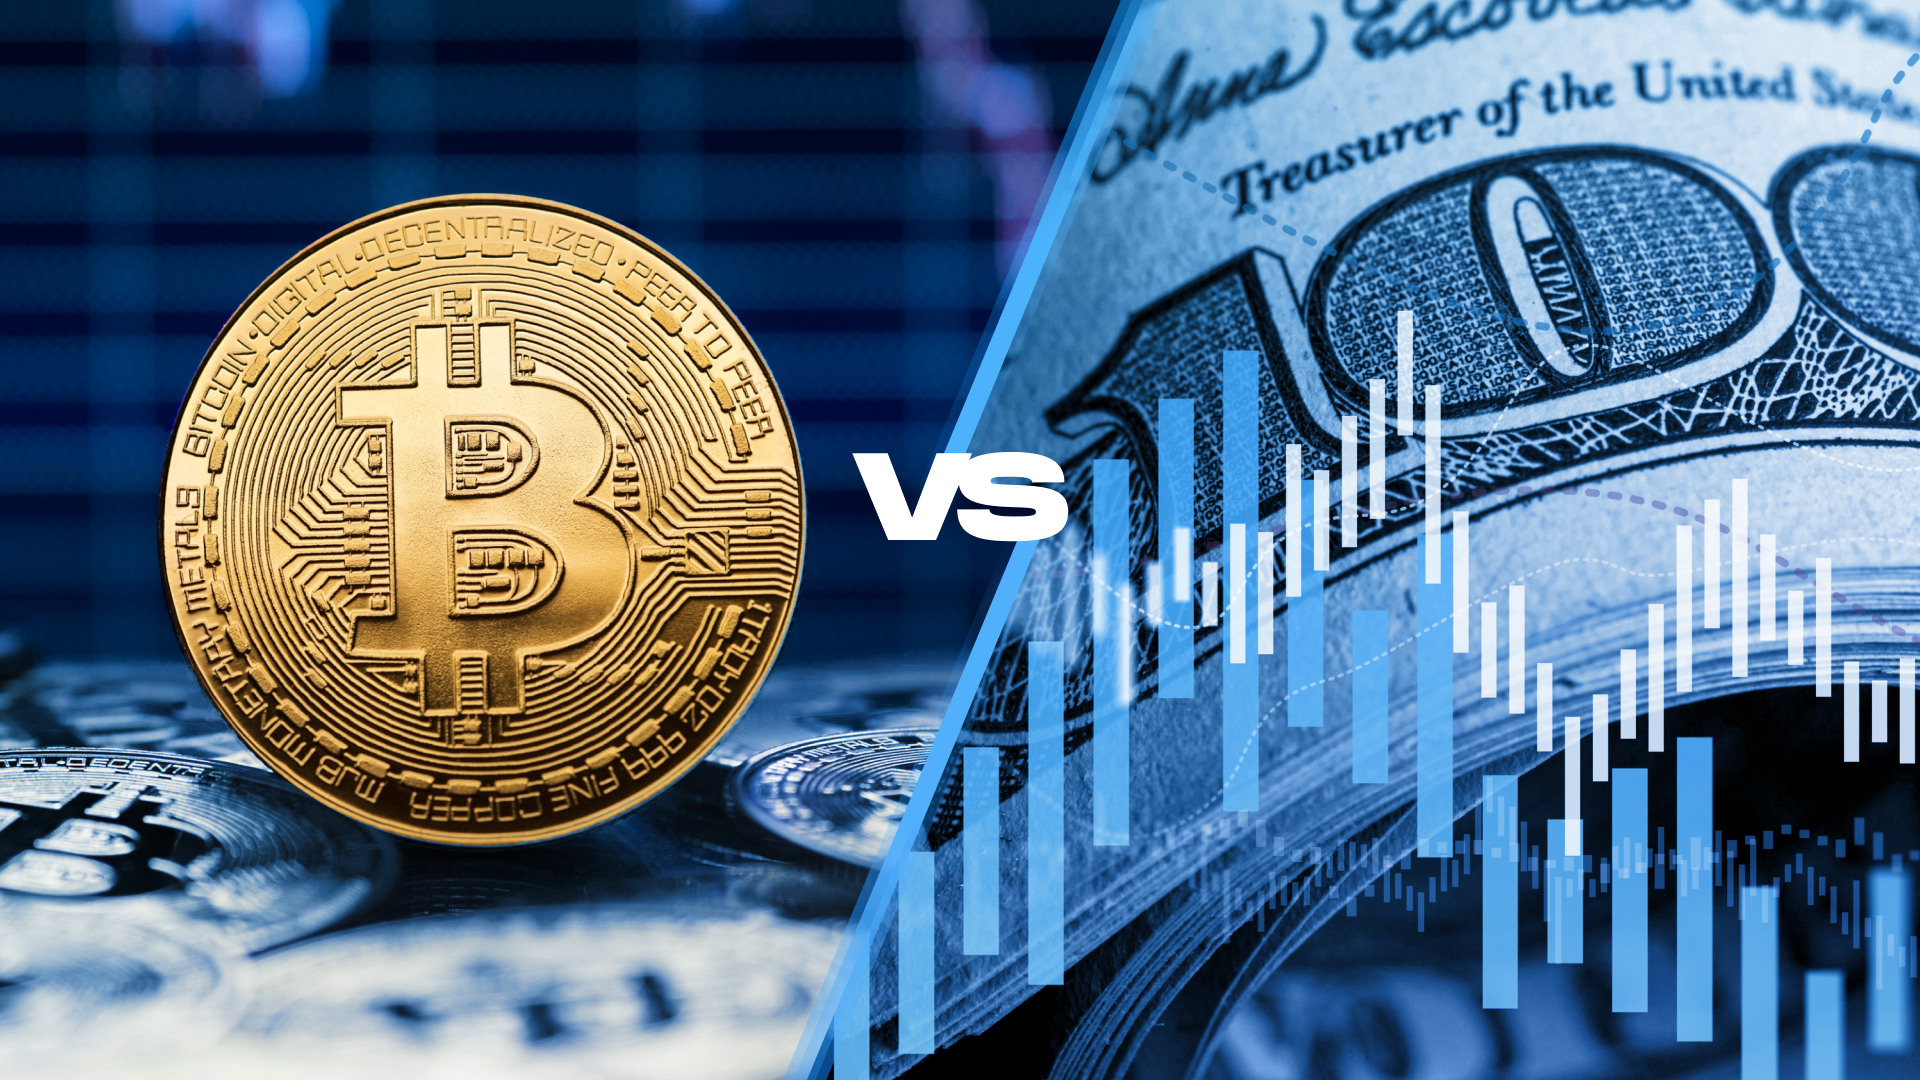
The global economic growth is becoming more uneven, capital is increasingly sensitive to financing costs, and investors must distinguish a convincing story from an investable price. This guide focuses on research methods and risks rather than predictions of guaranteed returns. The IMF October 2026 outlook projects 3.1% global growth and 4.7% inflation for 2026, while the IMF financial-stability assessment warns that market resilience coexists with important vulnerabilities.
Key takeaways
- Match each investment decision to its time horizon, currency and ability to withstand losses.
- Separate observable earnings or contractual cash flows from optimistic forecasts.
- Compare diversification, fees, taxes, liquidity and regulatory restrictions before committing capital.
- Track primary institutional evidence and update assumptions when conditions change.
- Readers in Pakistan should consider rupee exposure and availability of regulated investment channels.
Why this matters now
The central question behind gold vs dollar vs bitcoin 2026 is not merely what may happen next. It is which economic mechanisms could change cash flow, purchasing power or risk. The Bank for International Settlements’ 2026 review describes an economy supported by technological investment but constrained by geopolitical and fiscal pressures. A robust financial plan must therefore survive both a favourable and an adverse scenario.
Three assets, three different economic functions
Gold is a scarce physical asset without a contractual cash flow. The dollar is a currency used for transactions, reserve holdings and dollar liabilities; holding dollars is not the same as owning an inflation-protected investment. Bitcoin is a highly volatile digital asset whose long-run response to inflation cannot be assumed stable. The comparison depends on which inflation and which home currency the investor faces. See the primary institutional research.
For practical analysis, separate the baseline, the upside case and the downside case. Document the specific development that would change your assessment. Assess timing: a promising long-term theme may still be inappropriate for cash needed within twelve months.
Why gold has attracted investment demand
The World Gold Council reported resilient investment demand during 2026 and a recovery in central-bank purchasing in the second quarter. That is evidence of demand, not a promise of rising prices. Gold can fall when real interest rates rise, the dollar strengthens or investors liquidate positions. Storage, spreads and insurance matter for physical buyers. See the primary institutional research.
For practical analysis, separate the baseline, the upside case and the downside case. Document the specific development that would change your assessment. Assess timing: a promising long-term theme may still be inappropriate for cash needed within twelve months.
The dollar: liquidity versus purchasing power
Foreign-currency balances may reduce exposure to a depreciation of the investor’s home currency, but US inflation still erodes dollar purchasing power. Cash in a bank has different legal protection and returns from banknotes held privately. A Pakistani household paying future US-dollar tuition has a genuine dollar liability; a household buying groceries in rupees has different currency matching needs.
For practical analysis, separate the baseline, the upside case and the downside case. Document the specific development that would change your assessment. Assess timing: a promising long-term theme may still be inappropriate for cash needed within twelve months.
Bitcoin: upside narratives and drawdown risk
Bitcoin supply rules do not make its market price stable. Liquidity conditions, leverage, custody arrangements, regulatory changes and speculative activity can dominate short-run returns. Investor.gov warns that crypto assets involve substantial loss and fraud risks. Treat any allocation as a speculative risk decision, not a guaranteed inflation hedge. See the primary institutional research.
For practical analysis, separate the baseline, the upside case and the downside case. Document the specific development that would change your assessment. Assess timing: a promising long-term theme may still be inappropriate for cash needed within twelve months.
How to compare hedges in rupees
Measure the purchase price and exit value after exchange rates, fees and taxes. Consider the needed holding period and worst plausible drawdown. Diversification is more credible than trying to select one universally superior asset. The right benchmark is the real purchasing power of the specific future expense, not whichever asset had the best recent performance. See the primary institutional research.
For practical analysis, separate the baseline, the upside case and the downside case. Document the specific development that would change your assessment. Assess timing: a promising long-term theme may still be inappropriate for cash needed within twelve months.
Comparison and decision framework
| Question | Stronger evidence | Warning sign |
|---|---|---|
| What drives returns? | Audited cash flows, clear contract or transparent index | Undefined or projected returns |
| What can go wrong? | Explicit scenario and downside analysis | Claims of guaranteed gains |
| Is it affordable to hold? | Low transparent fees and adequate liquidity | Leverage, costly spreads or lockups |
| Is access legitimate? | Appropriate licensing and clear legal rights | Unverified brokers or custody |
| Is the exposure diversified? | Multiple independent sources of return | One company, sector or currency |
What it means for Pakistani savers and investors
A Pakistani reader faces both international investment risk and local purchasing-power risk. For example, a foreign asset can rise in US-dollar terms while the rupee conversion and transaction costs alter the realized local outcome. The opposite can also occur. Record the starting exchange rate, applicable taxes, custody charges and capital-transfer restrictions, and confirm current requirements with the State Bank of Pakistan and the relevant securities regulator. Overseas access should not be assumed universally available.
An emergency reserve, expensive consumer debt and near-term family obligations deserve attention before any speculative allocation. A portfolio that cannot meet a sudden cash requirement may force sales at the worst moment. The objective is not to remove risk—impossible in markets—but to choose risks that fit the investor’s actual liabilities.
Risks, limitations and uncertainty
Institutional forecasts are conditional and can change after policy decisions, commodity shocks, conflict escalation or unexpectedly weak earnings. Historic correlations are not binding promises about future asset performance. The analysis does not provide live stock prices, current investment product quotes, real-time exchange rates or individualized tax advice. Prices, regulations and product eligibility should be checked on the transaction date.
Frequently asked questions
Is this a guaranteed investment opportunity?
No. Every financial asset or strategy involves uncertainty. The existence of a popular investment theme is not evidence that an individual security is fairly priced.
What should beginners examine first?
Understand the product, the financial loss you could tolerate, fees and liquidity. Verify the provider and decide whether the money may be needed soon.
How do interest rates affect the analysis?
They influence financing costs, discount rates, exchange rates and demand. The effect differs by sector, maturity and business balance sheet.
Can Pakistani residents invest in foreign markets?
Access depends on current foreign-exchange, banking, brokerage, securities and tax rules, and on the investor’s individual circumstances. Check current regulations and regulated providers rather than assuming access.
How often should this analysis be refreshed?
Review institutional economic releases monthly and re-evaluate immediately after material earnings, regulatory or policy changes. Avoid reacting mechanically to every daily market movement.
Is diversification enough to prevent losses?
No. Diversification may reduce company-specific risk but cannot eliminate broad market, currency, inflation or systemic risks.
Conclusion
Sound financial decisions begin with verifiable evidence, reasonable valuation, awareness of uncertainty and a plan that survives adverse outcomes. Readers should compare multiple independent sources and avoid letting a compelling headline substitute for due diligence.
Discover more from The Economy
Subscribe to get the latest posts sent to your email.

Best Global Stocks to Watch in 2026: Four Sectors to Research matters in 2026 because global economic growth is becoming more uneven, capital is increasingly sensitive to financing costs, and investors must distinguish a convincing story from an investable price. This guide focuses on research methods and risks rather than predictions of guaranteed returns. The IMF October 2026 outlook projects 3.1% global growth and 4.7% inflation for 2026, while the IMF financial-stability assessment warns that market resilience coexists with important vulnerabilities.
Key takeaways
- Match each investment decision to its time horizon, currency and ability to withstand losses.
- Separate observable earnings or contractual cash flows from optimistic forecasts.
- Compare diversification, fees, taxes, liquidity and regulatory restrictions before committing capital.
- Track primary institutional evidence and update assumptions when conditions change.
- Readers in Pakistan should consider rupee exposure and availability of regulated investment channels.
Why this matters now
The central question behind global stocks to watch in 2026 is not merely what may happen next. It is which economic mechanisms could change cash flow, purchasing power or risk. The Bank for International Settlements’ 2026 review describes an economy supported by technological investment but constrained by geopolitical and fiscal pressures. A robust financial plan must therefore survive both a favourable and an adverse scenario.
AI infrastructure: the earnings test
AI chip designers, semiconductor equipment manufacturers, hyperscalers and power suppliers are linked, but their risks differ. A supplier earning cash from signed orders is not interchangeable with a start-up projecting future demand. Examine customer concentration, lead times, gross margins, debt-funded capital expenditure and free cash flow. The BIS notes that AI capital spending helped global growth, while the IMF warns that an AI repricing could unsettle markets. See the primary institutional research.
For practical analysis, separate the baseline, the upside case and the downside case. Document the specific development that would change your assessment. Assess timing: a promising long-term theme may still be inappropriate for cash needed within twelve months.
Defence: budgets are not the same as profits
Defence contractors can benefit from multi-year programmes, but investors must distinguish policy announcements from approved budgets and contracted orders. Backlogs can be cancelled, delayed or delivered at disappointing margins. Foreign-exchange movements and export licensing also affect manufacturers with international customers. A prudent analyst compares valuation, execution history, cash conversion and programme concentration rather than buying solely on geopolitical headlines.
For practical analysis, separate the baseline, the upside case and the downside case. Document the specific development that would change your assessment. Assess timing: a promising long-term theme may still be inappropriate for cash needed within twelve months.
Energy: diversify beyond one oil-price forecast
Oil and gas producers, pipelines, utilities, renewables developers and grid-equipment manufacturers have markedly different cash-flow profiles. High oil prices may support producers while harming refiners or power importers. Grid infrastructure can benefit from electrification but also face financing and permitting risks. Compare cash generation under several commodity-price scenarios; avoid treating every energy share as an inflation hedge. See the primary institutional research.
For practical analysis, separate the baseline, the upside case and the downside case. Document the specific development that would change your assessment. Assess timing: a promising long-term theme may still be inappropriate for cash needed within twelve months.
Healthcare: defensive demand with real product risk
Drug developers, medical-device firms, hospital operators and insurers offer different exposures. Patent expiry, clinical trial failures and reimbursement changes can overwhelm demand for healthcare services. Focus on diversified revenue, capital discipline and how much growth is already priced into shares. Defensive industries can still have large drawdowns when an individual company’s valuation is excessive.
For practical analysis, separate the baseline, the upside case and the downside case. Document the specific development that would change your assessment. Assess timing: a promising long-term theme may still be inappropriate for cash needed within twelve months.
A watchlist framework for global investors
Create a shortlist based on earnings quality rather than a ranking of guaranteed winners. Test five questions: Is revenue recurring? Is the balance sheet strong? What assumptions justify the valuation? Where could regulation disrupt the thesis? Is liquidity sufficient for the investor’s horizon? Pakistan-based investors must separately assess lawful market access, foreign-exchange conversion, fees and tax obligations. See the primary institutional research.
For practical analysis, separate the baseline, the upside case and the downside case. Document the specific development that would change your assessment. Assess timing: a promising long-term theme may still be inappropriate for cash needed within twelve months.
Comparison and decision framework
| Question | Stronger evidence | Warning sign |
|---|---|---|
| What drives returns? | Audited cash flows, clear contract or transparent index | Undefined or projected returns |
| What can go wrong? | Explicit scenario and downside analysis | Claims of guaranteed gains |
| Is it affordable to hold? | Low transparent fees and adequate liquidity | Leverage, costly spreads or lockups |
| Is access legitimate? | Appropriate licensing and clear legal rights | Unverified brokers or custody |
| Is the exposure diversified? | Multiple independent sources of return | One company, sector or currency |
What it means for Pakistani savers and investors
A Pakistani reader faces both international investment risk and local purchasing-power risk. For example, a foreign asset can rise in US-dollar terms while the rupee conversion and transaction costs alter the realized local outcome. The opposite can also occur. Record the starting exchange rate, applicable taxes, custody charges and capital-transfer restrictions, and confirm current requirements with the State Bank of Pakistan and the relevant securities regulator. Overseas access should not be assumed universally available.
An emergency reserve, expensive consumer debt and near-term family obligations deserve attention before any speculative allocation. A portfolio that cannot meet a sudden cash requirement may force sales at the worst moment. The objective is not to remove risk—impossible in markets—but to choose risks that fit the investor’s actual liabilities.
Risks, limitations and uncertainty
Institutional forecasts are conditional and can change after policy decisions, commodity shocks, conflict escalation or unexpectedly weak earnings. Historic correlations are not binding promises about future asset performance. The analysis does not provide live stock prices, current investment product quotes, real-time exchange rates or individualized tax advice. Prices, regulations and product eligibility should be checked on the transaction date.
Frequently asked questions
Is this a guaranteed investment opportunity?
No. Every financial asset or strategy involves uncertainty. The existence of a popular investment theme is not evidence that an individual security is fairly priced.
What should beginners examine first?
Understand the product, the financial loss you could tolerate, fees and liquidity. Verify the provider and decide whether the money may be needed soon.
How do interest rates affect the analysis?
They influence financing costs, discount rates, exchange rates and demand. The effect differs by sector, maturity and business balance sheet.
Can Pakistani residents invest in foreign markets?
Access depends on current foreign-exchange, banking, brokerage, securities and tax rules, and on the investor’s individual circumstances. Check current regulations and regulated providers rather than assuming access.
How often should this analysis be refreshed?
Review institutional economic releases monthly and re-evaluate immediately after material earnings, regulatory or policy changes. Avoid reacting mechanically to every daily market movement.
Is diversification enough to prevent losses?
No. Diversification may reduce company-specific risk but cannot eliminate broad market, currency, inflation or systemic risks.
Conclusion
Sound financial decisions begin with verifiable evidence, reasonable valuation, awareness of uncertainty and a plan that survives adverse outcomes. Readers should compare multiple independent sources and avoid letting a compelling headline substitute for due diligence.
Discover more from The Economy
Subscribe to get the latest posts sent to your email.

Global Banking Trends 2026: Digital Banks, AI and Compliance

Gold vs US Dollar vs Bitcoin in 2026: Inflation Hedge Compared

How Global Interest Rates Affect Savings, Loans and Investments

How to Invest During High Inflation: A Global Guide

Best Global Stocks to Watch in 2026: Four Sectors to Research

Pakistan’s 2027 Growth Strategy: Exports, AI, Energy and Jobs

Pakistan Economy FY2027: IMF Reform, Debt and Recovery Outlook

Global Interest Rates 2027: Risks for Pakistan’s Rupee and Debt

Energy Shock 2026–2027: Oil, Gas and Pakistan’s Economy

World Trade 2027: Tariffs, Supply Chains and Pakistan Exports

AI Investment Boom 2026–2027: Can Pakistan Capture the Upside?

Global Economy 2026–2027: What Slower Growth Means for Pakistan

Why Global Inflation Is Rising Again in 2026, and What It Means for Pakistan

Raast Pakistan 2026: Digital Payments, Fintech

Crude Oil & Petroleum Market Analysis: OPEC+ Decisions and Price Forecasts

World’s Largest Economies: Ranking the Top Global Powers

Pakistan Economy 2026: Inside the SBP’s Balancing Act

Silver Price Today: Why the Xi-Trump AI Standoff Is Fueling a Safe-Haven Rally

Oil Prices 2026: Inside the Hormuz Crisis That Won’t End

SpaceX IPO 2026: History’s Biggest Stock Debut?

Top US Convenience Store Chains: Store Counts, EV Charging, and Sales Trends

Algorithmic Dogfights: Why the U.S. and China Must Establish Rules of Engagement for Autonomous Air Power

Who Is Shivon Zilis? The Neuralink Executive at the Center of the Musk–OpenAI Trial

Business Insurance: What Coverage You Actually Need and What It Costs in 2026

Global Economic Outlook 2026: 7 Forces Reshaping Markets, Trade and Business

Corporate America Faces a New Debt Test as US Borrowing Costs Surge

Is AI a Stock Bubble in 2026? What the Data Shows

Social Security Extra $90 Deposit: Who Qualifies for the October 2026 Medicare Rebate?
-

 Markets & Finance10 months ago
Top 15 Stocks for Investment in 2026 in PSX: Your Complete Guide to Pakistan’s Best Investment Opportunities
-

 Analysis8 months ago
Johor’s Investment Boom: The Hidden Costs Behind Malaysia’s Most Ambitious Economic Surge
-

 Analysis8 months ago
Top 10 Stocks for Investment in PSX for Quick Returns in 2026
-

 Banks9 months ago
Best Investments in Pakistan 2026: Top 10 Low-Price Shares and Long-Term Picks for the PSX
-

 Analysis9 months ago
Brazil’s Rare Earth Race: US, EU, and China Compete for Critical Minerals as Tensions Rise
-

 Investment9 months ago
Top 10 Mutual Fund Managers in Pakistan for Investment in 2026: A Comprehensive Guide for Optimal Returns
-

 Global Economy10 months ago
15 Most Lucrative Sectors for Investment in Pakistan: A 2025 Data-Driven Analysis
-

 Global Economy10 months ago
Pakistan’s Export Goldmine: 10 Game-Changing Markets Where Pakistani Businesses Are Winning Big in 2025