
Fintech & Global Finance
Capital One vs Wells Fargo: Best Credit Card for Buying Crypto in 2026

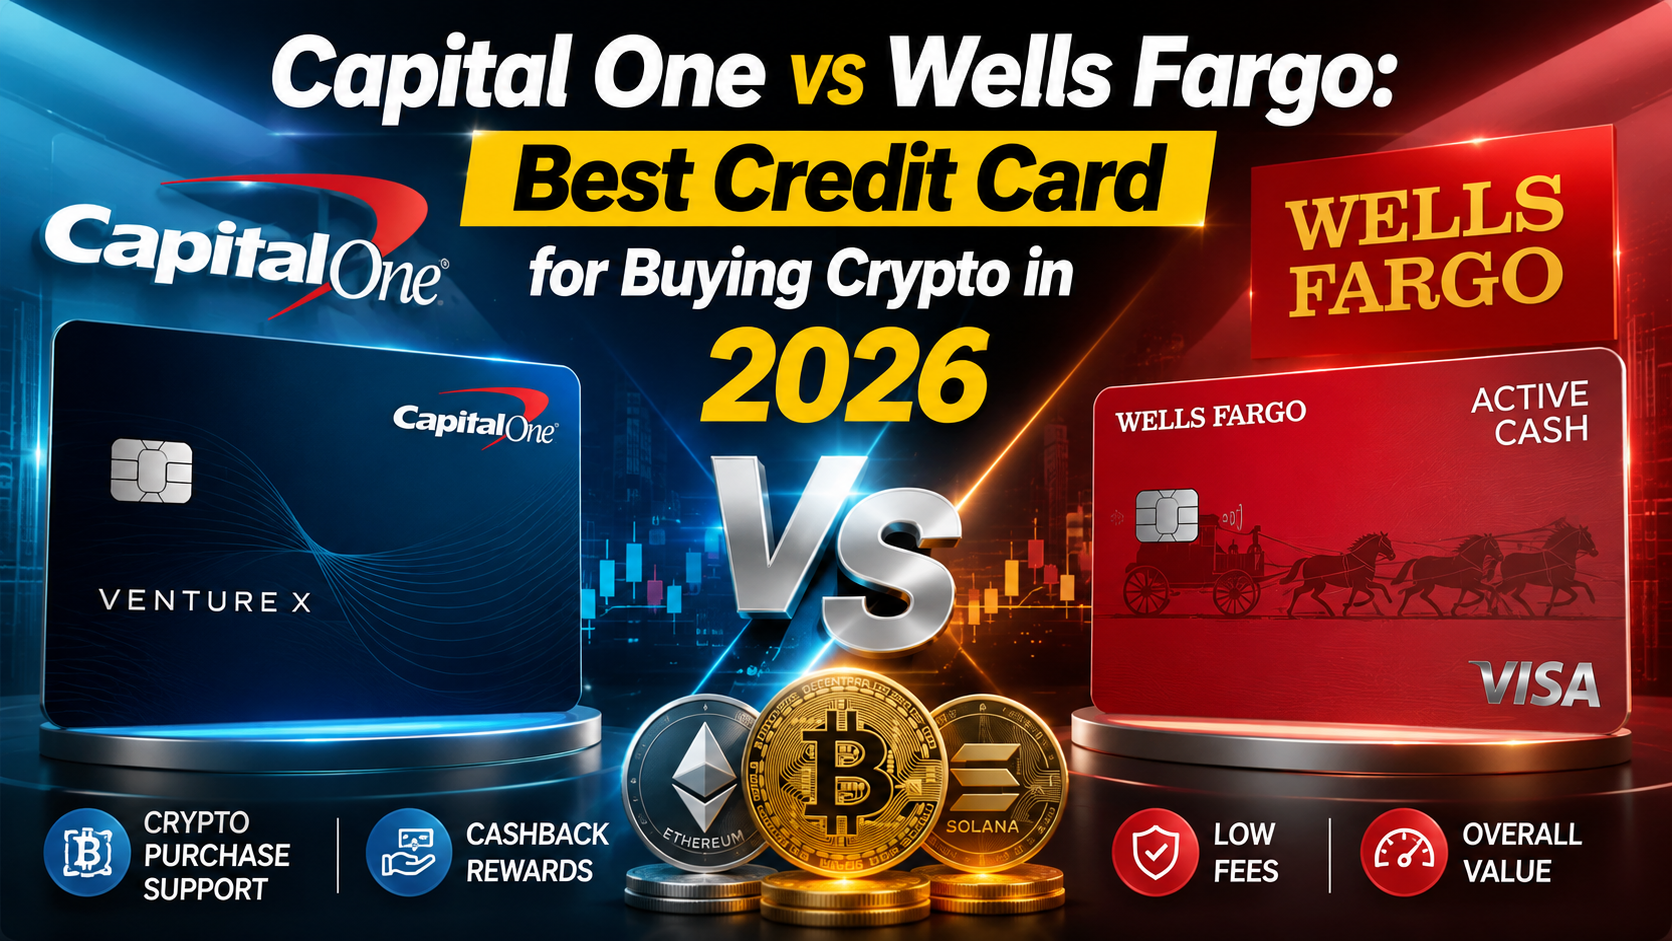
If you’re regularly buying Bitcoin, ADA, or other digital assets, the credit card you use to fund those purchases matters more than most people realize. Between foreign transaction-style cash advance fees, reward point restrictions, and outright purchase blocks, not all cards treat crypto transactions the same way. Capital One and Wells Fargo — two of the largest issuers in the country — have taken noticeably different approaches to crypto purchases, and picking the wrong one can quietly cost you in fees or lost rewards every time you buy.
This comparison breaks down exactly how each bank handles crypto exchange transactions, which cards offer the best terms for frequent crypto buyers, and what fees to watch out for before you tap your card on your next exchange purchase. If you’re actively building a crypto investment strategy, this is the kind of banking detail that adds up fast.
How Banks Classify Crypto Purchases (And Why It Matters)
The single biggest factor affecting your experience buying crypto with a credit card is how your bank codes the transaction. Some exchanges are coded as standard retail purchases, which earn normal rewards and incur no special fees. Others get flagged as “cash advances” or “cash-equivalent transactions” — a classification that typically strips away rewards earning, adds an immediate cash advance fee, and starts accruing interest from the moment of purchase with no grace period.
This classification isn’t always consistent even within the same bank, since it often depends on how the specific crypto exchange’s merchant category code is set up. That’s why understanding your specific bank’s general policy — rather than assuming based on one past transaction — is important before you make a large purchase.
Capital One’s Approach to Crypto Purchases
Capital One has generally taken a more permissive stance on crypto exchange purchases compared to many traditional banks, allowing crypto transactions on several of its consumer credit cards without automatically classifying them as cash advances — though policies can vary by exchange and card product. Rewards cards like the Capital One Venture and Quicksilver lines have been reported by users to process crypto exchange purchases as standard transactions in many cases, meaning you can still earn miles or cash back on your crypto buys.
Wells Fargo’s Approach to Crypto Purchases
Wells Fargo has historically been more restrictive, with several of its consumer credit cards blocking or heavily restricting purchases from major crypto exchanges outright, treating them similarly to gambling transactions in terms of risk classification. This is consistent with the more conservative posture large legacy banks have taken toward crypto exposure, driven partly by regulatory caution and partly by fraud-risk management on high-volatility purchase categories.
Key Differences to Know Before You Buy
- Purchase approval rates – Capital One cardholders report fewer declined crypto transactions than Wells Fargo cardholders
- Rewards eligibility – Standard-coded crypto purchases on Capital One cards can earn regular rewards; Wells Fargo’s more frequent cash-advance classification often strips rewards entirely
- Fee exposure – Cash-advance-classified purchases typically carry a 3-5% fee plus immediate interest accrual with no grace period
- Exchange compatibility – Purchase success can vary by which exchange you’re using, not just which bank issued your card
- Customer support clarity – Neither bank publishes a definitive public list of blocked or approved crypto merchants, requiring direct confirmation from support
Side-by-Side Comparison
| Factor | Capital One | Wells Fargo |
|---|---|---|
| Crypto purchase policy | Generally permissive on most consumer cards | More restrictive, higher decline rate |
| Rewards earned on crypto buys | Often yes (standard purchase coding) | Often no (cash-advance coding common) |
| Cash advance fee risk | Lower | Higher |
| Best card for crypto buyers | Capital One Venture / Quicksilver | Not typically recommended for frequent crypto purchases |
| Customer transparency | Moderate | Low |
How to Avoid Getting Hit With Cash Advance Fees
Regardless of which bank issues your card, a few habits will protect you from unexpected fees when funding crypto purchases:
- Start with a small test transaction before committing to a large crypto buy on a new card
- Check your card’s most recent statement immediately after a crypto purchase to confirm it wasn’t coded as a cash advance
- Consider using a debit card or bank transfer for large purchases if your credit card consistently codes crypto exchanges as cash advances
- Call your bank directly and ask specifically about their crypto merchant category code policy before making a large purchase
- Track any cash-advance-classified crypto purchases and consider disputing incorrectly coded standard retail transactions
Beyond the Purchase: Which Bank Is Better for Crypto Investors Overall?
Purchase friction is only part of the picture. Capital One has also been more active in fintech partnerships and digital banking features that appeal to crypto-active users, including more flexible account linking with major exchanges. Wells Fargo, despite its more conservative crypto purchase policy, still offers strong traditional banking infrastructure that many investors rely on for the fiat side of their crypto activity — moving USD in and out of exchanges, for example, tends to work reliably regardless of the bank’s card-level crypto restrictions.
The Broader Banking Landscape for Crypto Buyers
Capital One and Wells Fargo aren’t the only options worth considering, and it’s worth situating this comparison within the broader landscape of bank policies toward crypto. Several digital-first banks and fintech-forward card issuers have built crypto purchase compatibility directly into their product design, marketing themselves specifically to active crypto investors with guaranteed standard-transaction coding and even crypto-denominated cashback rewards. Traditional banks like Capital One and Wells Fargo, by contrast, generally didn’t design their card products with crypto purchases specifically in mind — their current policies reflect an evolving accommodation of crypto activity within legacy risk and fraud frameworks rather than a purpose-built crypto strategy. For investors who transact in crypto frequently and at meaningful volume, it may be worth maintaining one traditional bank relationship for everyday banking and a separate crypto-optimized card specifically for exchange purchases, rather than trying to force one card to serve both purposes well.
Frequently Asked Questions
Will using a credit card to buy crypto hurt my credit score?
Not directly, as long as you pay off the balance in full and on time — crypto purchases affect your credit utilization the same way any other purchase would. The bigger risk is carrying a balance on a cash-advance-classified crypto purchase, since those often accrue interest immediately at a higher rate than standard purchases.
Can I dispute a crypto purchase that was incorrectly classified as a cash advance?
Yes, this is worth attempting. If a purchase from an exchange that’s typically coded as a standard retail transaction gets flagged as a cash advance, contacting your bank’s dispute department with the transaction details has resulted in reclassification for some cardholders, though outcomes aren’t guaranteed.
Are there credit cards that offer crypto-specific rewards instead of just standard cash back?
Yes, a growing number of crypto-focused credit cards offer rewards paid directly in Bitcoin or other digital assets rather than traditional cash back or points. These are separate from Capital One and Wells Fargo’s traditional card offerings and are worth researching if crypto-denominated rewards specifically appeal to you.
Does it matter which crypto exchange I use with my credit card?
Yes, significantly. Transaction classification often depends more on how the specific exchange’s merchant account is set up than on your bank’s general policy alone, which is why the same bank might process one exchange’s purchases as standard retail and another’s as a cash advance.
Final Thoughts
If you’re a frequent crypto buyer prioritizing rewards and fewer declined transactions, Capital One’s more permissive approach to crypto exchange purchases generally makes it the stronger choice between these two issuers. Wells Fargo’s more conservative stance means a higher chance of hitting cash advance fees or outright transaction blocks, making it less ideal as your primary crypto-buying card — though it may still serve you well for other banking needs. As always with crypto-adjacent banking policies, call and confirm current terms before making a large purchase, since these policies can change without much public notice.
Has your bank ever classified a crypto purchase as a cash advance without warning? Tell us which card and exchange combination worked — or didn’t — for you in the comments.
Discover more from The Economy
Subscribe to get the latest posts sent to your email.


Fintech & Global Finance
Global Market Outlook: Navigating Interest Rates, Inflation, and Commodity Spikes
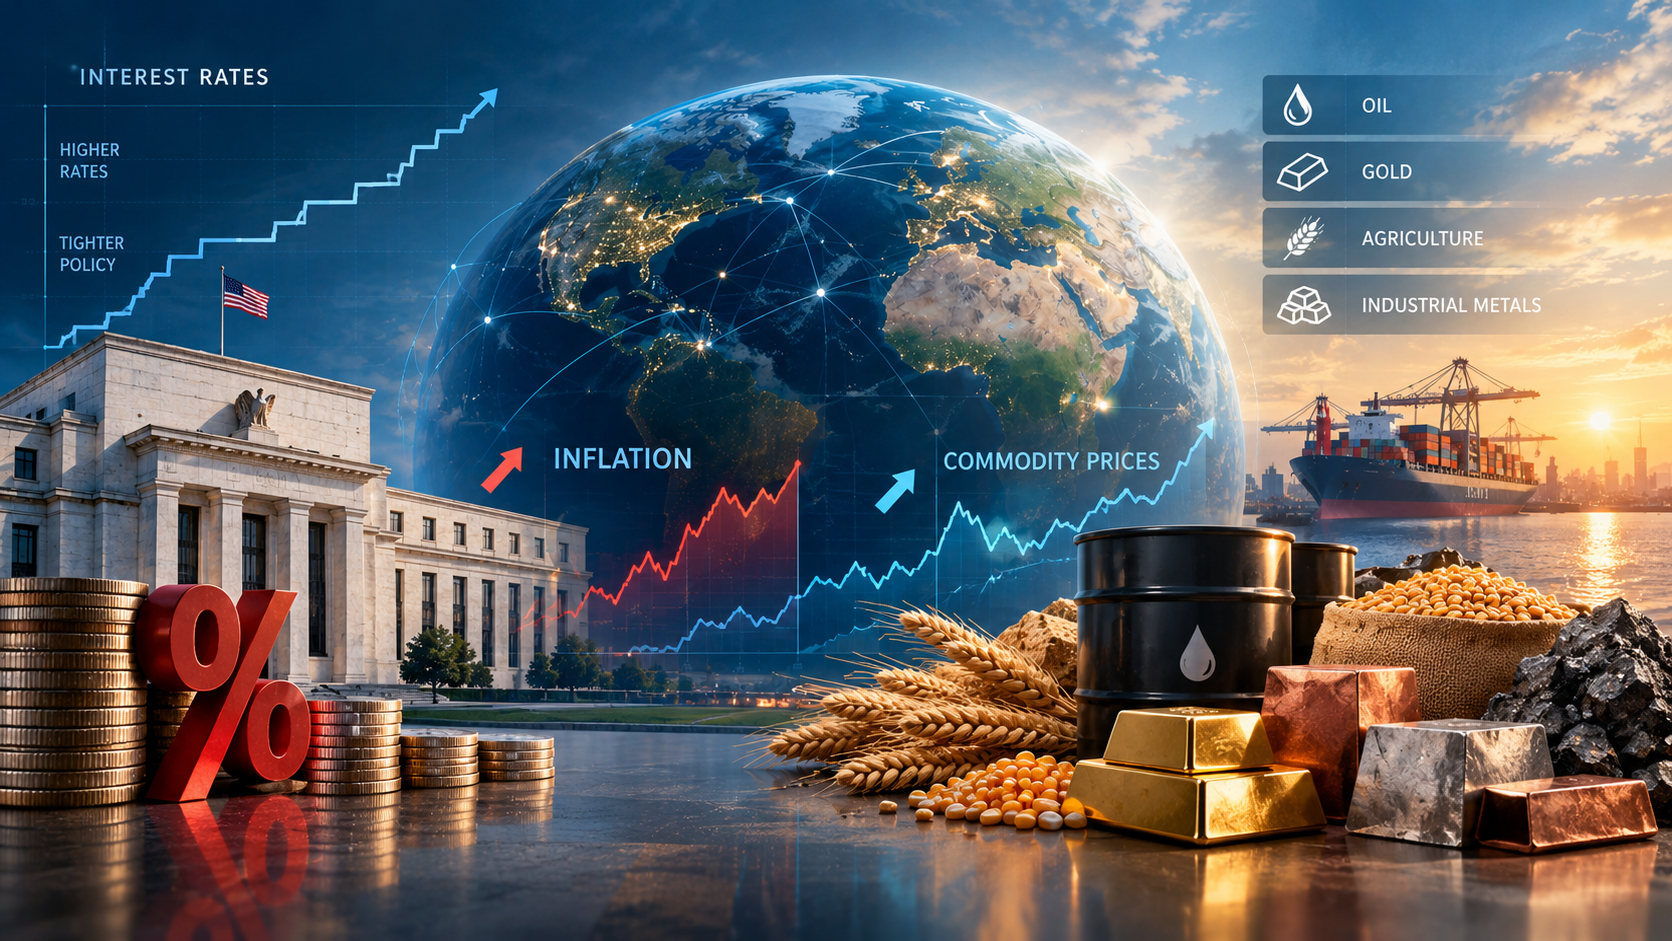
Central banks are now raising rates, not cutting them, as oil tops $100. Here’s where the Fed, ECB, inflation, and crude stand, and what to watch next.
Key Takeaways
- The Federal Reserve raised its target range by 0.25 percentage points on September 16, 2026, to 3.75% to 4.00%. It was the first US hike in several years.
- The European Central Bank has raised rates twice this year, most recently on September 10, bringing its deposit rate to 2.50%.
- US headline inflation was 3.4% year over year in August 2026, with core inflation at 2.4%. The energy component is the main reason headline inflation is above core.
- Brent crude traded above $100 a barrel in early September and was at $100.53 on October 6, after rising more than 30% from early-August lows.
- The main driver is a supply shock tied to the conflict involving Iran, which has disrupted shipping and energy infrastructure. Monetary policy is responding to that shock, not to weak growth.
Search Intent Summary
Readers searching for a global market outlook want to know three things: where interest rates are heading, whether inflation is coming back, and what commodity prices mean for their money. This article covers the current policy settings, the inflation data behind them, and the oil shock driving both.
The Policy Shift: From Cuts to Hikes
Through much of 2025, the Fed was cutting rates. It delivered three consecutive cuts in the second half of that year and then paused. Through the first eight months of 2026, the Fed held at 3.50% to 3.75%, with at least one official dissenting in favor of a hike at the July meeting.
The Fed’s September 15 to 16 meeting changed the picture. The committee raised the target range by 25 basis points, to 3.75% to 4.00%, and the Federal Reserve’s published calendar and statements confirm the meeting schedule. The updated projections point to roughly one more quarter-point increase before year-end, according to secondary analysis of the Fed’s September summary of economic projections. Readers should check the Fed’s own projections table rather than relying on summaries.
Europe moved first. The ECB raised its deposit rate in June, its first hike since September 2023, and again on September 10, to 2.50%. Its main refinancing rate is now 2.65%, and the marginal lending rate is 2.90%. The ECB said it is not committing to a fixed path and will decide meeting by meeting.
The message from both central banks is consistent. Inflation has moved above target because of energy, and the risk is that it becomes entrenched. Cutting rates into an energy shock would be the opposite of what policymakers want to do.
The Inflation Picture
US consumer prices rose 3.4% over the year to August 2026, unchanged from July. The peak this year was 3.8% in April. Monthly headline CPI rose 0.4% in August, with energy up 2.1%.
Core inflation, which excludes food and energy, eased to 2.4% year over year, the lowest reading since March 2021. Core CPI rose 0.3% in August alone, above the 0.2% consensus, which is why markets read the report as hawkish. Real average hourly earnings fell 0.3% over the year, meaning wages are losing ground to prices.
The eurozone shows a similar pattern. Euro-area inflation reached 3.3% in August, its highest since 2023, with energy the main driver. Excluding energy, inflation was about 2.2%. The ECB’s own projections put headline inflation averaging 3.0% in 2026, falling toward 2.5% in 2027 and 2.1% in 2028.
That split matters. When energy drives inflation and core stays contained, central banks face a dilemma. Hiking rates does little to lower oil prices, but it can slow growth and tighten financial conditions.
The Oil Shock
Brent crude is the single biggest variable in this outlook. Brent rose above $100 on September 9, touched $106.60 on September 10 during a 5% one-day jump, and was trading at $100.53 on October 6. Reporting from Khaleej Times attributed the spike to the biggest wave of attacks on shipping since the conflict began, along with the failure of hopes for a lasting ceasefire.
The conflict is now around six months old. The International Energy Agency’s August forecast projected global oil supply falling by about 4.3 million barrels a day in 2026, roughly 4%. OPEC, by contrast, has cut its forecast for world oil demand growth for a fifth straight month, which shows the market is pricing supply risk more than demand strength.
The supply and demand picture is tight. Analysts quoted in September described a “prolonged new normal” in which disruption risk is persistent rather than occasional, and noted limited spare production capacity. The Strait of Hormuz is the key chokepoint in that analysis.
Bond Markets and the Dollar
Rates have moved beyond the policy decisions themselves. Ten-year US Treasury yields reached their highest level since 2023 in early September, and Germany’s ten-year Bund yield hit its highest since 2011 after the ECB decision. That means borrowing costs are rising for governments and households alike, including mortgages.
For the currency picture, the dollar’s direction depends on how the Fed and ECB diverge. The ECB’s deposit rate now sits about 1.00 to 1.25 percentage points below the US range, a gap that generally favors the dollar. If the ECB hikes further than the Fed, that gap narrows. Watch the rate differential, not just the level of rates.
Scenarios for the Next Six Months
Rather than a single forecast, consider three paths. These are analytical scenarios, not predictions.
Base case: elevated energy, gradual hikes. Oil stays above $90 with periodic spikes, inflation hovers around 3%, and the Fed and ECB make one or two more moves before pausing. Bond yields stay high, and rate-sensitive sectors such as housing remain under pressure.
Escalation: oil moves higher and sticks. A sustained disruption pushes Brent well above $100, headline inflation rises again, and central banks face a choice between tightening further and accepting above-target inflation. This is the scenario that most threatens growth.
De-escalation: a durable ceasefire. Oil falls back, headline inflation eases through the rest of the year, and markets start pricing rate cuts again. Earlier in 2026, the Fed’s own projections showed cuts were possible, and a credible ceasefire could revive that path.
The swing factor is the conflict, not the data. Monthly inflation prints matter, but energy prices can overwhelm any single report.
Practical Strategy: What to Watch
For investors, the immediate indicators are the monthly CPI release, weekly oil inventory data, and any shipping disruption news from the Strait of Hormuz. Watch the 10-year Treasury yield as a gauge of financing costs across the economy.
For households and businesses, the practical takeaways are straightforward. Fixed-rate borrowing costs have risen and may stay high. Energy budgets need a buffer. Variable-rate debt is more exposed to further hikes than fixed-rate debt.
For policy watchers, the ECB’s next scheduled decision falls on October 29, and the Fed’s next meeting date is listed on its calendar. Each decision will reflect the most recent inflation and energy data.
This article offers general market context and is not investment advice. Consider speaking with a licensed financial adviser before making decisions based on these trends.
Future Outlook
The regime has changed. Two years ago, the debate was about how fast central banks would cut. Today it is about how far they will hike, and whether energy inflation spreads into wages and services. Core inflation is currently contained, which gives policymakers room to wait. That room shrinks if oil stays above $100 for months.
Frequently Asked Questions
Why are central banks raising rates instead of cutting them?
Inflation is above target in both the US and eurozone, and energy prices are the main driver. Raising rates is intended to keep higher energy costs from spreading into wages and prices across the economy. Both central banks have said decisions will depend on incoming data.
Is inflation falling?
Headline US inflation has eased from a 3.8% peak in April to 3.4% in August, and core inflation is at its lowest level since 2021. However, headline inflation is still well above the Fed’s 2% target, and eurozone inflation rose in August. Whether the trend continues depends largely on energy prices.
How high is oil right now?
Brent traded at $100.53 on October 6, 2026. Oil prices move daily, so check a current quote before relying on any figure. Prices have been volatile since the conflict escalated in early September.
Will interest rates fall in 2026?
The Fed’s September projections point to roughly one more increase by year-end rather than cuts. Market expectations change with each data release and each development in the conflict. Check the Fed’s latest statement and projections for the current outlook.
Discover more from The Economy
Subscribe to get the latest posts sent to your email.

Key Takeaways
- Goldman Sachs wins on profit and returns. In the second quarter of 2026 it reported net earnings of $6.63 billion on net revenues of $20.34 billion. By our math, that is roughly 33 cents of profit per revenue dollar.
- Citigroup wins on sheer revenue. Citi booked $24.8 billion of revenue and $5.8 billion of net income in the same quarter. That works out to about 23 cents of profit per revenue dollar.
- They are different kinds of bank. Goldman is a markets, advisory and asset-management house. Citi is a global transaction bank with a wealth arm, a markets desk and a U.S. consumer business.
- Returns separate the two. Goldman’s return on tangible common equity was 21.3% in the first quarter, while Citi was running at about 13% in the second quarter and still guiding to 10% to 11% for the full year.
- “Leads” depends on the yardstick. Profitability points to Goldman. Global payments plumbing, balance-sheet breadth and turnaround upside point to Citi.
Ask ten bankers which of these two firms leads global finance and you will get ten answers, usually shaped by which floor they work on. A trader at Goldman and a treasury specialist at Citi are, in practice, living in different industries that happen to share a zip code.
So let’s settle it with a scoreboard instead of a debate. This guide compares the two banks using their own filings for the quarter ended June 30, 2026, then adds the context raw numbers can’t carry: strategy, capital return and the unfinished business sitting inside Citi’s turnaround.
One caution before the table. Per-share figures are not comparable across the two firms. Goldman’s $20.98 earnings per share and Citi’s $3.15 reflect very different share prices and share counts, not a seven-fold gap in quality. Compare margins, growth and returns instead.
The Q2 2026 Scorecard
| Metric (Q2 2026) | Goldman Sachs | Citigroup |
|---|---|---|
| Revenue | $20.34B (up 39% year over year) | $24.8B (up 14%) |
| Net income | $6.63B | $5.8B (up 45%) |
| Earnings per share | $20.98 | $3.15 (vs. $1.96 a year ago) |
| Profit per revenue dollar (our calculation) | About 33 cents | About 23 cents |
| Latest return on tangible common equity cited | 21.3% (Q1 2026) | 13% (Q2 2026) |
| Headline capital return | Quarterly dividend raised to $5.00 per share | $30B buyback commitment; dividend increase of about 12% |
Sources: Goldman Sachs Q2 2026 earnings release, Citigroup’s Q2 2026 Form 10-Q and Citi’s Q2 earnings-call highlights. The Goldman return figure comes from the first quarter, the latest in our sources, so treat the ROTCE gap as directional rather than a perfect like-for-like comparison.
How Goldman Sachs Makes Its Money
Goldman’s second quarter was loud. Net revenues rose 39% from a year earlier and 18% from the first quarter. The filing credits the jump primarily to Global Banking & Markets, which produced $15.52 billion, up 53% year over year.
The second engine, Asset & Wealth Management, added $4.60 billion, up 20%. Across the first half of 2026, Goldman generated $37.57 billion of net revenues and $12.26 billion of net earnings.
What does that mix tell you?
- Trading and advisory income is cyclical. It tends to swell when volatility is high and clients are repositioning, which describes much of 2026 so far.
- Asset and wealth management is steadier. Management fees and client inflows give Goldman a base that doesn’t depend on any single week of market chaos.
- The model is capital-light relative to a deposit-funded bank. That is part of why profit per revenue dollar looks so strong, and part of why earnings can swing harder than Citi’s.
The board also lifted the quarterly dividend to $5.00 per share for the third quarter. That is the kind of move a firm makes when it feels good about its earnings power, though dividends are never guaranteed.
How Citigroup Makes Its Money
Citi is built differently. It reports five interconnected businesses (Services, Markets, Banking, Wealth and U.S. Personal Banking) plus a set of legacy franchises being wound down or sold.
In the second quarter, net interest income reached $17.1 billion, up 13%, while non-interest revenue was $7.6 billion, up 18%. One detail stands out: Markets non-interest revenue was $3.0 billion against $3.2 billion a year earlier, so the growth did not come from the trading floor. It came from deposits, fees and the transaction-banking machinery underneath.
That machinery is Services, Citi’s treasury, trade and securities-services franchise. CEO Jane Fraser said it delivered its highest quarterly revenue ever and a return above 30%, per the earnings-call recap.
Think of Services as the plumbing of cross-border commerce. When a multinational moves cash between 90 countries, Citi often sits in the middle. That position is slow to build, hard to replicate and surprisingly sticky.
Profitability and Returns: The Gap That Matters
Return on tangible common equity (ROTCE) measures how much profit a bank earns on the shareholder capital that isn’t tied up in goodwill and intangibles. Analysts lean on it because it translates “how big is the bank” into “how well does the bank use its capital.”
Here is how the two stack up against peers, using first-quarter 2026 figures from Banking Dive:
- JPMorgan: 23%
- Goldman Sachs: 21.3%
- Bank of America: 16%
- Wells Fargo: 14.5%
- Citigroup: 13.1%
Citi is improving fast, with second-quarter net income up 45%, but it is still catching up to the pack. Goldman sits near the top of the table.
Citi’s Unfinished Business
If Goldman’s story is “keep executing,” Citi’s story is “finish the rebuild.” Four items matter.
1. A long runway of return targets
Citi still guides to 10% to 11% ROTCE for 2026. At its May investor day it set a path of 11% to 13% for 2027 and 2028, then 14% to 15% across 2029 to 2031, according to Reuters. Some investors wanted a bolder near-term number, and RBC analysts called the near-term target underwhelming. Management keeps describing 2026 as a waypoint, not a destination.
2. The Banamex exit
Citi has now sold 49% of Banamex, its Mexican consumer franchise. It does not expect further sales in 2026, plans to deconsolidate early in 2027, and will pursue an IPO when markets allow.
3. Capital return
The $30 billion buyback commitment and the planned dividend increase signal confidence, and they shrink the share count, which helps per-share math over time.
4. The transformation program
Fraser said a large body of work passed internal-audit validation during the quarter. For a bank that has spent years under regulatory pressure to fix its controls, that is quiet but meaningful progress.
Which Bank Leads? Seven Lenses
| Lens | Edge | Why |
|---|---|---|
| Profitability and returns | Goldman | Higher profit per revenue dollar and a much higher ROTCE |
| Revenue scale (Q2 2026) | Citi | $24.8B versus $20.34B |
| Cross-border transaction banking | Citi | Services is a record-setting, 30%-plus-return franchise |
| Advisory and capital-markets brand | Goldman | Global Banking & Markets revenue up 53% |
| Earnings stability | Citi, narrowly | Deposit and fee income is less tied to deal and trading cycles |
| Turnaround upside | Citi | More room to close the returns gap if targets are hit |
| Earnings momentum (net income growth) | Goldman | Revenue up 39% year over year in Q2 |
If you force a single verdict, Goldman “leads” on the metric Wall Street weighs most, which is returns on capital. Citi “leads” on the breadth of its global footprint. Neither answer is wrong. They just answer different questions.
What to Watch Next
If you follow bank stocks, three things deserve a spot on your calendar. This is general information, not investment advice.
- Third-quarter earnings. Both banks typically report in mid-October, so check each firm’s investor-relations calendar for exact dates.
- Citi’s ROTCE path. The gap between roughly 13% today and the 14% to 15% medium-term target is the whole equity story.
- Goldman’s trading durability. A quarter of revenue up 39% sets a high bar for the next one.
Asked & Answered
Is Goldman Sachs more profitable than Citigroup?
On the latest quarterly numbers, yes. Goldman earned $6.63 billion on $20.34 billion of revenue, while Citi earned $5.8 billion on $24.8 billion. Goldman converts more of each revenue dollar into profit.
What is ROTCE, and why do analysts care so much?
ROTCE is return on tangible common equity. It shows how efficiently a bank turns shareholder capital into profit, excluding goodwill and intangibles. It is the cleanest single yardstick for comparing banks of different sizes.
Are Goldman and Citi direct competitors?
Partly. They overlap in investment banking and markets trading. Beyond that, Citi is also a global payments, custody, wealth and credit-card business, while Goldman is far more focused on markets, advisory and asset management.
Does the Banamex sale matter for investors?
It does. Selling Banamex releases capital, simplifies the company and clears a long-running distraction. Deconsolidation is expected early in 2027, with an IPO to follow when conditions are right.
When do Goldman and Citi report next?
Both normally publish third-quarter results in mid-October. Confirm the exact dates on each company’s investor-relations page before you plan around them.
Discover more from The Economy
Subscribe to get the latest posts sent to your email.
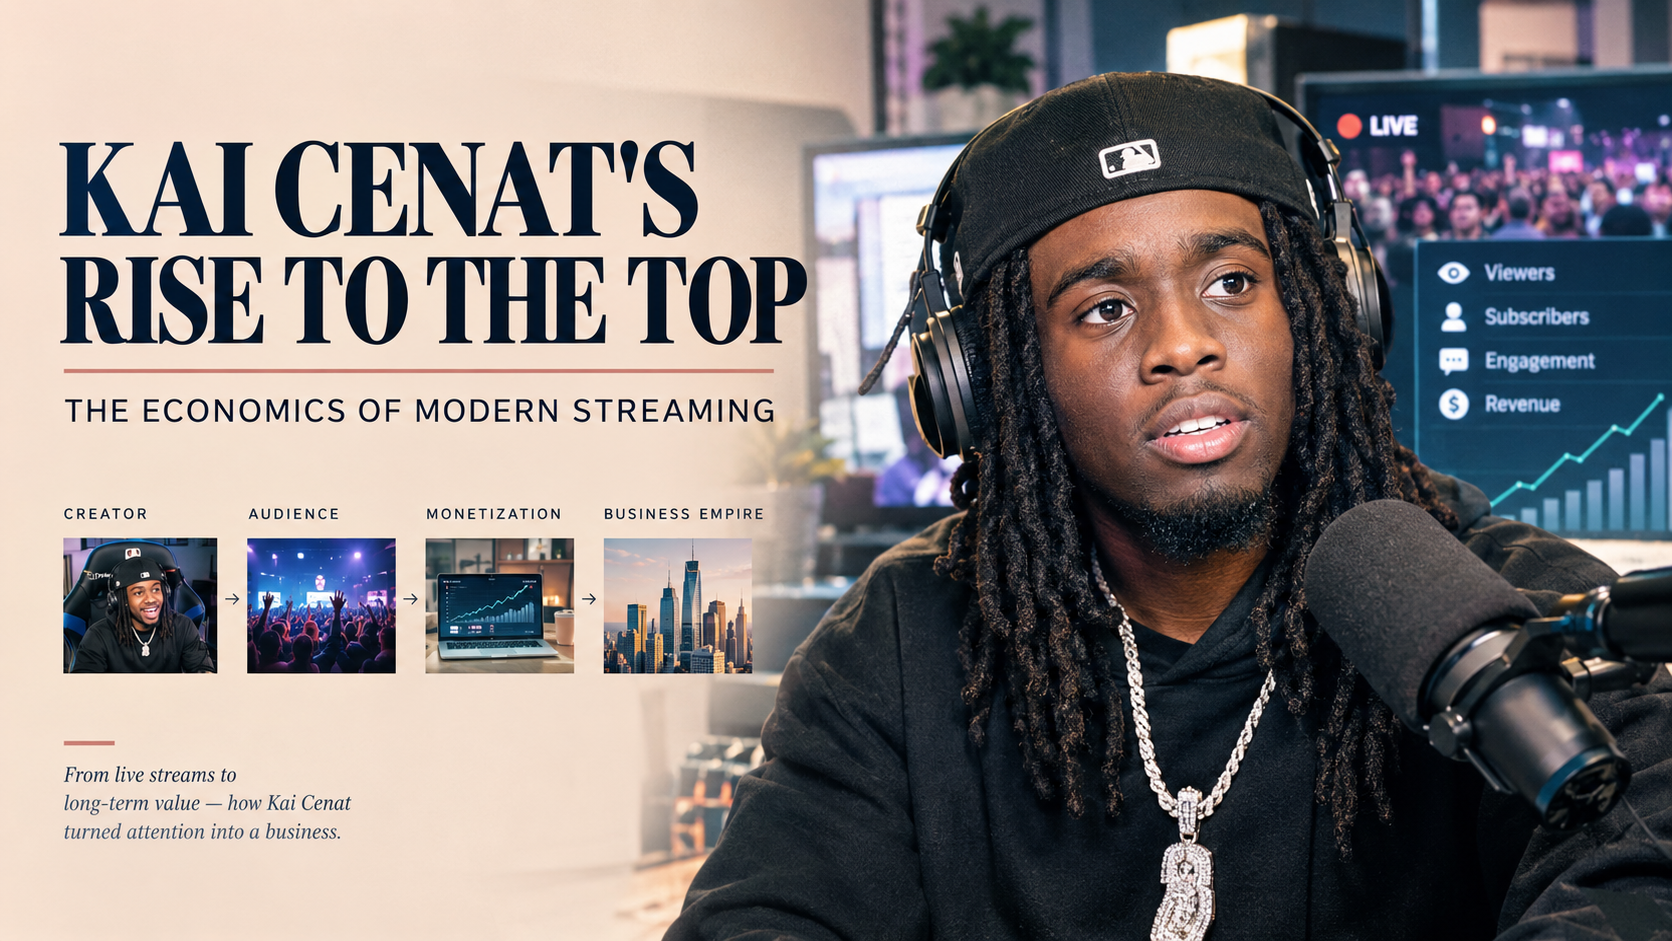
Kai Cenat turned a month of non-stop livestreaming into the biggest subscriber haul in Twitch history, and the business model underneath it is stranger and more lucrative than it looks.
Key Takeaways
- First to 1 million. On September 28, 2025, Cenat became the first Twitch streamer to pass one million active subscribers, during his third “Mafiathon” subathon (Influencer Marketing Hub).
- Record trajectory. His Mafiathon 2 in November 2024 hit roughly 728,000 subscribers, topping the previous record of 326,250 held by VTuber Ironmouse (Yahoo Tech).
- Scale of attention. Mafiathon 3 tallied 82.5 million hours watched and a peak above one million concurrent viewers (Influencer Marketing Hub).
- Revenue engine. Subscriptions are only one layer; sponsorships, celebrity-driven reach, and brand deals multiply the value of each record.
| Event | Date | Subscribers | Notes |
|---|---|---|---|
| Mafiathon 1 | 2023 | ~306,600 | Overtook Ludwig’s record (Wikipedia) |
| Mafiathon 2 | Nov 2024 | ~728,000 | Beat Ironmouse; ~50M unique viewers reported (Yahoo Tech) |
| Mafiathon 3 | Sept 2025 | 1,000,000+ | First streamer past 1M; 82.5M hours watched |
How a Subathon Makes Money
A subathon is a livestream marathon where each new subscription adds time to the clock. The mechanism is simple and powerful:
- Viewers subscribe (a Tier 1 sub costs $4.99 a month).
- Each sub extends the stream, giving fans a stake in the outcome.
- Gift subs spread the effect, letting communities pool money to push the number higher.
- Celebrity guests drive news cycles, pulling in casual viewers who may subscribe once.
Cenat’s 2024 event featured guests such as Snoop Dogg, Kevin Hart, Serena Williams, Lizzo, and SZA, per People of Color in Tech, which also reported the stream was staffed to continue while he slept.
The Revenue Math
Platform splits vary, but Twitch has been reported to keep between 30% and 50% of subscription fees (Yahoo Tech). Using that range, here is an illustrative (not reported) calculation for one month of one million Tier 1 subscriptions:
| Step | Amount |
|---|---|
| Gross at $4.99 × 1,000,000 | ~$4.99 million |
| Streamer share at 50% | ~$2.5 million |
| Streamer share at 70% | ~$3.5 million |
Reality differs: many subscriptions are discounted, gifted in bundles, or on other tiers, and the figure excludes sponsorships and other income. For Mafiathon 2, Yahoo Tech reported an estimated $3.6 million in subscription revenue, a model-based estimate rather than a disclosed number.
Why the Model Works
Attention as an asset
Cenat is the most-followed Twitch streamer, with about 21 million followers, according to Wikipedia. He began streaming on Twitch in February 2021 after moving from YouTube.
Community ownership
Subscribers are not passive; they help set the stream’s length. That participation turns a purchase into an identity.
Event scarcity
Mafiathon happens rarely, so each edition is treated as a cultural moment rather than routine content.
Records as marketing
Every new record generates press coverage that serves as free advertising for the next event.
The Risks Behind the Records
- Concentration risk. One person is the product. Health, burnout, or a platform ban would hit income directly. Cenat was temporarily suspended from Twitch in April 2023 (Wikipedia).
- Platform dependence. Twitch controls the revenue split, rules, and discoverability.
- Subscriber decay. Subathon spikes fade; subscribers often lapse after the event. As of January 6, 2026, Cenat’s channel was listed at about 1.11 million all-time peak subscribers (Wikipedia list), a record, but not a baseline.
- Competition. Streamers such as Jynxzi, IShowSpeed, and others continue to compete for the same audience.
What Marketers and Creators Can Learn
- Design participation, not just content. Let the audience affect the outcome.
- Make events rare and recognizable.
- Use guests as distribution, not just entertainment.
- Diversify income across subscriptions, brand deals, and owned products.
- Treat records as campaigns, with a clear narrative arc.
Frequently Asked Questions
How many subscribers does Kai Cenat have?
He passed 1,000,000 active subscribers on September 28, 2025, the first on Twitch to do so (Influencer Marketing Hub).
How much did Mafiathon make?
Mafiathon 2 was estimated at about $3.6 million in subscription revenue, per Yahoo Tech; official figures were not disclosed.
What is a subathon?
A livestream where each new subscription adds time to the broadcast.
How much does Twitch take from subscriptions?
Reported at 30% to 50%, depending on the streamer’s agreement.
Is Kai Cenat the biggest streamer?
He is described as the most-subscribed and most-followed Twitch streamer as of 2026 (Wikipedia).
Kai Cenat did not just build an audience. He built a machine that converts attention into a countdown clock, and then sold the countdown.
Discover more from The Economy
Subscribe to get the latest posts sent to your email.

Celeste Frozen Pizza Discontinued: What Conagra Confirmed

US–China Critical Minerals Competition: Why a Trade Deal Cannot Fix Every Supply Risk

Oil Price Outlook 2026: How Supply Risks Reach Fuel Bills, Inflation and Business Costs

AI in Business 2026: Why Faster Employees Do Not Automatically Mean Higher Profits

Mortgage Rates in 2026: Why They Remain High and How to Compare the True Cost

Gold Price Outlook 2026: The Forces Behind the Forecasts—and What Could Reverse Them

Global Economic Outlook 2026: Growth, Inflation and Risks

Trump–Putin Diesel Deal: Why Zelensky Is Angry and What It Means for Fuel Prices

Anthropic Draws the Line: Why Claude’s New Usage Policy Explicitly Bans ‘Cruel Behavior’ Toward AI

Ynon Kreiz & Mattel’s Digital Transformation: Franchise Strategy and Financial Growth

Crude Oil & Petroleum Market Analysis: OPEC+ Decisions and Price Forecasts

Top US Convenience Store Chains: Store Counts, EV Charging, and Sales Trends

Publix Store Closures Tracker: Locations, Rebuild Status, and What’s Changing

How to Find Google Maps Fuel Prices and Save on Every Fill-Up

Oil Prices Break $100 in 2026: Middle East Conflict & Energy Markets

China Stocks Today: Are Big Economies in Asia Nearing a Market Bottom?

Middle East War Economics 2026: Oil Prices & Energy Markets

PSX Forecast 2026: KSE-100, IMF Reviews & Geopolitics

Crypto Daily Outlook: Bitcoin, Altcoins, and the Future of Decentralized Finance

Global Pension Systems Ranked: The World’s Best and Worst Retirement Frameworks

Enterprise AI Platforms Disrupting B2B SaaS in 2026: Full Analysis

World’s Largest Economies: Ranking the Top Global Powers

Elon Musk’s Next Moves: Disrupting the 2026 Global Economy

Pakistan Economy 2026: Inside the SBP’s Balancing Act

GasBuddy Market Insights: How Crude Price Shifts Impact Local Fuel Cost Averages

World Bank & IMF Reports 2026: Why the “3% Growth” Consensus Is Actually a Debate

Global Equity Market Divergence: US Tech vs. European Dividend Stocks vs. Asian Growth

Stock Market Today: Dow Climbs 500 Points as Markets Shake Off Inflation Jitters
-

 Markets & Finance9 months ago
Top 15 Stocks for Investment in 2026 in PSX: Your Complete Guide to Pakistan’s Best Investment Opportunities
-

 Analysis8 months ago
Johor’s Investment Boom: The Hidden Costs Behind Malaysia’s Most Ambitious Economic Surge
-

 Analysis8 months ago
Top 10 Stocks for Investment in PSX for Quick Returns in 2026
-

 Banks9 months ago
Best Investments in Pakistan 2026: Top 10 Low-Price Shares and Long-Term Picks for the PSX
-

 Analysis8 months ago
Brazil’s Rare Earth Race: US, EU, and China Compete for Critical Minerals as Tensions Rise
-

 Investment9 months ago
Top 10 Mutual Fund Managers in Pakistan for Investment in 2026: A Comprehensive Guide for Optimal Returns
-

 Global Economy10 months ago
15 Most Lucrative Sectors for Investment in Pakistan: A 2025 Data-Driven Analysis
-

 Global Economy10 months ago
Pakistan’s Export Goldmine: 10 Game-Changing Markets Where Pakistani Businesses Are Winning Big in 2025