
Markets & Finance
Russia Oil Revenue 2026: The Iran War Windfall and What a Hormuz Deal Means for Moscow


While the Strait of Hormuz standoff has driven up costs for oil-importing economies worldwide, it has quietly handed Russia a financial lifeline. Russian oil export earnings rose from an average of $10.4 billion per month in January-February 2026 to $19.1 billion in March, $21.5 billion in April, and $20.8 billion in May, according to the Kyiv School of Economics Institute’s mid-year sanctions assessment. That is roughly a doubling of monthly oil revenue in the space of three months — driven not by any change in sanctions policy, but by the same regional energy shock rattling markets worldwide.
Why the windfall happened despite tightening sanctions
The KSE Institute’s assessment is explicit about the mechanism: serious disruptions to global energy flows caused by the Iran war have prevented more transformative measures against Russian energy exports, leaving the overall sanctions architecture largely unchanged even as policy continued to advance in other areas — continued targeting of Russia’s shadow fleet, anti-circumvention measures, and broader restrictions on financial and military-industrial infrastructure. In effect, elevated global oil prices tied to the Hormuz crisis have provided cover, both financially and diplomatically, for Russia to keep exporting near sanctioned levels while earning substantially more per barrel.
The reversal risk now on the table
This is precisely why the emerging Strait of Hormuz reopening deal matters as much for Moscow as it does for Washington and Tehran. The KSE Institute’s own framing lays out the fork in the road for the second half of 2026: a prolonged global oil crisis would continue to support Russian export and budget revenues, while a faster return of the global oil market to surplus would expose Russia more fully to lower oil revenues, continued stagnation, and mounting fiscal and financing pressures.
Given that US and regional officials described a Hormuz deal as being in its “final stage” this week, the windfall that has propped up Russian government finances since March may be nearing its end — right as Russia’s underlying fiscal position remains structurally weak.
The underlying fiscal picture the windfall has been masking
Strip out the temporary Iran-war boost, and Russia’s core fiscal trajectory looks considerably more strained. The World Bank projects global oil supply moving into surplus, pushing Brent crude from an average of $68 a barrel in 2025 to around $60 in 2026 — the lowest level in five years — a dynamic that would resume once Hormuz-related disruption clears, according to The Moscow Times. To shore up the budget against that backdrop, Russian authorities are raising the VAT rate from 20% to 22% starting January 2026 and lowering the mandatory VAT registration threshold for smaller businesses from 60 million to 10 million rubles — tax increases that fall disproportionately on smaller regional enterprises even as military spending continues to claim an outsized share of the federal budget.
Why sanctions enforcement now hinges on China and India
The KSE Institute assessment argues Russia’s growing economic and fiscal vulnerabilities create additional opportunities to intensify sanctions pressure, proposing new energy, financial, and export-control measures. But the practical effectiveness of any tightened sanctions regime continues to depend heavily on whether China and India are willing to accept the secondary-sanctions risk of continuing to buy discounted Russian crude, according to analysis from CEPA. If China holds firm as a buyer, Moscow’s economic dependence on Beijing deepens further; if enforcement against third-country buyers tightens, the ruble and federal budget would face renewed pressure, potentially pushing the economy toward recession alongside sustained high interest rates.
Key takeaways
- Russian monthly oil export earnings roughly doubled from $10.4 billion (Jan-Feb 2026) to over $20 billion (April-May 2026), driven by the Iran-Hormuz crisis.
- The energy shock has effectively shielded Russia from more transformative Western sanctions measures during this period.
- A Strait of Hormuz reopening deal, now described as in its “final stage,” threatens to remove this windfall just as global oil markets are separately expected to move into surplus.
- Russia is raising VAT from 20% to 22% and lowering the small-business VAT threshold to shore up its budget against underlying fiscal weakness.
- Future sanctions effectiveness depends heavily on whether China and India continue absorbing discounted Russian crude.
FAQ
Why did Russia’s oil revenue rise in 2026 despite sanctions? Global oil prices spiked due to the Iran-Strait of Hormuz conflict, and the resulting disruption limited the West’s ability to pursue more aggressive sanctions on Russian energy exports during that period.
Would a Strait of Hormuz deal hurt Russia’s economy? Potentially yes — it would likely bring oil prices back down toward the World Bank’s projected 2026 average of around $60/barrel, removing the windfall that has cushioned Russia’s budget since March.
What tax changes is Russia making in 2026? VAT is rising from 20% to 22%, and the mandatory VAT registration threshold for small businesses is being lowered from 60 million to 10 million rubles.
Discover more from The Economy
Subscribe to get the latest posts sent to your email.



Crypto’s defining shift this year is not a price rally but a change in who is buying. Public companies now hold more than 1.7 million BTC — roughly 8% of circulating supply — in what analysts describe as structurally sticky, long-term corporate treasury holdings rather than speculative trades, a pattern reinforced by 2025’s GENIUS Act, which established a federal framework requiring stablecoins to be backed 1:1 by cash or liquid assets and audited regularly.
That single change in ownership structure explains almost everything else happening in digital assets this year.
Bitcoin: A Volatile Year, a Steadier Buyer Base
Bitcoin’s 2026 has been anything but smooth. As of mid-September, BTC has traded in a wide band — sliding to roughly $77,600 on September 8 amid a bout of $264 million in liquidations tied to a surging Japanese yen forcing carry-trade unwinds, before recovering into the high-$70,000s, according to market data compiled by CoinDesk. That’s a sharp comedown from the asset’s prior all-time high above $126,000, and it has forced a wave of forecast revisions. Standard Chartered, for instance, cut its end-2026 Bitcoin price target twice in three months — first from $150,000 down, and its XRP target from $8.00 to $2.80 — while still maintaining a bullish multi-year view, with its digital-assets research head suggesting Bitcoin could dip toward the $50,000 range before a longer-term recovery takes hold.
Despite that volatility, the institutional buyer base has kept expanding rather than retreating. BlackRock’s spot Bitcoin ETF, iShares Bitcoin Trust, holds tens of billions of dollars in assets and remains one of the fastest-growing ETFs in history by any measure, while sovereign wealth funds — including Abu Dhabi’s Mubadala — have built billion-dollar-scale Bitcoin ETF positions through regulated vehicles rather than direct custody. Asset manager Grayscale’s 2026 outlook, titled “Dawn of the Institutional Era,” argues that clearer regulation, sustained inflows, and the approaching milestone of the 20-millionth Bitcoin mined could mark a lasting shift toward long-term adoption, even without committing to a specific price target.
XRP: The Bridge-Currency Bet
XRP’s story in 2026 has been more about infrastructure positioning than price momentum. As of mid-September, XRP has traded in the $1.42–$1.43 range, according to pricing aggregated across Yahoo Finance and CoinMarketCap, a level that leaves it well below the bull-case targets some banks floated earlier in the year. XRP’s pitch to institutions has always centered on settlement speed — the token is designed to settle cross-border transactions in three to five seconds, compared with the hours or days incumbent transfer systems require — but that use case has yet to translate into the kind of price action bulls expected.
Seasonality has become a talking point among XRP-focused analysts: historical monthly data shows the token has averaged a 17% gain against Bitcoin in September, followed by an average 19.6% pullback in October, though past patterns are not a reliable guide to any single year’s outcome. What is more durable is the regulatory backdrop: the same GENIUS Act framework governing stablecoins, alongside Europe’s now-active MiCA regulation providing passported access to a market of roughly 450 million people, has removed much of the legal uncertainty that kept larger institutions on the sidelines through prior cycles.
Stablecoins Are the Quiet Story
Featured Snippet Target: Stablecoins have grown into the settlement layer of digital finance rather than a speculative sidebar, with total stablecoin market capitalization reaching roughly $126 billion and supply figures cited elsewhere in the industry running into the hundreds of billions, as major payment networks integrate the technology directly into existing infrastructure.
That integration is visible in who is building it. Visa has partnered with stablecoin infrastructure providers to secure its own network, Mastercard has announced integrations with Circle and Paxos, and a consortium of major U.S. banks has been developing a joint stablecoin initiative, according to reporting from BPM’s blockchain practice. Rather than competing with stablecoin infrastructure, traditional financial institutions are increasingly building on top of it — treating it as plumbing rather than a rival product.
Tokenization of real-world assets — bonds, securities, and exchange-traded products — is following a similar path, with stablecoins increasingly framed by digital-asset strategists as the mechanism that enables atomic settlement for these tokenized instruments. MHC Digital Group’s head of global markets described this convergence of stablecoins, tokenization, and institutionalization as the three themes that will define crypto’s next phase of maturity.
What This Means for the Rest of 2026
Crypto in 2026 looks less like a single asset story and more like a financial-infrastructure story that happens to include two headline tokens. Bitcoin’s price volatility has not deterred the ETF and treasury-holding base that has built up around it; XRP’s price has lagged its use-case narrative but benefits from the same regulatory tailwinds. Sovereign balance sheets are reportedly weighing Bitcoin reserve positions, and DeFi protocols are described by industry analysts as more resilient and better capitalized than in prior cycles.
The risk for anyone covering this space is treating short-term price swings as the whole story. The more durable trend — the one that will matter well past 2026 — is the steady migration of stablecoin rails, custody infrastructure, and tokenized products into the core of mainstream finance.
Next step: Watch the pace of bank-grade custody rollouts and stablecoin payment integrations more closely than daily BTC and XRP price charts — that infrastructure buildout, not short-term volatility, is what will determine whether 2026’s institutional narrative holds up.
Sourcing note: Real-time crypto price figures shift by the hour; the prices cited above reflect data available in the sources linked as of mid-September 2026 and should be checked against a live feed before use in time-sensitive contexts.
Discover more from The Economy
Subscribe to get the latest posts sent to your email.
China Economy
China’s Local Debt Race Against Time: Why Economists Demand Central Action Before the Deflation Window Closes
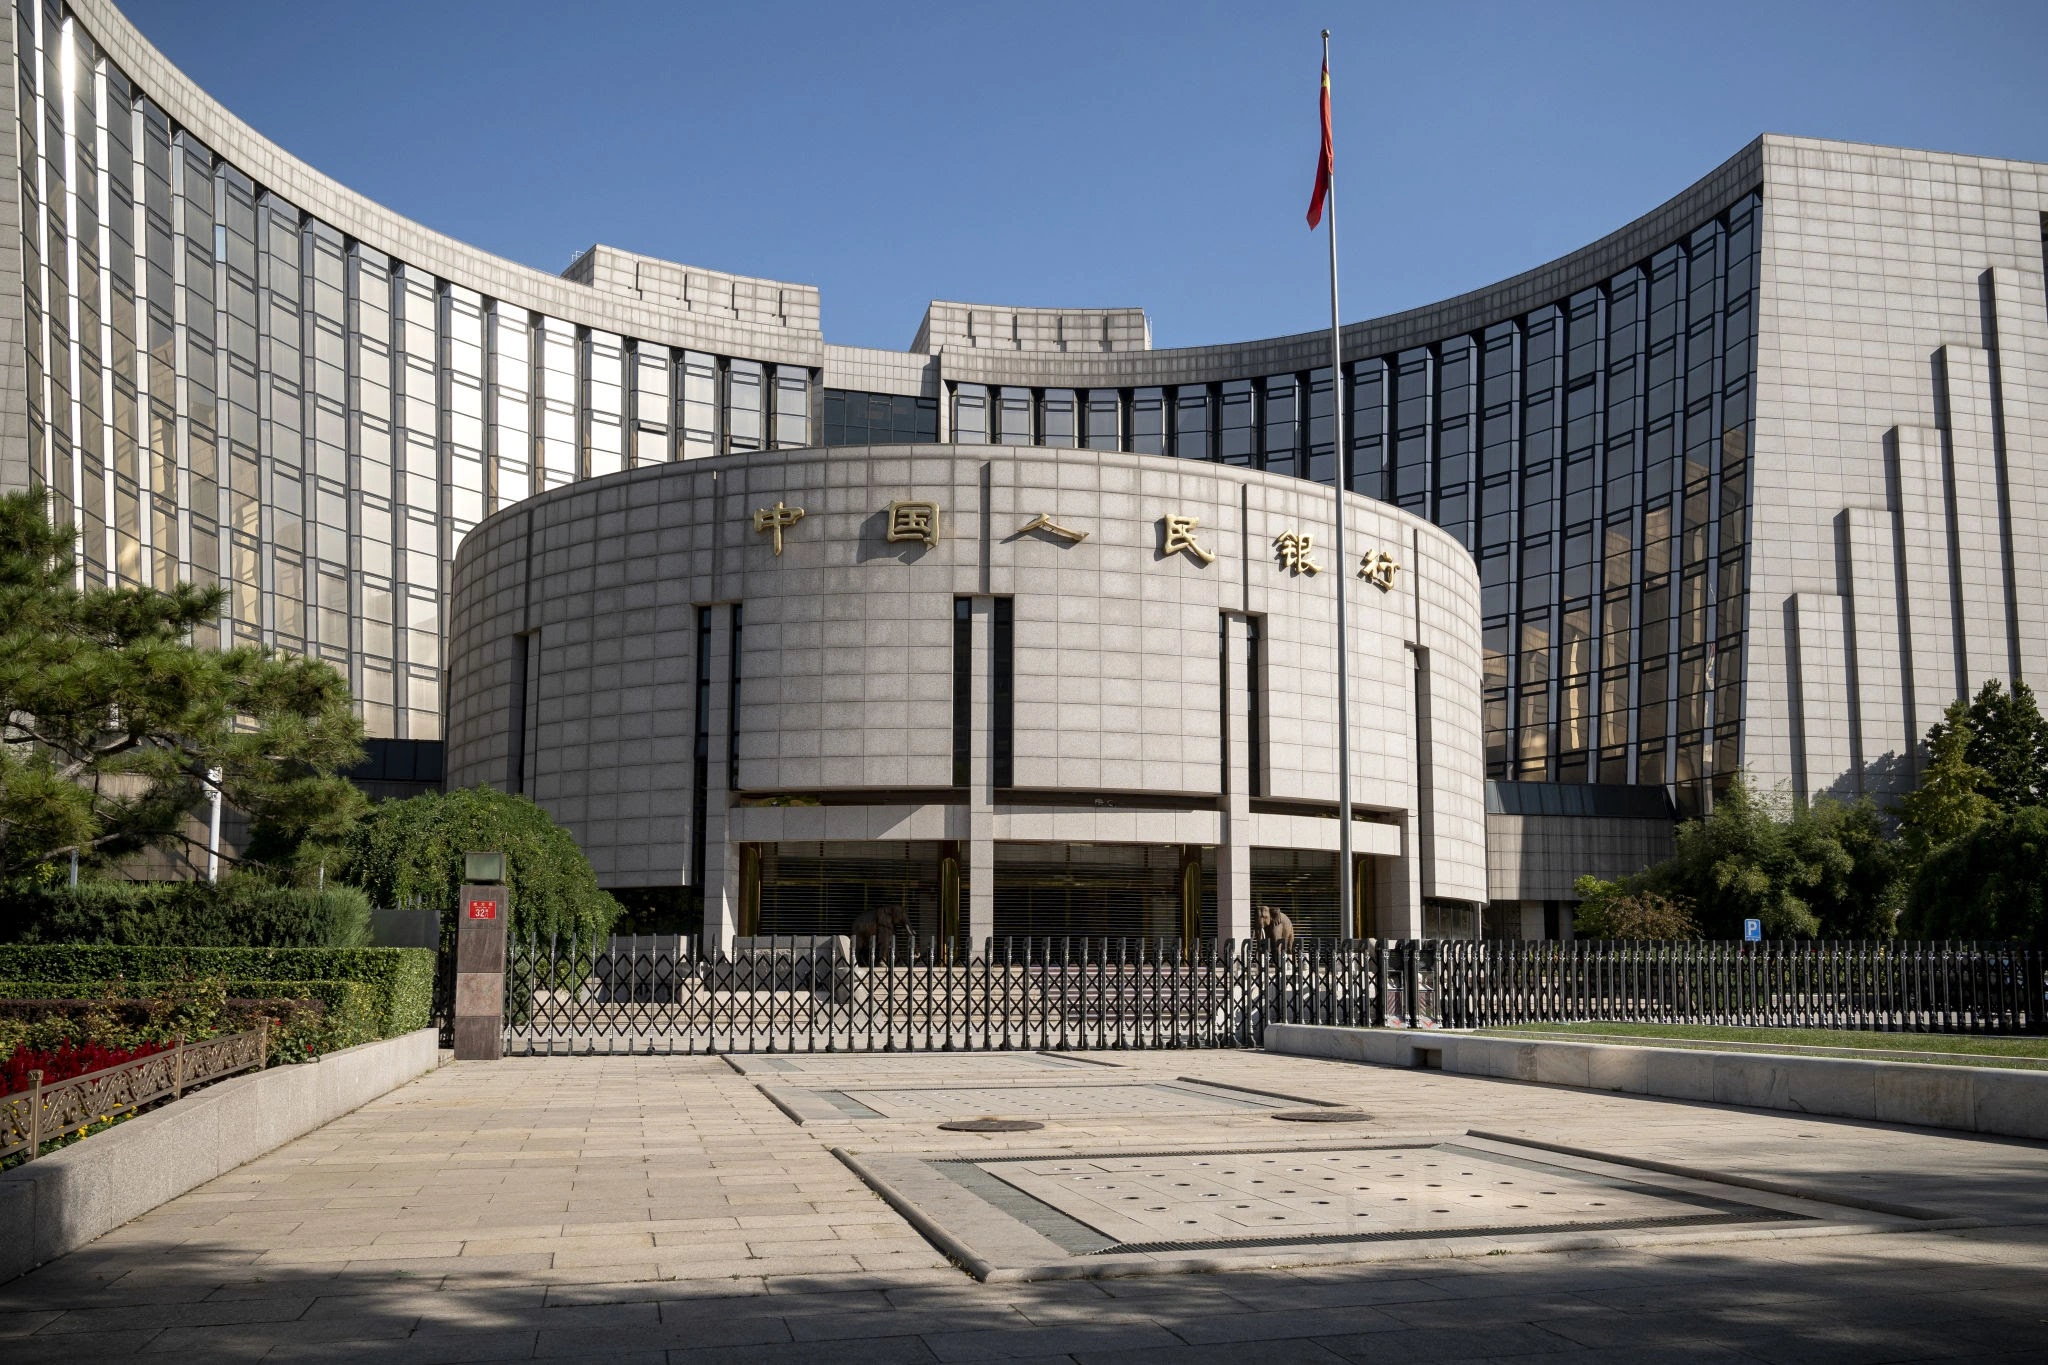
Key Policy Takeaways
- The Fiscal Dilemma: China’s local government hidden debt (off-balance-sheet LGFV liabilities) is estimated by the International Monetary Fund (IMF) to exceed 60 trillion yuan (~US$8.4 trillion).
- The Vanishing Window: Ultra-low benchmark interest rates and weak price indices offer Beijing an ideal window to swap high-cost, short-duration local liabilities for long-duration central sovereign bonds.
- The Risk of Delay: Waiting until inflation rebounds or global monetary policy tightens will significantly increase debt-servicing burdens and squeeze commercial bank margins.
- Structural Reform Needed: Refinancing alone is insufficient; Beijing must overhaul central-local tax distribution to prevent new hidden debts from accumulating.
1. The Perishable Window: Why Low Inflation Is a Double-Edged Sword
Prominent Chinese economic advisors are urging Beijing to capitalize on the country’s prevailing low-interest and soft-price environment to execute a comprehensive debt restructuring. According to research from the World Bank, China’s subdued consumer and producer price trends have created a rare, temporary period where sovereign issuance can be expanded with minimal immediate risk of runaway inflation or surging debt-servicing yields.
When price levels and market borrowing rates are low, the cost of issuing special central government bonds (Treasuries) is at historical troughs. By leveraging this environment, Beijing can absorb or refinance high-yield municipal obligations at fractions of their original servicing cost.
However, macroeconomists warn that this window is shrinking:
[Low Inflation & Low Yields] ──► [Lower Sovereign Issuance Costs] ──► [Ideal Debt Swap Window]
          │                                                                  │
          ▼ (If Delayed)                                                     ▼ (If Executed Now)
[Erosion of Local Revenues] ──► [Rising Default & Credit Risks]   ──► [Restored Fiscal Flexibility]
If Beijing delays central balance-sheet expansion, prolonged deflation risks further eroding local government tax revenues and land sales proceeds. Analysis from S&P Global Market Intelligence indicates that land sales revenues—historically accounting for up to 30% of municipal fiscal funds—have dropped significantly from their peak levels, leaving local authorities without the primary engine used to service off-balance-sheet vehicles.
2. The LGFV Mechanics: How Hidden Debt Stalls Regional Growth
The root of China’s fiscal challenge lies in Local Government Financing Vehicles (LGFVs)—special entities created by provinces and cities to finance public infrastructure without officially breaching central deficit caps.
The Anatomy of China’s Municipal Balance Sheet
- Official Municipal Debt: Directly tracked bonds subject to strict quota limits set by the National People’s Congress.
- Implicit / Hidden LGFV Debt: High-cost, off-balance-sheet bank loans, corporate bonds, and shadow banking products carrying implicit guarantees but yielding insufficient commercial returns.
As highlighted in a macroeconomic study by the Peterson Institute for International Economics (PIIE), when local debt-servicing costs outpace local economic growth, municipal governments are forced into fiscal austerity. This results in delayed civil service pay, cuts to public transit subsidies, and reduced local procurement—directly depressing domestic demand and compounding broader deflationary pressures.
3. The “Involution” Loop: Price Wars and Subsidized Capacity
A critical dynamic overlooked in conventional coverage is how local debt fuels industrial “involution” (内卷)—cutthroat, race-to-the-bottom price competition.
Faced with declining traditional tax revenues and mounting debt obligations, regional authorities frequently use local subsidies, cheap land allocation, and state-directed credit to prop up favored local manufacturing sectors (such as solar components, EV parts, and industrial chemicals).
┌────────────────────────────────────────────────────────────────────────┐
│                        THE INVOLUTION CYCLE                            │
├────────────────────────────────────────────────────────────────────────┤
│ 1. Local Debt Pressure  ──► Municipalities seek fast industrial GDP    │
│ 2. Target Subsidies     ──► Directed capital into local manufacturing  │
│ 3. Industrial Overcap   ──► Manufacturers overproduce to maintain scale  │
│ 4. Price Wars (CPI/PPI) ──► Deflationary pressure squeezes margins     │
│ 5. Lower Tax Revenues   ──► Debt burden expands relative to revenue    │
└────────────────────────────────────────────────────────────────────────┘
According to sector reporting from Rhodium Group, this localized credit allocation keeps unproductive firms afloat, floods domestic markets with overcapacity, and drives price deflation across industrial outputs. To break this loop, economists argue that Beijing must restrict local industrial subsidies while substituting them with direct central transfers to households.
4. Policy Roadmap: How Beijing Can Safely De-Risk Local Liabilities
To outperform past partial debt swaps, top financial experts recommend a coordinated four-point execution plan:
| Strategic Pillar | Action Item | Target Economic Outcome |
| 1. Central Balance Sheet Expansion | Issue Ultra-Long Special Sovereign Bonds to swap LGFV debt into central debt. | Reduces aggregate interest payments by hundreds of billions of yuan annually. |
| 2. Commercial Bank Shielding | Structure interest rate cuts alongside targeted PBoC liquidity injections. | Protects bank Net Interest Margins (NIMs) from lower bond yields. |
| 3. Tax Revenue Sharing Reform | Rebalance the 1994 tax-sharing system to allocate a higher tax share to local authorities. | Permanently aligns municipal spending obligations with recurring revenue. |
| 4. Consumption-Focused Stimulus | Shift state expenditures from physical infrastructure to social security, healthcare, and income support. | Unlocks household savings and drives organic demand-led reflation. |
Reports from the Organisation for Economic Co-operation and Development (OECD) emphasize that structural fiscal reform—specifically updating the distribution of revenues between Beijing and provincial capitals—is necessary to prevent local governments from simply building new hidden debt after the current swap is completed.
5. Global Implications for Investors and Markets
For international markets, China’s decision to act decisively on local debt carries substantial weight:
- Commodity & Global Demand: Restructuring local debt allows municipalities to resume core public works and social spending, stabilizing demand for global industrial metals and capital equipment, as monitored by the Asian Development Bank.
- Currency and Yield Dynamics: As noted by analysis in the Financial Times and market coverage in Bloomberg News, a central government debt swap reduces tail-risk in China’s financial sector, offering long-term stability for the Renminbi (RMB) even as benchmark rates remain low.
- Banking Sector Relief: Replacing non-performing or low-yielding LGFV loans with sovereign-backed paper lowers credit risk weights for state banks, preserving regulatory capital buffers across the broader financial system.
Discover more from The Economy
Subscribe to get the latest posts sent to your email.

The World Bank’s June 2026 assessment carries a phrase that should stop any investor mid-scroll: a “lost decade” of development for many emerging markets.
Global growth is projected to slow from 2.9% in 2025 to 2.5% in 2026 — the lowest rate since the COVID-19 pandemic — amid weaker prospects for energy-importing economies and those directly affected by hostilities.
Within that aggregate, Asia is splitting into two distinct groups. Understanding which side an economy falls on is now the primary emerging-market allocation decision.
Key Takeaways
- Global growth: 2.5% in 2026, firming in 2027–28 as energy supplies recover and trade strengthens.
- The revision was brutal. January 2026 projected 2.6% with an upward revision; June cut it.
- India remains the outlier. FY2026-27 growth of 6.6%, rebounding to 7.2% in FY2027-28.
- China decelerates. Growth slowing to 4.4% in 2026 from 4.9%.
- The 2020s are on track to be the weakest decade for global growth since the 1960s.
The Two Reports That Define 2026
The World Bank publishes Global Economic Prospects twice a year, and the gap between the January and June 2026 editions is the story.
January: Cautious Optimism
The January report described a global economy proving more resilient than anticipated despite persistent trade tensions and policy uncertainty, with growth easing to 2.6% in 2026 before rising to 2.7% in 2027 — an upward revision from the previous June forecast.
About two-thirds of that upgrade came from the United States alone.
June: The Energy Shock
By June, the Middle East conflict had driven sharp energy price increases and the projection fell to 2.5%, with emerging market and developing economies facing the weakest per capita income growth since the pandemic.
The Bank explicitly notes that the conflict’s impact on global trade has been partly offset by robust AI-related investment, while consensus inflation expectations picked up notably following the energy price surge. Local-currency bond yields and external bond spreads remained higher in commodity importers.
That last sentence is the whole emerging-market thesis in one line: commodity importers are paying more to borrow at exactly the moment they need to borrow more.
Asia’s Two Tiers
| Economy | Projection | Position |
|---|---|---|
| India | 6.6% FY26-27, 7.2% FY27-28 | Domestic-demand-led, upgraded |
| China | 4.4% in 2026 (from 4.9%) | Export-supported, stimulus-dependent |
| EMDEs (all) | 4.0% in 2026 (from 4.2%) | Slowing |
| EMDEs excl. China | 3.7% in 2026 | Flat versus 2025 |
| United States | 2.2% in 2026 | Tax-incentive supported |
The EMDE-excluding-China figure of 3.7%, unchanged from 2025, is the number that matters most and gets quoted least. Strip out China, and the developing world is not slowing — it simply is not accelerating. Stagnation at a level too low to close income gaps.
The India Case
India stands apart in the June projections. Growth is projected to moderate to 6.6% in FY2026-27 — a 0.1 percentage point upgrade relative to January — before rebounding to 7.2% in FY2027-28, a 0.6 point upgrade.
The moderation reflects private demand cooling under input cost pressures. The rebound reflects structural factors:
- Trade agreements. Implementation of major FTAs with the EU, UK and Australia is described as crucial to offsetting cooling merchandise demand from traditional Western markets.
- FDI sustainability. Trade agreements and structural business reforms are expected to sustainably support inflows across the forecast horizon.
- Fiscal trade-offs. Lower fuel taxes and GST reforms temporarily erode the revenue base, requiring a shift toward slower public capex growth and current spending cuts to avoid deficit spikes.
That last point is the underappreciated risk. India’s growth upgrade is partly financed by revenue concessions that must eventually be reversed or absorbed.
The China Case
China’s projected slowdown to 4.4% in 2026 came with an upward revision of four-tenths of a percentage point from the previous June forecast, attributed to fiscal stimulus and increased exports to non-US markets.
That revision has since been validated by trade data. The question for 2027 is whether export strength can persist if global demand slows to the 2.5% pace the Bank projects.
China’s position is structurally different from India’s: externally driven where India is domestically driven, stimulus-dependent where India is reform-dependent.
What the “Lost Decade” Framing Actually Means
The World Bank’s language is deliberately stark. If current forecasts hold, the 2020s are on track to be the weakest decade for global growth since the 1960s and too low to avert stagnation and joblessness in emerging market and developing countries.
The distributional evidence is concrete: at the end of 2025, nearly all advanced economies enjoyed per capita incomes exceeding their 2019 levels, but about one in four developing economies had lower per capita incomes than before the pandemic.
Chief Economist Indermit Gill framed the underlying tension precisely: the global economy has become less capable of generating growth while appearing more resilient to policy uncertainty — a divergence he warned cannot persist without fracturing public finance and credit markets.
Investment Implications by Tier
Tier 1 — Energy importers in the technology value chain. India, Vietnam, Malaysia, Taiwan, Korea. AI-related export revenues offset higher energy costs. Currency and equity performance has held up.
Tier 2 — Energy exporters outside the conflict zone. Gulf states excluding those directly affected, parts of Africa and Latin America. Favourable terms of trade, fiscal space expanding.
Tier 3 — Energy importers outside the technology chain. Pakistan, Bangladesh, Sri Lanka, Kenya, much of Sub-Saharan Africa. Higher import bills, higher borrowing costs, no offsetting export windfall.
Tier 3 is where sovereign stress concentrates. Higher local-currency bond yields and wider external spreads in commodity importers mean refinancing costs rise as fiscal positions deteriorate.
What This Means for the Global Market in 2027
The 2027 recovery is conditional on two assumptions. Activity is expected to firm in 2027–28 as energy supplies recover and trade strengthens. Both require the conflict to de-escalate. Neither is guaranteed.
AI adoption is the identified upside. The Bank names artificial intelligence adoption, clean energy investment and regional trade agreements as potential long-term recovery catalysts. Only the first is currently delivering at scale.
Sovereign debt is the accumulating risk. Elevated yields in commodity importers compound every year they persist. A 2027 refinancing wave at current spreads would strain multiple frontier sovereigns simultaneously.
Regional trade agreements are the underrated policy lever. India’s FTA implementation is the clearest test case. If it delivers the projected FDI and export offset, it becomes a template for the rest of emerging Asia.
Compare the IMF and World Bank carefully. The Fund projects 3.0% for 2026; the Bank projects 2.5%. The difference is methodological — PPP versus market exchange rate weighting — not a disagreement about the world.
Frequently Asked Questions
What is the World Bank’s global growth forecast for 2026?
The June 2026 Global Economic Prospects projects global growth slowing to 2.5% in 2026, down from 2.9% in 2025 — the lowest rate since the pandemic.
What is India’s projected GDP growth?
India is projected to grow 6.6% in FY2026-27 before rebounding to 7.2% in FY2027-28, both upgrades relative to January 2026 projections.
Why are World Bank and IMF forecasts different?
The World Bank weights using market exchange rates while the IMF uses purchasing-power-parity weights, which gives more weight to faster-growing emerging economies.
What does “lost decade” mean for emerging markets?
The Bank warns the 2020s could be the weakest decade for global growth since the 1960s, with roughly one in four developing economies having lower per capita incomes at end-2025 than in 2019.
Discover more from The Economy
Subscribe to get the latest posts sent to your email.

Bitcoin & XRP 2026: Inside Crypto’s Institutional Era

Global Economy 2026: IMF Growth, AI Stocks & Market Risk

China’s Local Debt Race Against Time: Why Economists Demand Central Action Before the Deflation Window Closes

Money News: How to Protect Your Portfolio From Global Inflation

World Bank Projections: Emerging vs. Big Economies of Asia

IMF Reports 2026: What the Latest Data Means for the Global Economy

Singapore Stocks Outlook: A Safe Haven in the Asian Market?

China Stocks vs. Japan Stocks: Where Should You Invest in Late 2026?

VIX Index Explained: How to Trade Wall Street’s Fear Gauge Today

Commercial vs Residential Real Estate: Which Wins in 2026?

Presidential Stock Market Performance: How Trump’s Second Term Compares to History

2026 Real Estate Market News: Are We Heading for a Correction?

Bitcoin Price Forecast 2026–2027: Will the 4-Year Cycle Hold?

Fidelity Crypto vs. Traditional Brokerages: A Guide for Modern Investors

US-China Relations in Q3 2026: Trade Tariffs and Supply Chain Risks

Top 30 Stocks for Investment in PSX for Massive ROI in 2026

SpaceX Starship Flight 14: First Orbital Attempt & Starlink V3 Launch Explained

AI Chip Stocks 2026: The Best Semiconductor Investments Beyond Marvell

The 2026 Crypto Regulatory Shift: What It Means for Institutional Investors

Tween Back-to-School Trends 2026: What’s Driving the $85B Season

AI-Powered Training: The Next Multi-Billion Dollar Ecosystem in Fitness

Oil Prices Break $100 in 2026: Middle East Conflict & Energy Markets

10-Year Treasury Yield Hits 4.80%: What It Means for Rates & Portfolios

Fidelity Investments Review 2026: SPAXX Yields & Zero-Fee Funds

BRICS+ Cross-Border Payments 2026: Interoperability Explained

Shein Clothes Quality & Safety in 2026: What Lab Tests Show

MRVL Earnings 2026: Why Marvell Sank Despite Beating Estimates

China’s US$10.8 Billion Trade Shortcut: Why the Pinglu Canal Matters
-

 Markets & Finance9 months ago
Top 15 Stocks for Investment in 2026 in PSX: Your Complete Guide to Pakistan’s Best Investment Opportunities
-

 Analysis7 months ago
Johor’s Investment Boom: The Hidden Costs Behind Malaysia’s Most Ambitious Economic Surge
-

 Analysis7 months ago
Top 10 Stocks for Investment in PSX for Quick Returns in 2026
-

 Analysis8 months ago
Brazil’s Rare Earth Race: US, EU, and China Compete for Critical Minerals as Tensions Rise
-

 Banks8 months ago
Best Investments in Pakistan 2026: Top 10 Low-Price Shares and Long-Term Picks for the PSX
-

 Investment8 months ago
Top 10 Mutual Fund Managers in Pakistan for Investment in 2026: A Comprehensive Guide for Optimal Returns
-

 Global Economy9 months ago
15 Most Lucrative Sectors for Investment in Pakistan: A 2025 Data-Driven Analysis
-

 Global Economy9 months ago
Pakistan’s Export Goldmine: 10 Game-Changing Markets Where Pakistani Businesses Are Winning Big in 2025