
Analysis
Why China’s Demand Stimulus Still Isn’t Working

In a supermarket in Fuyang this past February, shoppers pushed carts past red lanterns and “Golden Horse Welcoming Spring” banners during China’s longest Lunar New Year holiday on record. Rail networks carried more than 18.7 million passengers in a single day, and Hainan’s duty-free counters rang up 30.8% more sales than a year earlier. For a few weeks, it looked like Beijing’s demand stimulus push might finally be taking hold. The relief didn’t last. By May, retail sales had fallen 0.6% year-on-year — the first monthly decline in more than three years. Xi Jinping has spent eighteen months promising to make households, not factories, the engine of Chinese growth. The data keep saying otherwise.
That gap between rhetoric and reality sits at the centre of China’s economic story heading into the first year of the 15th Five-Year Plan. For two decades, growth has leaned on investment and exports — a model the IMF’s chief economist, Pierre-Olivier Gourinchas, has said needs to “pivot to a more domestically-driven engine of growth.” The IMF now projects China’s GDP growth will slow to 4.5% in 2026, down from 5% in 2025, with private domestic demand described as lackluster even as headline inflation averaged zero percent last year. The World Bank reaches a similar conclusion: households kept funnelling savings into bank deposits through 2025 despite real interest rates that were flat or negative, while local government revenue stayed squeezed by a continued slide in land-lease income. Beijing has answered with trade-in subsidies, interest-rate cuts and a 48-measure consumption action plan. None of it has shifted the basic arithmetic: China still saves more, and spends less, than almost any economy its size.
China’s Demand Stimulus Keeps Hitting the Same Wall
The headline number from May was stark. China’s National Bureau of Statistics reported retail sales fell 0.6% year-on-year, the first such drop since December 2022, reversing April’s 0.2% gain and missing even the most pessimistic forecasts in a Reuters poll. Home appliance and audiovisual equipment sales plunged 15.6%; auto sales tumbled 16.1%, extending an eighth consecutive month of decline in the world’s largest car market. Only services kept the picture from looking worse: spending on catering, travel and entertainment grew 5.4%, outpacing goods retail by 4.2 percentage points, according to Caixin Global.
Beijing’s response was immediate but modest. The government injected a fresh 62.5 billion yuan ($9.2 billion) into the consumer trade-in scheme by the end of June, even as it quietly scaled the 2026 program back to 250 billion yuan from 300 billion yuan in 2025, narrowing eligibility to cars, appliances and smart glasses. Nine government departments also rolled out a joint action plan built around 48 separate measures, spanning:
- Subsidised dining and catering vouchers in lower-tier cities
- Expanded reimbursement for elder-care and healthcare services
- Relaxed visa rules to draw foreign tourist spending
- Additional tax-refund points at border crossings for inbound shoppers
It’s a familiar pattern. The Ministry of Commerce says the broader trade-in program has driven 4.16 trillion yuan in cumulative sales since launch — real money, by any measure. Yet the same dataset shows why the lift keeps fading: full-year 2025 retail sales growth came in at 3.7%, trailing industrial output’s 5.9% expansion and the economy’s overall 5% growth rate, Reuters reported. Growth bottomed at 0.9% year-on-year in December, recovered to 2.8% in early 2026, then slipped to 1.7% by March as the subsidy cycle turned, in the words of analysts at ING, “from a tailwind to a headwind.” Auto sales fell 9.1% in the first quarter even as China’s passenger-car exports jumped 60.6% — a sign that excess domestic production is increasingly finding buyers abroad rather than at home.
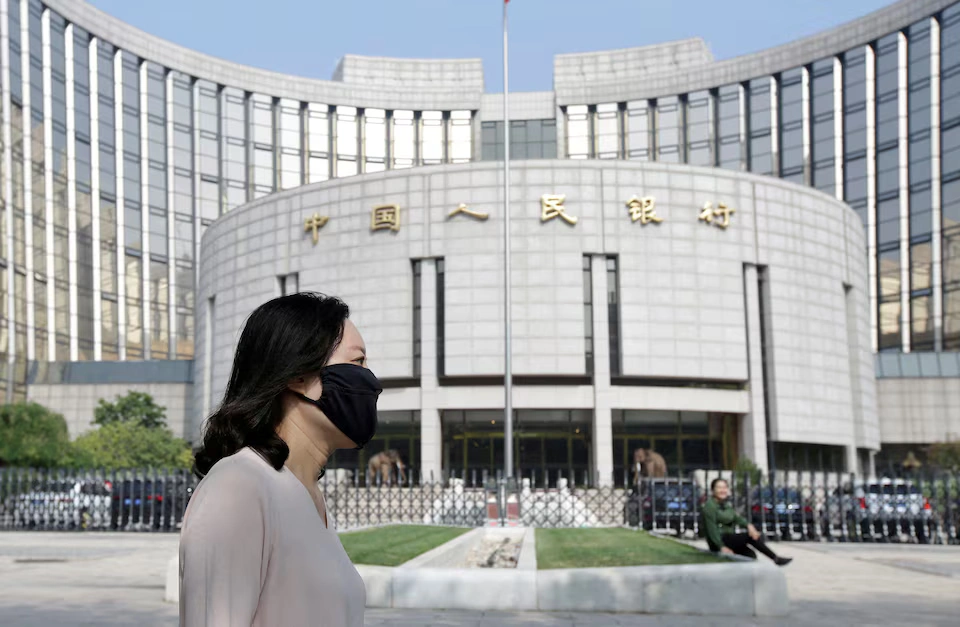
Monetary policy moved alongside the fiscal support. The People’s Bank of China entered 2026 promising a “moderately loose” stance and in January cut interest rates on several structural lending tools by 0.25 percentage points, lowering the one-year central bank lending facility rate from 1.5% to 1.25%. Governor Pan Gongsheng has signalled more is coming, telling Xinhua there is “still room for further RRR and interest rate cuts this year.” New refinancing tools are now earmarked specifically for services consumption and elder care — a quiet admission that goods subsidies alone weren’t going to do the job. Consumer prices briefly perked up too: CPI rose 1.3% year-on-year in February, the fastest pace in three years, before easing to 1.0% in March as core inflation slipped from 1.8% back to 1.1%. Producer prices, meanwhile, are still falling, extending a fourth straight year of factory-gate deflation.
There’s also a self-inflicted wound. Beijing’s “anti-involution” campaign, aimed at curbing cut-throat price wars among manufacturers of everything from solar panels to electric vehicles, is meant to fix a supply-side problem. But the IMF’s Article IV report warns that continued industrial-policy support for priority sectors risks perpetuating the very overcapacity it’s trying to cure, adding to deflationary pressure rather than easing it. Subsidise demand with one hand and subsidise supply with the other, and the price level barely moves.
Why China’s Household Savings Rate Won’t Budge
Subsidies treat a symptom. The disease is precautionary saving, and it’s structural rather than cyclical. A December 2025 IMF working paper by economists Yizhi Xu, Fan Zhang, Rongyu Cui and Ding Hua traces China’s stubbornly high household savings rate to three forces that reinforce one another: thin social spending in rural areas, the hukou household-registration system that denies many migrant workers full access to urban healthcare, schooling and pensions, and a property-market correction that has eroded the wealth of homeowners, who make up more than 90% of Chinese households.
Why Is China’s Domestic Demand Still Weak?
China’s domestic demand stays weak because three forces compound: a property slump that erased household wealth, thin social safety nets that force precautionary saving, and a hukou system denying migrant workers full urban benefits. Subsidies lift spending briefly, but they don’t fix why households save first.
The mechanics matter. The IMF researchers find that falling housing wealth pushes homeowners to save more, not less, as they try to rebuild lost equity — an effect that has held steady since the property correction began in 2021. More than 50 Chinese developers have defaulted since then; Country Garden, once the country’s largest, saw contracted sales fall by 70% to 6.91 billion yuan in a single December after an October debt default. What’s shifted is the other side of the ledger: would-be buyers, once forced to save aggressively for a down payment, are increasingly just postponing the purchase altogether amid uncertainty over future prices — which means the old “save to buy” motive is weakening even as the “save because I lost equity” motive intensifies.
Hukou reform has made real, if uneven, progress. Beijing has eased registration restrictions in dozens of cities since 2024, and the National Development and Reform Commission has continued chipping away at residency limits in smaller cities. But the IMF’s modelling suggests reform alone won’t be enough. Pair stronger social safety nets with hukou liberalisation and a smoother property-market transition, the paper argues, and Beijing could meaningfully cut precautionary saving. Pursue trade-in subsidies in isolation, and the savings rate barely moves — which is more or less what’s happened since 2024.
The Second-Order Costs of a Spending Gap That Won’t Close
The consequences extend well past China’s borders. With factory-gate prices still falling, manufacturers facing weak domestic orders are doing what they’ve always done: exporting the surplus. That’s part of why passenger-car exports surged even as domestic auto sales fell, and a similar pattern is playing out across solar panels, batteries and steel. Trading partners in Europe and Southeast Asia have noticed, and China’s trillion-dollar annual trade surplus keeps surfacing as a flashpoint in talks with Washington and Brussels alike.
Inside China, the strain shows up in local-government finances and in investment data that are now flashing red alongside consumption. Fixed-asset investment fell 4.1% in the first five months of 2026, and property investment extended its slide, dropping 16.2% over the same period — a sharper fall than January-April’s 13.7% decline, Reuters reported. NBS spokesperson Fu Linghui attributed part of the slowdown to extreme summer heat and heavy rain in some regions, along with the broader transition from old growth drivers to new ones. Land-lease revenue, once a primary funding source for cities, kept contracting through 2025, and the World Bank found consolidated fiscal revenue growth barely turned positive — just 0.2% year-on-year through October. That squeezes precisely the public services, healthcare, pensions, childcare subsidies, that economists say would do the most to unlock household spending in the first place.
Underneath the headline weakness, consumer behaviour is shifting in ways the subsidy programs weren’t built to capture. Chinese travellers are spending less overseas and more at home — a swing Bloomberg Intelligence estimates could redirect roughly $27 billion in outbound tourism spending back into the domestic market, while relaxed visa rules and a softer yuan are expected to draw in an additional $15 billion from inbound visitors. That’s a genuine bright spot, but it’s also a reminder of what’s actually growing: travel and experiences, not the durable-goods spending the trade-in subsidies were built to support.
Then there’s demography, which makes the 2026–2030 window unusually urgent. China’s population could shrink by close to 60 million people between 2026 and 2035, according to projections from the China-focused research firm Rhodium Group, as annual deaths climb toward 15 million a year while births keep falling — the ratio of new births to total population dropped to just 0.563% in 2025, down from 1.199% a decade earlier. Beijing’s 15th Five-Year Plan includes, for the first time, an entire chapter devoted to population policy. The retirement-age increase passed in 2024, to 63 for men and 58 for white-collar women, is expected to add roughly 0.2 percentage points to annual growth through 2030, the IMF estimates, but it does nothing to fix the underlying birth-rate collapse. For small and mid-sized exporters squeezed between soft domestic orders and rising trade friction, the math keeps getting harder, not easier.
Not Everyone Thinks the Strategy Is Failing
Not every economist reads the data this way. Standard Chartered’s Liao Wei points to China’s rising total factor productivity, climbing since 2021, as evidence the export engine can keep absorbing domestic slack without derailing growth, particularly as global appetite for AI-related hardware lifts demand for technology-intensive Chinese exports, she told China Daily. Tao Chuan, chief economist at Guolian Minsheng Securities, goes further, forecasting 2026 growth “no lower than 5%” and describing a shift toward what he calls an export-consumption equilibrium, in which subsidy-driven spending gradually gives way to sustainable services growth.
Beijing’s own assessment, delivered through the Central Economic Work Conference and echoed in Caixin’s opinion pages, holds that the economy’s fundamental trend remains positive and that 2025’s growth, officially 5%, in line with target, proves the model is working, just more slowly than critics would like.
That said, the gap between official confidence and independent estimates is wide enough to give pause. Rhodium Group’s analysts calculate that China’s real 2025 GDP growth likely landed between 2.5% and 3%, roughly half the 5.2% pace the National Bureau of Statistics reported through the first three quarters, with the biggest divergence concentrated in investment figures rather than consumption. If that estimate is closer to the mark, the resilience Beijing points to owes more to production and exports than to any genuine pickup in household spending. The picture is more complicated than either side’s headline number suggests.
A Pivot Beijing Can Postpone But Not Avoid
Strip away the subsidy cycles and the trade data, and the tension is simple: Xi Jinping wants Chinese households to spend like an advanced economy’s consumers while the state still taxes, spends and insures like a developing one. Trade-in vouchers can pull a few months of auto and appliance sales forward. They can’t replace a pension system, fix a broken property market, or convince a young professional in Chengdu that her job is secure enough to stop saving for the worst. The IMF’s own modelling suggests a serious reform package, stronger safety nets, faster hukou liberalisation, a real housing-market transition, could lift consumption’s share of GDP by roughly four percentage points over five years. That’s the size of the prize. It’s also the size of the political and fiscal commitment Beijing has so far avoided making. Until that changes, the trade-in subsidies will keep buying time rather than buying confidence, and the gap between Xi’s ambition and his households’ bank balances will keep showing up in the data, one weak month at a time.
Discover more from The Economy
Subscribe to get the latest posts sent to your email.



Key Takeaways
- Rolex’s secondary market rose approximately 7.9% year-over-year as of 2026 (per WatchCharts data) — trailing Patek Philippe (+16.2%) and Tudor (+11.4%) but still outperforming Audemars Piguet (+3.4%).
- Rolex raised U.S. retail prices 4–9% in January 2026 (steel models ~5.6%, gold models ~8.7%), narrowing the historical gap between retail and pre-owned pricing.
- Not every model appreciates: steel sports references (Submariner, GMT-Master II, Daytona) have held value far better than two-tone or widely available dress references like the standard Datejust.
- The Lady-Datejust posted the sharpest 2026 gain among tracked collections — up 22.73%, from roughly $9,269 to $11,376 — driven by demand for smaller, “everyday luxury” watches.
- Gold’s rise past $2,400/oz has directly lifted the investment case for Rolex’s precious-metal references (Day-Date, Sky-Dweller, Yacht-Master).
The Model-by-Model Picture
| Category | 2026 Trend |
|---|---|
| Lady-Datejust | +22.73% (strongest performer among tracked collections) |
| Steel sports models (Submariner, GMT-Master II) | Held value well; corrected from 2022 peak but stabilized above retail |
| Daytona | Corrected from highs above $50,000 to the mid-$30,000s; still among the most sought-after references |
| Two-tone/widely available Datejust | Flat to negative — “holds value” is an overstatement for this category |
| Gold references (Day-Date, Sky-Dweller) | Lifted by gold’s rise above $2,400/oz |
Why the “Rolex Always Appreciates” Myth Is Fading
The pandemic-era boom pushed some references — the Daytona above all — to speculative highs disconnected from historical norms. Since the March 2022 peak, steel sports models have compressed meaningfully, and dealers who bought inventory near the top have in some cases faced 20–40% markdowns on liquidation. The lesson for 2026 buyers: Rolex as a category is not a monolith. Value retention depends heavily on specific reference, condition, and whether the piece comes with box and papers (“full set”).
What’s Actually Driving 2026 Strength
- Retail price increases raise the floor. When a new Submariner retails at $10,050 (up from $9,500), a pre-owned example at $11,000–$12,000 suddenly represents a smaller premium — narrowing the gap without secondary prices actually moving.
- Supply discipline remains Rolex’s core lever. The brand has never confirmed production numbers, and secondary-market premiums remain entirely a function of Rolex’s own manufacturing decisions — a risk factor as much as a support.
- Certified Pre-Owned rollout. Rolex’s now fully rolled-out CPO program has changed how buyers transact in the used market, adding a layer of brand-verified legitimacy that supports pricing.
The Case for Rolex as a Portfolio Diversifier
Financial advisors increasingly frame luxury watches not as a replacement for equities or bonds, but as a tangible, historically low-correlation diversifier — one that carries its own risks (illiquidity, condition-dependent pricing, no yield) but has demonstrated multi-decade resilience for specific references.
Is Rolex a good investment in 2026?
It depends heavily on the specific reference. Steel sports models like the Submariner and Daytona have held or grown in value; two-tone and widely available dress models generally have not. Overall, Rolex’s secondary market rose about 7.9% year-over-year in 2026, trailing Patek Philippe but ahead of Audemars Piguet.
Discover more from The Economy
Subscribe to get the latest posts sent to your email.

Navigating Mortgage and Loan Refinancing in a High-Yield Environment
Global public debt crossing critical thresholds has kept central bank policies volatile, resulting in fluctuating US Treasury yields throughout 2026. For homeowners and commercial property holders burdened by previous high-interest borrowing cycles, finding optimal refinance windows has become a high-stakes financial puzzle. Stalled disinflation and stubborn employment numbers mean rate cuts are incremental, requiring borrowers to act with precision.
Timing your mortgage or commercial loan refinance in this environment requires a deep understanding of yield curve movements and lender risk appetites.
Decoding 2026 Refinance Dynamics
The 10-Year Treasury Yield Benchmark
Mortgage rates continue to track closely with the 10-year US Treasury yield. When macroeconomic anxiety spikes debt issuance, yields rise, tightening consumer borrowing capacity. Savvy borrowers monitor weekly Treasury auctions to lock in rates during brief dip windows.
Hybrid ARMs and Alternative Structures
With fixed rates remaining elevated, 7/1 and 10/1 adjustable-rate mortgages (ARMs) have surged in popularity. These products offer lower initial monthly payments, giving borrowers breathing room until central bank easing cycles fully materialize.
| Loan Product | Current Rate Range | Best For | Key Risk Factor |
| 30-Year Fixed Mortgage | 6.2% – 6.8% | Long-term predictability | Higher initial monthly outlay |
| 7/1 Hybrid ARM | 5.5% – 5.9% | Short-term ownership / flipping | Rate reset risk after year 7 |
| Commercial Refinance | 7.0% – 8.2% | Corporate asset restructuring | Strict DSCR lender covenants |
Actionable Steps for Successful Refinancing
To maximize your chances of securing favorable refinance terms in a volatile market, follow a disciplined preparation strategy.
Boost Your Credit Score Immediately: Lenders in 2026 are applying stringent credit tiering; a 20-point increase can drop your APR by a crucial quarter-point.
Shop Regional Credit Unions: Smaller financial institutions often offer portfolio loans with more flexible underwriting than major national banks.
Calculate the Break-Even Point: Ensure your total closing costs are recouped through monthly savings within 24 months of closing.
“Market Strategist View: Refinancing in 2026 is an exercise in opportunistic timing. Borrowers must maintain immaculate financial profiles ready to strike the moment Treasury yields dip.”
Mastering the complexities of today’s debt environment ensures you can successfully lower your debt service costs and protect your long-term financial stability.
Discover more from The Economy
Subscribe to get the latest posts sent to your email.

The days of pulling generic auto insurance quotes based purely on your zip code and age are officially over. In 2026, insurance comparison engines are powered entirely by generative AI and real-time telematics. These platforms digest thousands of live data points—ranging from your driving smoothness via connected vehicle sensors to real-time traffic congestion patterns—to generate hyper-personalized premiums instantly.
For consumers, this evolution represents both a massive opportunity for savings and a hidden trap for penalty pricing. Understanding how AI algorithms evaluate risk is essential for anyone looking to lower their monthly auto insurance premiums.
How AI Comparison Engines Evaluate Your Risk Profile
Behavioral Telematics and Connected Cars
Modern cars stream performance data directly to insurance aggregators. Generative AI models analyze braking sharpness, acceleration curves, cornering G-forces, and phone distraction metrics. Drivers who maintain smooth, defensive habits are rewarded with dynamic rate cuts of up to 40% compared to traditional rating tiers.
Predictive Traffic and Weather Modeling
AI tools now cross-reference your daily commute route with predictive weather and accident probability models. If your standard parking location or driving corridor has a statistically higher incidence of uninsured motorist claims, your quotes will reflect that hyper-local risk assessment.
| Comparison Factor | Traditional Rating Model | 2026 Generative AI Model | Impact on Premium |
| Mileage & Usage | Annual estimated odometer reading | GPS tracking & live trip duration | High (up to 35% savings) |
| Driving Behavior | MVR driving record & accidents | Real-time braking, speed, & G-force | Critical (determines tier) |
| Vehicle Tech | Make, model, and safety rating | ADAS calibration & repair cost data | Moderate |
Strategies to Lower Your AI-Driven Insurance Quote
To outsmart the algorithm and secure the lowest possible premium in 2026, drivers must proactively manage their digital footprint on insurance platforms.
Opt-In for Telematics Trial Periods: Many insurers offer immediate 15% discounts just for installing their driving app; let it track safe habits for 30 days to lock in permanent savings.
Scrub Unverified Public Records: Ensure your motor vehicle report is free of clerical errors that AI risk models misinterpret as reckless behavior.
Compare AI Aggregators: Use platforms that integrate multi-carrier API feeds rather than single-brand comparison sites to find the best risk-adjusted rate.
“Industry Note: AI-driven pricing rewards transparency and precision. Drivers who actively manage their telematics data consistently out-save those relying on legacy quote calculators.”
Embracing AI comparison tools allows savvy policyholders to customize coverage limits precisely to their driving habits, eliminating wasted premium spend while ensuring robust protection.
Discover more from The Economy
Subscribe to get the latest posts sent to your email.

VIX Index Explained: How to Trade Wall Street’s Fear Gauge Today

Commercial vs Residential Real Estate: Which Wins in 2026?

Presidential Stock Market Performance: How Trump’s Second Term Compares to History

2026 Real Estate Market News: Are We Heading for a Correction?

Bitcoin Price Forecast 2026–2027: Will the 4-Year Cycle Hold?

Fidelity Crypto vs. Traditional Brokerages: A Guide for Modern Investors

The 2026 Global Smartphone Market: AI Integration and Competitor Analysis

SpaceX IPO: How Aerospace Is Reshaping Tech Startup News

Fidelity Investments Review: Maximizing Returns in a Volatile Stock Market

How Crypto Transformed the Trump Fortune: A $1.4 Billion Financial Breakdown

Global Pension Systems Ranked: The World’s Best and Worst Retirement Frameworks

Global Supply Chain Vulnerabilities: From Eurasian Trade Corridors to Food Consumer Recalls

Why 5% U.S. Treasury Yields Signal a Global Market Regime Shift.

Federal Reserve Defies White House Pressure: Inside Trump’s Demand for Sub-1% Interest Rates After Historic 2026 Rate Hike

US-China Relations in Q3 2026: Trade Tariffs and Supply Chain Risks

Top 30 Stocks for Investment in PSX for Massive ROI in 2026

SpaceX Starship Flight 14: First Orbital Attempt & Starlink V3 Launch Explained

The 2026 Crypto Regulatory Shift: What It Means for Institutional Investors

AI Chip Stocks 2026: The Best Semiconductor Investments Beyond Marvell

Tween Back-to-School Trends 2026: What’s Driving the $85B Season

AI-Powered Training: The Next Multi-Billion Dollar Ecosystem in Fitness

Oil Prices Break $100 in 2026: Middle East Conflict & Energy Markets

10-Year Treasury Yield Hits 4.80%: What It Means for Rates & Portfolios

Fidelity Investments Review 2026: SPAXX Yields & Zero-Fee Funds

BRICS+ Cross-Border Payments 2026: Interoperability Explained

Shein Clothes Quality & Safety in 2026: What Lab Tests Show

MRVL Earnings 2026: Why Marvell Sank Despite Beating Estimates

China’s US$10.8 Billion Trade Shortcut: Why the Pinglu Canal Matters
-

 Markets & Finance9 months ago
Top 15 Stocks for Investment in 2026 in PSX: Your Complete Guide to Pakistan’s Best Investment Opportunities
-

 Analysis7 months ago
Johor’s Investment Boom: The Hidden Costs Behind Malaysia’s Most Ambitious Economic Surge
-

 Analysis7 months ago
Top 10 Stocks for Investment in PSX for Quick Returns in 2026
-

 Analysis8 months ago
Brazil’s Rare Earth Race: US, EU, and China Compete for Critical Minerals as Tensions Rise
-

 Banks8 months ago
Best Investments in Pakistan 2026: Top 10 Low-Price Shares and Long-Term Picks for the PSX
-

 Investment8 months ago
Top 10 Mutual Fund Managers in Pakistan for Investment in 2026: A Comprehensive Guide for Optimal Returns
-

 Global Economy9 months ago
15 Most Lucrative Sectors for Investment in Pakistan: A 2025 Data-Driven Analysis
-

 Global Economy9 months ago
Pakistan’s Export Goldmine: 10 Game-Changing Markets Where Pakistani Businesses Are Winning Big in 2025