
Markets & Finance
Gold Price 2026: J.P. Morgan Forecasts $6,000/oz as Inflation, Iran War

After surging 64% in 2025, gold has broken above $5,000/oz in 2026. J.P. Morgan targets $6,000 by year-end. Here’s why structural forces — not just crisis hedging — are driving the rally.Gold’s 2025 rally was remarkable. What has happened since is harder to categorise with traditional tools.
After surging roughly 64% in calendar year 2025 — one of the strongest annual performances in the metal’s modern trading history — gold entered 2026 at record highs above $5,100 per ounce. It reached an intraday peak of $5,595 on January 29 before pulling back, and has since been trading in a range that tests the patience of investors accustomed to its traditional role as a passive crisis hedge.
What is different in 2026 is that gold’s role has expanded. It is no longer merely a fear trade. It is increasingly a structural reserve asset, held deliberately by central banks, sovereign wealth funds, and institutional investors as a hedge against monetary system fragility rather than individual geopolitical shocks.
J.P. Morgan’s $6,000 Call
J.P. Morgan’s Global Research team has set a fourth-quarter 2026 average price target of $6,000 per ounce, with $6,300 per ounce possible by end-2027. The thesis rests on three pillars: sustained central bank accumulation, renewed Western ETF inflows, and the inflationary pressure generated by the US-Iran conflict, which is driving energy prices and complicating the Federal Reserve’s rate path.
Greg Shearer, head of base and precious metals at J.P. Morgan, acknowledges the near-term complication: “Gold is stuck in a bit of a technical no-man’s land, trudging above the 200-day moving average around $4,340/oz and capped for now below the 50-day moving average at $4,730/oz.” The hawkish surprise from Kevin Warsh’s Federal Reserve debut — with nine officials signalling potential rate hikes — created a headwind. Gold fell more than 2% on the day of the June 17 FOMC decision, as the dollar strengthened and real rate expectations shifted.
The bearish scenario, Shearer noted, would involve a macro environment where US growth and employment remain buoyant while inflation continues to accelerate, “solidifying a Fed hiking cycle this year.” A determined hiking cycle would likely trigger Western ETF outflows — one of the primary channels through which financial demand has been flowing into gold — and could put sustained pressure on prices. He characterised this as “a high bar.”
The Structural Drivers That Do Not Reverse Easily
VanEck’s analysis identifies five structural forces that are unlikely to reverse in 2026 regardless of near-term volatility. First: the global debt debasement trade. Global sectoral debt reached $340 trillion in mid-2025, with governments accounting for a record 30% share. At three to four times global GDP, sovereign debt levels make gold increasingly attractive as a hedge against currency debasement — a dynamic that is currency-agnostic and therefore persistent.
Second: elevated stock-bond correlations. The post-pandemic inflation spike pushed US stock-bond correlations to 30-year highs. While they have moderated, the breakdown of the traditional 60/40 portfolio hedge function has structurally increased gold’s diversification value for institutional investors.
Third: central bank demand. Emerging market central banks — led by China, India, and several Gulf sovereign wealth funds — have been net buyers of gold continuously since 2022. China launched a pilot programme in early 2025 allowing 10 insurers to allocate up to 1% of their assets to gold, and has separately positioned itself as a potential custodian for foreign sovereign gold reserves — a move designed to accelerate de-dollarisation.
In India, gold ETF assets under management have reached $10.9 billion — up 15.5 times since 2020, outpacing global AUM growth as rising incomes and inflation hedging drive retail demand alongside longstanding cultural preferences.
Gold as Recession Insurance
Historical data reinforces gold’s performance during economic contractions. During the 2008 global financial crisis, equities suffered severe losses while gold prices rose as investors sought protection from financial instability. During the 2020 pandemic-driven recession, gold surged to record levels before monetary stimulus eventually shifted the allocation calculus. The pattern is consistent: when confidence in financial systems weakens, demand for physical gold increases.
The current environment carries characteristics of both the inflationary 1970s and the institutional stress of 2008. The Iran war is driving energy prices higher, complicating monetary policy. The debt overhang in advanced economies is structurally inflationary. And the AI investment cycle — while deflationary in its eventual productivity effects — is generating massive near-term debt issuance that increases systemic financial risk.
CBS News noted the complexity in 2026: gold does not necessarily rise in a straight line with inflation because rising rates increase the opportunity cost of holding a non-yielding asset. The relationship between gold and inflation is real but non-linear — and the current environment, where energy-driven inflation is pushing toward rate hikes rather than rate cuts, tests the standard model.
The De-Dollarisation Premium
One dimension of gold’s 2026 story that receives less coverage than it deserves is its role in the global monetary transition. The World Gold Council attributes roughly 8–12% of gold’s 2025 return to geopolitical risk and de-dollarisation allocations — not crisis hedging in the traditional sense, but deliberate strategic diversification by central banks and sovereign institutions seeking to reduce dependence on US dollar-denominated reserves.
VanEck‘s emerging markets bond team calculated a theoretical gold price that would be required if the dollar lost reserve currency status: approximately $39,000 per ounce under central bank M0 frameworks, and $184,000 under M2. These figures are scenario analysis, not forecasts — but they illustrate the optionality that gold provides to investors concerned about long-run dollar hegemony.
Discover more from The Economy
Subscribe to get the latest posts sent to your email.


The Dual-Demand Trap
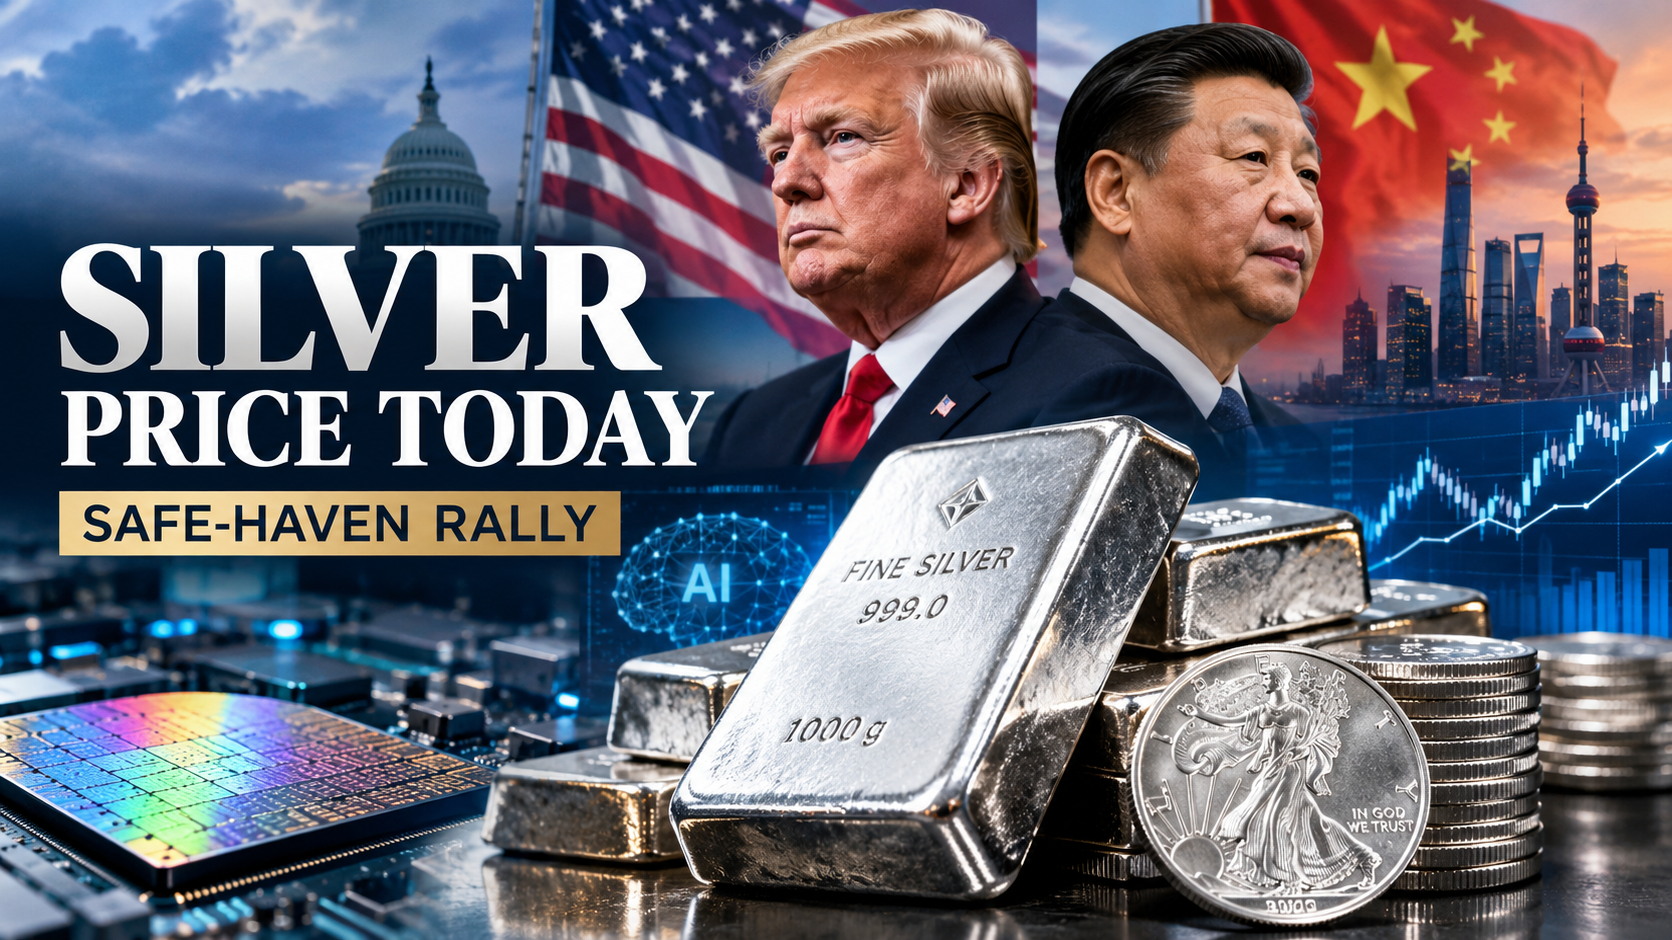
Silver’s 2026 surge into the $60s per ounce isn’t just a pure industrial-demand story, nor is it a pure safe-haven play. It is a potent combination of both. The unresolved AI and technology export-control dispute stemming from the late-September Xi-Trump summit in Washington is the rare market catalyst touching both sides of the equation simultaneously.
Silver Price Today: Where the Market Stands in Late September
Silver has spent the latter half of September 2026 consolidating in the low-to-mid $60s per ounce after a highly volatile summer. Following the September 16 Federal Reserve rate hike and the subsequent hawkish repricing of October rate odds, silver tested its 50-day moving average near $63.45 but demonstrated remarkable resilience.
This pricing establishes silver in a territory that analysts once treated as a distant, multi-year target. However, the wide spread between institutional bank forecasts reveals an unusually contested market, reflecting genuine disagreement on how much geopolitical risk and supply deficit is already priced in.
| Metric / Institution | Reading / Target (September 2026) |
| Spot Silver (XAG/USD) | ~$61–$67/oz trading range |
| J.P. Morgan (Q4 2026 Average) | $63.00/oz |
| Bank of America (2026 Peak) | $65.00/oz |
| HSBC (Year-End 2026 Target) | $70.00/oz |
| LBMA Analyst Panel (2026 Average) | $80.36/oz |
The AI and Export-Control Connection
Silver is a critical industrial input for electronics, solar panels, and the specialized, power-dense hardware behind AI data centers. This dual monetary-industrial identity is exactly why the ongoing technology dispute between the US and China matters so directly to silver pricing.
During the September White House summit, AI development and technology export controls were explicitly on the agenda alongside trade and Iran. However, core disagreements over AI safeguards, chip restrictions, and critical minerals remain deeply entrenched.
This combination of unresolved trade risk and tech-export tension hits silver from two directions at once:
- The Safe-Haven Squeeze: Geopolitical uncertainty pulls investment capital toward precious metals as a traditional hedge.
- The Industrial Supply Shock: Supply chains for electronics face potential disruptions if rare-earth or tech-export controls tighten, putting a premium on physical silver delivery.
Why AI Data Centers Are a Game-Changer for Silver
Most commodity coverage treats silver merely as “gold’s volatile cousin.” That framing entirely misses silver’s unique exposure to the AI buildout.
Silver is the most conductive metal on earth. As global AI infrastructure spending accelerates, the demand for silver in high-end semiconductor packaging, electrical contacts, switches, and the massive power grid upgrades required to cool and run these data centers rises structurally. Layer an unresolved US-China tech-export dispute on top of that structural AI demand, and you get a metal where bad diplomatic news and strong industrial fundamentals push the price in the exact same direction. Models built on gold’s pure monetary logic simply fail to capture this AI-driven industrial sensitivity.
The Regional Angle: Asian Demand Anchors the Floor
Asia is simultaneously the largest physical silver consumer—driven by India’s massive jewelry/investment imports and China’s undisputed dominance in solar panel manufacturing—and the region most directly affected by the trade dispute. Even with elevated energy prices, regional industrial demand for silver in electronics and solar manufacturing remains structurally firm. If the geopolitical premium eventually fades, this baseline physical demand prevents a total price collapse.
Q4 2026 Predictive Outlook
- Base Case ($62–$65/oz): Silver consolidates in this mid-$60s band through year-end. The market successfully balances physical supply tightness against the headwinds of a hawkish Federal Reserve.
- Bull Case ($70–$80/oz): A total breakdown in US-China tech negotiations or a fresh geopolitical escalation triggers a dual safe-haven and supply-chain panic, pushing silver toward HSBC’s $70 target and the LBMA panel’s $80+ average.
- Bear Case ($55–$59/oz): A durable, surprise trade resolution regarding AI chips combined with an aggressively hawkish Fed pushes speculative money out of the market, causing a retreat toward Bank of America’s lower baseline averages.
FAQ
What is driving the silver price rally in 2026?
Silver’s 2026 rally is driven by a multi-year physical supply deficit, persistent inflation hedging, and unresolved US-China tech tensions from the September summit that simultaneously boost its safe-haven appeal and threaten electronic supply chains.
Why is silver reacting to AI news?
Silver is highly conductive and essential for electronics, semiconductor packaging, and the power infrastructure required for AI data centers. Trade disputes over advanced AI chips directly threaten these hardware supply chains, spiking industrial anxiety in the physical silver market.
Will silver keep rising in Q4 2026?
Bank forecasts are heavily divided. J.P. Morgan targets $63 for Q4, while HSBC projects $70 by year-end. The ultimate trajectory depends on whether AI-driven industrial demand outpaces the downward pressure of recent Federal Reserve rate hikes.
Discover more from The Economy
Subscribe to get the latest posts sent to your email.

Is SpaceX going public in 2026? SpaceX is actively preparing for a potential initial public offering targeted for mid-to-late 2026, with reported valuation estimates that have climbed dramatically over the course of the year — from around $800 billion in insider share-sale discussions in December 2025, to over $1 trillion by mid-2026, to Bloomberg reports of a $1.5 trillion target more recently, according to reporting compiled by Capital Brief. That trajectory represents an extraordinary escalation from SpaceX’s own late-2023 tender offer valuation of roughly $175 billion — nearly a tenfold increase in under three years.
If completed anywhere near the higher end of reported estimates, this would be the largest initial public offering in history, surpassing Saudi Arabia’s Aramco, which remains the only company ever to reach a trillion-dollar-plus IPO valuation, having listed at $1.7 trillion in 2019.
What’s Actually Confirmed, Versus Speculation
Featured Snippet Target: Elon Musk has effectively confirmed SpaceX is preparing for a 2026 IPO, responding “As usual, Eric is accurate” to a journalist’s analysis of why the company appears ready to go public — but Musk has separately and explicitly disputed specific valuation figures reported by Bloomberg and the Wall Street Journal, meaning the exact valuation, timing, and even whether the full company (versus just Starlink) will be listed all remain genuinely unconfirmed as of September 2026.
That distinction matters for anyone reading SpaceX IPO headlines this year: the company’s intent to go public appears real and has been acknowledged by Musk himself, but nearly every specific number attached to the deal — from the $800 billion figure to the more recent $1.5 trillion reports — has come from unnamed sources cited by financial media rather than official company disclosures, and Musk has pushed back on at least one of those figures directly.
Why SpaceX Is Considering Going Public Now
SpaceX board director Kimbal Musk’s associate and company leadership have framed the potential IPO around a specific financial threshold: Musk has previously stated Starlink specifically would go public once its revenue growth became steady and predictable — a milestone the company appears to have now reached. SpaceX’s overall revenue is projected to reach roughly $15 billion in 2025, climbing to an estimated $22-24 billion in 2026, with Starlink as the primary revenue driver, according to reporting from IDN Financials.
SpaceX’s own internal communications have framed the potential listing explicitly around funding needs rather than simply providing liquidity to existing shareholders. In a December 2025 letter to shareholders, SpaceX indicated plans to channel IPO proceeds toward accelerating the Starship rocket program’s launch cadence, establishing AI-powered data centers in orbit, developing a “Moonbase Alpha” concept, and supporting both robotic and eventual human missions to Mars, according to Outlook Business. That’s a notably broader capital-allocation vision than a typical IPO prospectus, reflecting SpaceX’s unusual position as simultaneously a commercial launch provider, a satellite internet company, and an increasingly central node in U.S. space and defense strategy.
Listing the Whole Company, Not Just Starlink
An important shift in SpaceX’s IPO planning during 2026 has been the move away from spinning off Starlink as a standalone public entity — long considered the most likely path to a public listing — toward preparing to list SpaceX’s core business in its entirety. According to DriveTeslaCanada’s reporting on Bloomberg’s coverage, that shift would bring the full SpaceX operation — rockets, Starlink satellites, a growing defense contracting business, and various off-world infrastructure projects — into a single public entity, rather than carving out only the more straightforwardly valued satellite-internet business.
That distinction matters enormously for how the eventual IPO gets valued. Starlink alone, as a subscription satellite-internet business, would be comparatively simple for public-market analysts to model against comparable telecom and satellite companies. The full SpaceX entity — encompassing an active national-security launch provider handling more than 80% of global payload weight, according to analysis from QZ, alongside a rapidly scaling satellite business and speculative future ventures like orbital data centers and lunar infrastructure — is a fundamentally harder company for public markets to price cleanly.
The Comparison That Keeps Coming Up
Every report on SpaceX’s potential IPO valuation inevitably returns to the same comparison: Saudi Aramco’s 2019 listing, which raised approximately $29 billion at a $1.7 trillion valuation and remains the only trillion-dollar-plus IPO in history. If SpaceX executes even the lower end of its reported fundraising targets — $25-30 billion raised — it would still exceed Aramco’s raise amount while potentially matching or exceeding Aramco’s valuation, depending on which of the widely varying reported figures ultimately proves accurate. Some reports suggest SpaceX could reach a valuation “in the same valuation airspace as Meta or Amazon” — a scale of comparison that, regardless of the exact final number, places SpaceX’s potential public debut among a small handful of the most consequential stock-market listings in history.
The Bottom Line
SpaceX’s 2026 IPO remains genuinely in-progress rather than finalized: Musk has acknowledged the company is preparing for a public listing, but the specific valuation (reported anywhere from $800 billion to $1.5 trillion), timing (mid-to-late 2026, with some reports suggesting a possible slip into 2027), and structure (full company versus Starlink spinoff) all remain unconfirmed by the company itself. What is clear is that any completed listing at even the lower end of reported estimates would represent one of the most significant capital markets events in recent history, both for its sheer scale and for what it would signal about public investors’ appetite for space, satellite, and AI-infrastructure exposure in a single company.
Next step: Investors and space-industry watchers should treat specific SpaceX IPO valuation figures reported by any single outlet with real skepticism until the company files actual registration documents — the reported estimates have nearly doubled within a matter of months this year, and Musk himself has directly disputed at least one widely-cited figure.
Discover more from The Economy
Subscribe to get the latest posts sent to your email.
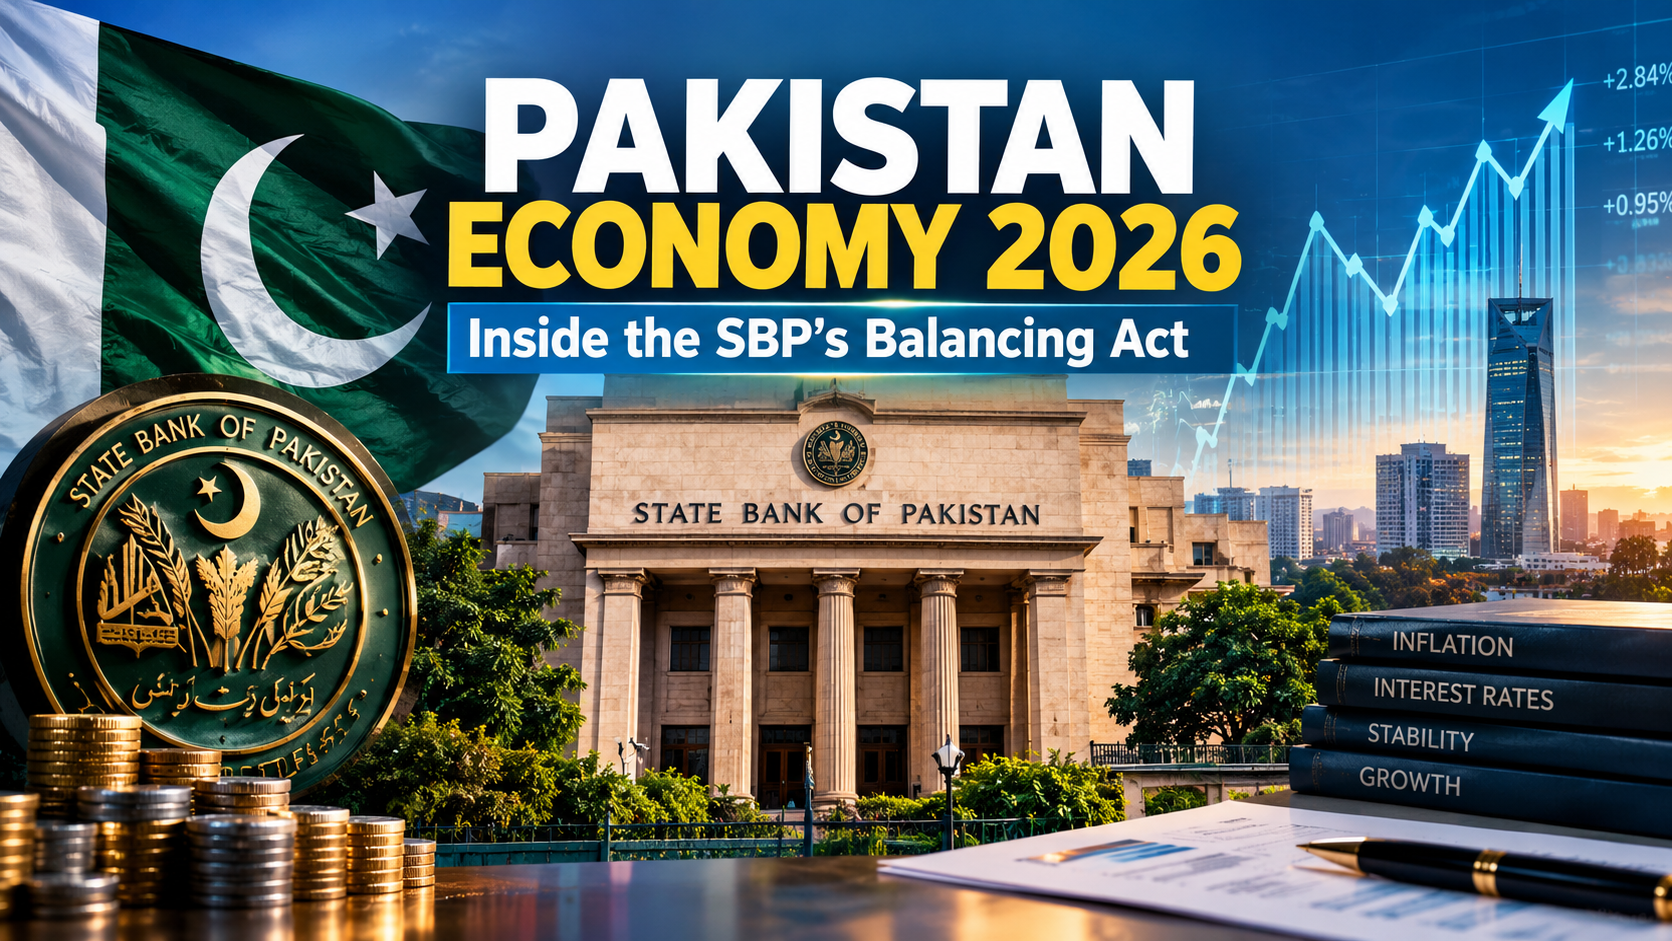
What is Pakistan’s central bank policy rate in 2026? The State Bank of Pakistan (SBP) held its policy rate unchanged at 11.5% at its September 14, 2026 meeting, according to the central bank’s official statement, even as headline inflation jumped to 11.1% year-on-year in August from 9.2% in July. The Monetary Policy Committee specifically cited the “recent intensification of the prolonged Middle East conflict” as having pushed already-elevated global commodity prices even higher, compounding persistent supply chain disruptions — a clear signal that Pakistan’s domestic inflation fight in 2026 has become inseparable from the global oil-price volatility tied to the Strait of Hormuz crisis.
That single decision captures the core tension defining Pakistan’s economy this year: a genuine, hard-won macroeconomic stabilization story running headlong into external shocks the country has no control over.
The Long Road From 22% to 11.5%
Featured Snippet Target: The State Bank of Pakistan has cut its policy rate by roughly 1,100 basis points since June 2024, when rates peaked at 22% amid inflation nearing 40% — one of the most aggressive monetary easing campaigns among emerging-market central banks in recent history — before pausing the cutting cycle in 2025 and holding steady through 2026 amid renewed inflation risk from Middle East-driven commodity price increases.
That easing campaign reflected a genuine turnaround in Pakistan’s inflation trajectory: from a peak above 38% in May 2023, inflation had fallen to single digits by late 2024, allowing the central bank room for aggressive cuts. But the pace of easing slowed and eventually paused as new pressures emerged — first flood-related agricultural disruptions in late 2025, and then, more significantly, the economic fallout from the Iran conflict that erupted in February 2026.
The Pause, Meeting by Meeting
The SBP’s rate path through 2026 has been a study in caution rather than continued easing. The central bank held rates steady at 11% in October 2025 for a fourth consecutive meeting, citing modest economic growth alongside external-sector vulnerabilities and inflation risks, with foreign exchange reserves projected to reach $15.5 billion by December 2025 and around $17.8 billion by June 2026, according to reporting from Arab News. By April 2026, with Middle East tensions escalating and oil prices surging, the SBP raised its rate by 100 basis points to 11.50%, according to ARY News — reversing its prior easing bias entirely in direct response to the geopolitical shock. The rate has been held steady at that level through subsequent meetings in June, July, and September.
The Good News Buried in the September Statement
Despite the inflation jump, the SBP’s September policy statement contained several genuinely positive developments that complicate any purely negative reading of Pakistan’s 2026 economic trajectory. The central bank’s foreign exchange reserves surpassed the end-June 2026 target of $18 billion, driven by continued FX purchases amid a small current account deficit for the fiscal year and the realization of planned official inflows. Separately, Standard & Poor’s upgraded Pakistan’s sovereign credit rating to “B” during the year — a meaningful signal of improving international investor confidence in the country’s debt sustainability. Inflation expectations among both consumers and businesses had also eased in the latest sentiment surveys, according to the SBP’s own reporting, suggesting the current inflation spike is being read by markets as externally-driven rather than a sign of a fundamental loss of policy credibility.
Growth, Floods, and a Still-Live IMF Program
Pakistan’s real GDP growth for the fiscal year was revised upward into the upper half of a previously projected 3.25%-4.25% range as of late 2025, underpinned by robust performance in agriculture and industry alongside rising domestic demand, according to Trading Economics coverage of the central bank’s own projections. That growth trajectory has had to absorb genuine shocks: flood-related crop losses drove a temporary inflation spike to 5.6% in September 2025, and border closures with Afghanistan disrupted staple food supplies including tomatoes and apples. Pakistan’s stabilization program remains anchored by its ongoing International Monetary Fund arrangement, with fiscal consolidation and the realization of planned external inflows continuing to be treated by the SBP as prerequisites for durable macroeconomic stability, consistent with the terms of the country’s 37-month, roughly $7 billion IMF Extended Fund Facility.
The Real Asset Allocation Shift Feeding Pakistan’s Stock Rally
Pakistan’s improving macro picture — falling rates through 2024-2025, easing inflation, and rising foreign reserves — has had a direct and visible knock-on effect on domestic markets: a structural shift of household savings out of fixed-income instruments and into equities, as falling returns on traditional savings vehicles pushed investors toward the stock market, according to brokerage house Topline Securities’ analysis reported by Aaj News. That reallocation has been the primary fuel behind the KSE-100’s historic rally through 2026, even as the index has periodically corrected sharply on single-session sentiment shifts.
The Bottom Line
Pakistan’s 2026 economic story is genuinely two-sided: a real, credible stabilization achieved through 1,100 basis points of rate cuts, improving foreign reserves, a credit rating upgrade, and a domestic savings shift that has fueled one of the world’s best-performing stock markets — all now being tested by an externally-driven inflation shock tied to Middle East oil-price volatility that is entirely outside the State Bank’s control. The SBP’s response so far — holding rates steady rather than resuming cuts or panicking into further hikes — suggests the central bank is treating the current inflation spike as a temporary, externally-driven disruption rather than a sign that its underlying stabilization program has failed.
Next step: Businesses and investors tracking Pakistan’s economy should watch the SBP’s October 26, 2026 Monetary Policy Committee meeting closely — a continued hold would reinforce the “temporary external shock” reading, while any additional rate hike would signal the central bank sees the Middle East-driven inflation pressure as more durable than currently assessed.
Discover more from The Economy
Subscribe to get the latest posts sent to your email.

Silver Price Today: Why the Xi-Trump AI Standoff Is Fueling a Safe-Haven Rally

Citibank & Dólar Estadounidense: Forex Playbook After the Xi-Trump Truce

How the Trump-Xi White House Summit Is Reshaping Mortgage Rates Today for Real Estate Investors

Indonesia Navigates Mega-Project Risks as China and Russia Eye the 2,772km Trans-Kalimantan Railway

Trump-Xi 2026 Summit Takeaways: The Trade Truce, Taiwan, and the AI Divide

Solar Panel Installation Cost in 2026: Why the Math Changed Overnight

Business Insurance: What Coverage You Actually Need and What It Costs in 2026

Auto Insurance Quotes: How to Get the Lowest Rate Without Losing Coverage

Huntington Online Banking: Full Features, Fees, and How It Compares in 2026

Apply for a Bank Account Online: What You Need and How Long It Actually Takes

World’s Largest Economies: Ranking the Top Global Powers

Business Loan: A Complete 2026 Guide to Rates, Types, and Qualifying

Fast Invoice Factoring: How to Turn Unpaid Invoices Into Cash Within 24 Hours

Investment Banking Services: What They Cost and How to Choose the Right Firm in 2026

Top 30 Stocks for Investment in PSX for Massive ROI in 2026

SpaceX Starship Flight 14: First Orbital Attempt & Starlink V3 Launch Explained

Oil Prices Break $100 in 2026: Middle East Conflict & Energy Markets

BRICS+ Cross-Border Payments 2026: Interoperability Explained

AI Chip Stocks 2026: The Best Semiconductor Investments Beyond Marvell

Fidelity Investments Review 2026: SPAXX Yields & Zero-Fee Funds

Tween Back-to-School Trends 2026: What’s Driving the $85B Season

10-Year Treasury Yield Hits 4.80%: What It Means for Rates & Portfolios

Shein Clothes Quality & Safety in 2026: What Lab Tests Show

China’s US$10.8 Billion Trade Shortcut: Why the Pinglu Canal Matters

MRVL Earnings 2026: Why Marvell Sank Despite Beating Estimates

IMF & World Bank 2026 Global Economic Outlook: Growth, Inflation, Debt

High-CPM Finance Niches 2026: Publisher Monetization Blueprint

Middle East War Economics 2026: Oil Prices & Energy Markets
-

 Markets & Finance9 months ago
Top 15 Stocks for Investment in 2026 in PSX: Your Complete Guide to Pakistan’s Best Investment Opportunities
-

 Analysis7 months ago
Johor’s Investment Boom: The Hidden Costs Behind Malaysia’s Most Ambitious Economic Surge
-

 Analysis7 months ago
Top 10 Stocks for Investment in PSX for Quick Returns in 2026
-

 Banks8 months ago
Best Investments in Pakistan 2026: Top 10 Low-Price Shares and Long-Term Picks for the PSX
-

 Analysis8 months ago
Brazil’s Rare Earth Race: US, EU, and China Compete for Critical Minerals as Tensions Rise
-

 Investment9 months ago
Top 10 Mutual Fund Managers in Pakistan for Investment in 2026: A Comprehensive Guide for Optimal Returns
-

 Global Economy9 months ago
15 Most Lucrative Sectors for Investment in Pakistan: A 2025 Data-Driven Analysis
-

 Global Economy9 months ago
Pakistan’s Export Goldmine: 10 Game-Changing Markets Where Pakistani Businesses Are Winning Big in 2025