
Analysis
Speed and Savings: Why Singaporeans Are Parking Luxury Cars in Malaysia


A quiet automotive arbitrage is reshaping the weekend habits of Singapore’s affluent — and spawning an entirely new service economy across the Causeway.
On weekday mornings, Iylia Kwan looks like any other 36-year-old Singaporean navigating the commute from Yishun in a sensible Toyota Corolla Altis. But on Friday evenings, something shifts. He drives across the Woodlands Checkpoint, walks into a modern, air-conditioned facility in Skudai, and slides into the cream leather seat of a secondhand Porsche Cayenne — a 2009 model he bought for a price that would barely cover one month’s parking in Orchard Road: RM50,000, or roughly S$15,000. He recently added a Mercedes-Benz E-Class, personalised number plate included, as what he described to The Straits Times as “a fated birthday gift to himself.”
Kwan is not an outlier. He is a data point in a trend accelerating with the inexorability of a turbocharged flat-six on an open Malaysian highway.
Across Singapore, a growing cohort of car enthusiasts — ranging from engineers and entrepreneurs to finance professionals and serial hobbyists — have found an elegant loophole in one of the world’s most expensive automotive regimes: buy your dream car in Malaysia, store it just across the border, and drive it whenever you please on roads that don’t end at a customs checkpoint.
The economics are, frankly, staggering.
The COE Wall: Singapore’s Structural Barrier to Automotive Joy
To understand the Malaysian arbitrage, one must first appreciate the full, almost theatrical expensiveness of car ownership in Singapore. The Certificate of Entitlement (COE), administered by the Land Transport Authority, is a quota-based bidding system designed to control the number of vehicles on the island’s finite road network. It is, in essence, a government-issued permission slip to own a car — and it expires after ten years.
In the first bidding exercise of March 2026, Category B COEs — covering cars above 1,600cc or 97kW, the bracket that ensnares virtually every performance or luxury vehicle — closed at S$114,002, up nearly nine percent from the previous round. Category A, for smaller cars, sat at S$108,220. Category E, the open category used as a benchmark, cleared S$114,890.
To put those numbers in human terms: before a buyer in Singapore spends a single dollar on the car itself, they have already paid more than S$114,000 for the temporary right to own it. That right dissolves in a decade.
A new Porsche Macan — Porsche’s entry-level SUV — retails in Singapore at approximately S$430,000 with COE included. The same vehicle sits on showroom floors in Malaysia at RM433,154, or roughly S$130,000 at current exchange rates. A 2025 Porsche 911 starts at RM1.43 million in Malaysia — not inexpensive by any regional standard, but compared to the Singapore equivalent, where the same car commands upward of S$600,000 with COE, it represents a discount that approaches the philosophical.
The Toyota GR Yaris — the turbocharged hot hatch that has become the talisman of a generation of track-day enthusiasts — illustrates the gap with particular clarity. In Malaysia, the GR Yaris is available at around RM254,000 new, or under S$78,000. In Singapore, the same car requires a Category A COE of over S$108,000 on top of the base vehicle price, pushing the all-in cost above S$175,000. For buyers who want to drive hard on weekends without the anxiety of watching a six-figure certificate depreciate, Malaysia offers a rational alternative.
Comparative Price Snapshot (March 2026)
Model Malaysia Price (RM) ≈ SGD Equiv. Singapore Price (incl. COE) Savings Porsche Cayenne (used, 2009) RM 50,000 ~S$15,000 S$150,000–200,000 ~90% Porsche Macan (new) RM 433,000 ~S$130,000 ~S$430,000 ~70% Porsche 911 (base, new) RM 1,430,000 ~S$430,000 ~S$600,000+ ~25–30% Toyota GR Yaris (new) RM 254,000 ~S$77,000 ~S$175,000+ ~56% BMW 3 Series (new) RM 270,000 ~S$82,000 ~S$250,000+ ~67%
Exchange rate approximate at SGD 1 = MYR 3.30. All prices indicative; subject to optional extras, taxes, and market conditions.
An Inconvenient Legal Clarity
The arrangement is entirely legal — with one firm caveat. Under current regulations, Singapore’s Land Transport Authority prohibits citizens, permanent residents, and long-term pass holders from driving foreign-registered vehicles within Singapore. Malaysia’s Road Transport Department (JPJ) permits foreigners, including Singaporeans, to register vehicles under their own name as long as those vehicles remain in Malaysia. Registration requires a passport and thumbprint verification at any JPJ counter; for used vehicles, a mandatory roadworthiness inspection precedes the transfer of ownership.
The result is a legal structure that neatly bifurcates the automotive life of its participants: a practical, quotidian car for Singapore, and a fantasy machine for the weekend, stored and maintained across the Causeway.
“In Singapore, you don’t actually permanently own a car,” observed Heeraj Sharma, co-founder of Carlogy Malaysia, in an interview with Malay Mail. “All registered vehicles come with a COE that ends after the usual ten-year tenure expires. In Malaysia, registered cars offer owners permanent ownership of the vehicle — there’s no expiry date here.”
The Business of Cross-Border Motoring
Where demand concentrates, enterprise follows. The most visible new player in the cross-border automotive ecosystem is Carlogy Malaysia Sdn Bhd, a 24,000 square-foot vehicle storage and lifestyle hub established in Skudai, Johor Baru — positioned, with deliberate geographic logic, at the midpoint between the Woodlands Checkpoint and the Tuas Second Link.
Co-founded by Sharma and fellow Singaporean Regis Tia, Carlogy offers a service proposition that would feel at home in a premium Swiss watch vault: air-conditioned storage at RM1,000 per month, standard covered storage at RM700 monthly, 24/7 security, remote CCTV monitoring accessible from the owner’s phone, weekly engine warming to prevent battery degradation, monthly washes, detailing, paint protection film, performance tuning, and a concierge service to deliver vehicles within Johor Baru — all wrapped in an industrial-chic space adjacent to a specialty café that has become a weekend gathering point for the region’s car community.
By mid-2025, Carlogy had already accumulated over 80 clients, the majority of them Singaporean.
“We want to show our customers that car ownership, especially luxury and performance marques, can still be affordable,” Sharma told Malay Mail. The facility also offers sourcing concierge services — helping clients identify and acquire specific models including Porsche, BMW, and reconditioned sports cars through Malaysia’s well-established parallel import and used car ecosystem, where decades of collector activity have produced a depth of inventory unavailable in Singapore’s constricted market.
Carlogy is not alone in sensing the opportunity. Across Johor Baru, informal networks of condominium parking spaces — rented for RM200 to RM400 per month — have long served as the budget tier of this ecosystem. Friends’ driveways, trusted dealers with storage arrangements, and specialist workshops offering seasonal car-sitting packages have all responded to the same fundamental demand signal: Singaporeans who want to own cars they cannot, or simply will not, afford at home.
Three Archetypes of the Cross-Border Car Enthusiast
The phenomenon aggregates a surprisingly diverse range of motivations and life circumstances. Three broad archetypes capture most of the market.
The Weekend Track Devotee. Motoring enthusiasts like Kelvin Kok and Afeeq Anwar, cited in reporting by The Straits Times, use their Malaysian-registered vehicles primarily for motorsport events — track days at Sepang International Circuit, spirited runs along the coastal roads of Johor, hill climbs in the Cameron Highlands. For these buyers, the Malaysian car is a dedicated performance tool, never intended for the traffic-calmed streets of Singapore, and the COE arbitrage is simply a prerequisite for participation in the sport they love. Some within this community have maintained Malaysian performance cars for nearly two decades.
The Aspirational Collector. This archetype is less about performance than possession. The Singapore car market’s structural constraints — 10-year COE cycles, spiralling depreciation, scarcity of rare variants that bypassed parallel import channels — mean that certain models are simply unavailable or economically irrational to own locally. A low-mileage Japanese domestic market special, a lightly used European estate wagon from a pre-facelift generation, a specific AMG Black Series: these are cars that exist in Malaysian classifieds and don’t in Singapore’s, or exist at prices that make the math absurd. Collectors who would otherwise be priced out of their obsession find Malaysia a reasonable solution.
The Early-FIRE Professional. A third cohort consists of Singaporeans who have achieved financial independence relatively young, spend extended time working or living across the Causeway under arrangements enabled by the Johor-Singapore Special Economic Zone, and have effectively merged their automotive lives with their professional geography. For these individuals, the Malaysian car is not an exotic weekend indulgence but a sensible component of a life being lived partly outside Singapore’s cost architecture. Kwan himself exemplifies this: he rents a semi-detached house in Pasir Gudang, maintains a practical vehicle in Singapore for family obligations, and treats his Porsche and Mercedes as the natural perquisites of a bicultural lifestyle.
The Macroeconomic Tailwind: The JS-SEZ Factor
The timing of this automotive trend is not incidental to a much larger structural shift reshaping the southern Malaysian-Singaporean corridor. The Johor-Singapore Special Economic Zone (JS-SEZ), formally established on January 8, 2025, has catalysed what analysts describe as the most significant bilateral economic integration effort in the history of the two countries.
Spanning 3,288 square kilometres across nine flagship zones — roughly five times the landmass of Singapore — the JS-SEZ targets eleven priority sectors and has attracted staggering early investment momentum. Johor emerged as the top Malaysian state for approved investment in the first nine months of 2025, garnering RM91.1 billion, with the JS-SEZ accounting for 74.6 percent of that total at RM68 billion. Singapore was the largest investor at RM28.5 billion.
The Johor Bahru–Singapore Rapid Transit System (RTS) Link, slated to move 10,000 passengers per hour, is expected to commence commercial service in late 2026, cutting the crossing to a five-minute train journey and dramatically reducing friction for the growing number of Singaporeans maintaining professional and personal lives on both sides.
For the automotive arbitrage community, the JS-SEZ matters beyond symbolism. As more Singaporeans establish genuine residential or professional presences in Johor — whether through the zone’s favourable 15 percent knowledge-worker income tax rate, its accelerated manufacturing licences, or simply the widening availability of quality housing and infrastructure — the question of maintaining a performance car locally resolves itself without the need for weekend pilgrimages. The car doesn’t need to be a weekend hobby when the weekend and the workweek share the same geography.
Malaysia’s ringgit, meanwhile, has remained competitive against the Singapore dollar across the post-pandemic period, reinforcing the purchasing-power advantage that makes Malaysian car prices so compelling to Singapore-based buyers. A strengthening ringgit would erode the arbitrage; the current macroeconomic environment has, if anything, sustained it.
The Risks: What the Glossy Stories Leave Out
Platinum journalism requires honesty about the rough edges. The cross-border car ownership model carries genuine risks that deserve articulation beyond the weekend-drive romance.
Insurance complexity. Comprehensive insurance for a Malaysian-registered vehicle driven by a Singaporean resident demands careful navigation. Standard Malaysian motor policies may contain clauses that affect coverage when the named driver’s primary residence is across the border, or that create ambiguity in the event of an accident on Malaysian roads. Buyers are advised to work with insurance brokers familiar with cross-border ownership structures and to read policy wordings carefully — a recommendation that applies with special force for high-value exotics.
Maintenance and depreciation. Luxury and performance vehicles require regular use to maintain mechanical health. A Porsche 911 left dormant for two or three weeks in a humid climate risks battery discharge, tyre flat-spotting, brake disc corrosion, and deterioration of rubber seals. Facilities like Carlogy have emerged partly to address this reality, but owners who rely on informal storage arrangements bear full responsibility for maintaining vehicles that will decline faster than their Singapore counterparts might expect.
Regulatory uncertainty. Singapore’s rules on foreign-registered vehicle usage are clear and enforced. But both LTA’s and JPJ’s policies are subject to revision. A future regulatory change that restricted Singaporean ownership of Malaysian vehicles, or that tightened cross-border ownership documentation requirements, could strand a cohort of owners with illiquid assets. The model is built on regulatory arbitrage; regulatory convergence is its existential risk.
Resale liquidity. The Malaysian market for premium and exotic cars is thinner than Singapore’s was at comparable price points. Selling a high-value Malaysian-registered vehicle quickly and at fair value can be challenging, particularly for models that were imported through reconditioned channels and whose provenance documentation may be incomplete.
Looking Forward: A Market at Inflection
The businesses serving cross-border car enthusiasts are, for now, operating in a niche that the mainstream automotive and financial industries have not yet fully addressed. Car financing for Malaysian vehicles purchased by Singaporean buyers remains awkward; insurance products are underserved; and the secondary market infrastructure — valuations, certified inspections, warranty programmes — lags years behind Singapore’s mature ecosystem.
That gap represents opportunity. As the JS-SEZ deepens cross-border integration and the RTS Link reduces friction to the level of a short MRT ride, the number of Singaporeans with genuine dual-geography lives will grow. The automotive implications are significant: a Singaporean who spends three days a week in Johor Baru is not the same creature as one who crosses over on Sunday mornings for dim sum and a drive. The former has a car problem to solve. The latter has a lifestyle.
Carlogy’s founders are betting that their timing is right. “With the Johor-Singapore Special Economic Zone in the works,” reads their pitch to potential clients, “Carlogy’s timing is impeccable.”
The data does not obviously contradict them. When COE Category B premiums have spent the better part of two years oscillating between S$110,000 and S$141,000, and when a 2009 Porsche Cayenne can be purchased in Johor for the price of a Singapore kitchen renovation, the economics do a considerable amount of the marketing work on their own.
For a certain kind of Singaporean — success achieved, weekends reclaimed, the Causeway no longer a border but a commute — the arrangement offers something the COE system structurally cannot: a car you actually own. Permanently. In perpetuity. Without an expiry date, without a renewal auction, without the grinding arithmetic of depreciation accelerated by bureaucratic design.
There is, in that, a small and precise kind of freedom. And freedom, it turns out, smells remarkably like a Porsche flat-six warming up on a Saturday morning in Skudai.
Frequently Asked Questions
Can Singaporeans legally own cars in Malaysia? Yes. Under JPJ regulations, foreigners including Singaporeans may register and own Malaysian vehicles. The sole restriction is that such vehicles may not be driven into Singapore by Singapore citizens, permanent residents, or long-term pass holders under LTA rules.
How do Singaporeans register a car in Malaysia? Buyers visit any JPJ counter in Malaysia with their passport and complete a thumbprint verification. For used vehicles, a mandatory inspection (known locally as a “puspakom” check) must be completed before ownership is transferred.
What does car storage in Johor Baru cost? Rates vary by provider. Carlogy Malaysia charges RM700/month for standard covered storage and RM1,000/month for air-conditioned parking. Informal condominium parking spaces range from RM200–400/month.
Does the price advantage apply to new or used cars? Both, but the savings are proportionally larger for used vehicles. A secondhand 2009 Porsche Cayenne can be sourced in Malaysia for RM50,000–80,000; an equivalent vehicle in Singapore would carry COE costs alone exceeding S$100,000. For new cars, the gap is significant but narrower in percentage terms.
What are the main risks of cross-border car ownership? Insurance coverage complexity, mechanical maintenance requirements for infrequently driven luxury vehicles, regulatory risk from potential policy changes in either country, and reduced resale liquidity compared to the Singapore market.
How does the Johor-Singapore SEZ affect this trend? The JS-SEZ is deepening the economic integration of the corridor and encouraging more Singaporeans to live and work partly in Johor. As cross-border lives become more common, so does the logic of maintaining a vehicle on the Malaysian side. The RTS Link, expected to open in late 2026, will further reduce the friction of crossing.
Discover more from The Economy
Subscribe to get the latest posts sent to your email.


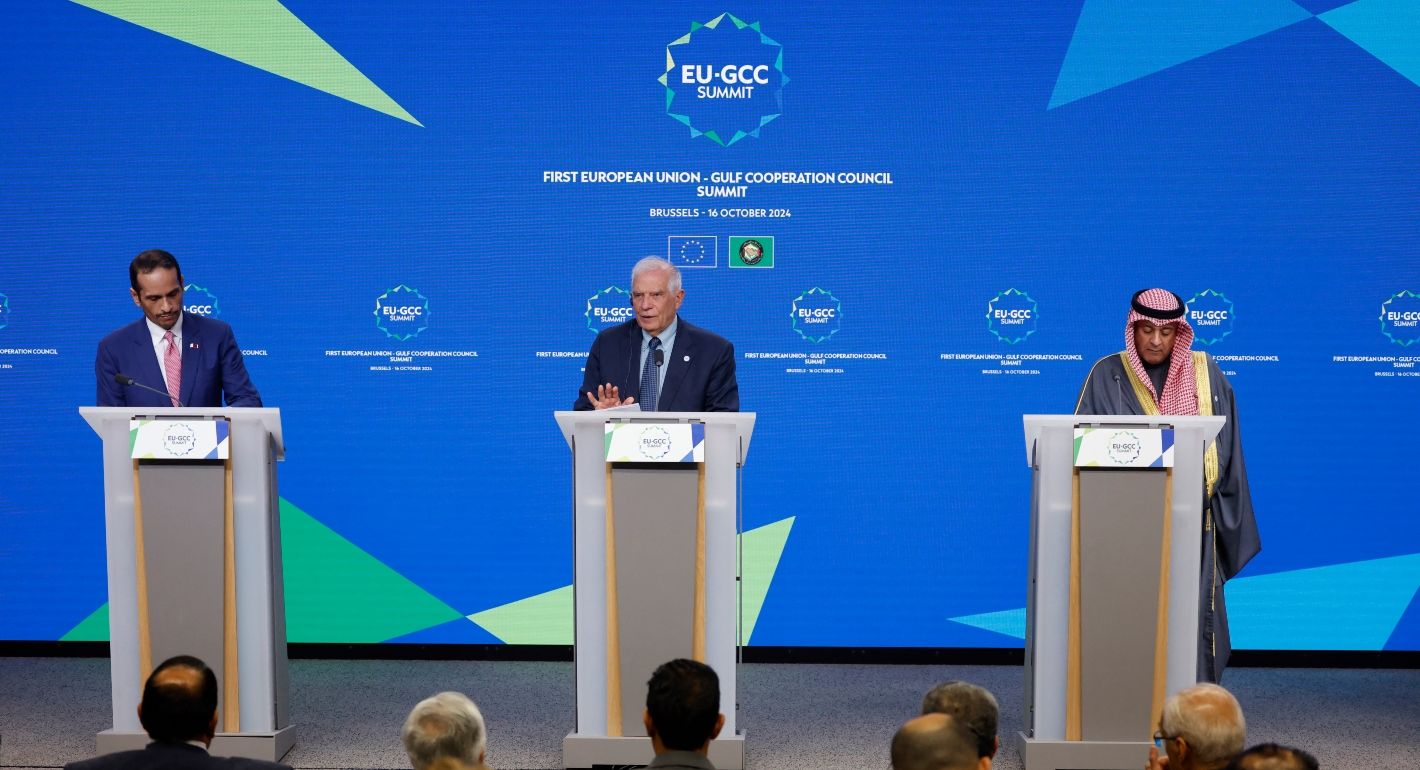
Gulf investors pulled over $1 billion from Pakistan’s bonds and equities in FY26. Here’s why the Gulf peace deal matters more than headlines suggest.
Pakistan’s economic commentary this year has largely stayed domestic — inflation, IMF reviews, remittances. The more revealing story sits in the balance-of-payments data: Gulf capital, historically one of Pakistan’s most reliable sources of portfolio investment, has gone into reverse at precisely the moment Islamabad is leaning on its Gulf relationships diplomatically.
The numbers
State Bank of Pakistan data show that from July 1, 2025 to June 19, 2026, equity market inflows totalled just $308 million while outflows exceeded $1 billion. Foreign direct investment declined by 28% over the first 11 months of FY26, domestic bonds saw a net outflow of $550 million, and total bond outflows for the year topped $2 billion. Pakistan’s external financing needs are steep: the country must pay over $26 billion in 2026–27, against an $35 billion trade deficit in the first 11 months of FY26.
Between July 2025 and June 2026, foreign outflows from Pakistan’s domestic bonds exceeded $2 billion, while equity market outflows topped $1 billion against just $308 million in inflows. Gulf states have been net sellers, with Bahrain withdrawing $30 million from Pakistani bonds in early FY27 alone, as the US-Israeli war with Iran raised regional risk premiums.
The pattern has continued into the new fiscal year. In the first ten days of FY27, Bahrain withdrew $30 million from Pakistan’s domestic bonds — $21 million from treasury bills and $9 million from Pakistan Investment Bonds — with no Gulf country recording any inflow during the period. Luxembourg was the only recorded foreign buyer, investing $4 million.
Why the peace deal matters disproportionately to Pakistan
Analysts quoted in Pakistani financial press note that Pakistan is not a party to the Gulf war but is now part of the peace framework, which raises the stakes for Islamabad if the deal collapses. Remittances from Gulf countries have so far held up, but bankers warn a prolonged conflict could eventually disrupt what remains the country’s largest source of foreign exchange, alongside stagnant exports and growth capped below 4%.
This sits against a wider regional backdrop: a new UNCTAD World Investment Report finds Gulf outbound investment grew through 2025, but warns that a prolonged conflict could redirect Gulf capital toward domestic reconstruction and strategic infrastructure, reducing the pool available for developing economies in Asia and Africa that increasingly depend on GCC financing — a dynamic that directly implicates Pakistan’s financing model.
The underserved angle
Most Pakistani business coverage frames this as an IMF-and-remittances story. The more precise framing is a capital-substitution risk: Pakistan has structurally relied on Gulf sovereign and institutional capital to plug its external financing gap, and that capital source is now competing for the same money regional reconstruction and Gulf domestic strategic infrastructure would need in a prolonged-conflict scenario. There is a live, underreported counter-current too — SBP data show net FDI actually rose from $54.46 million in April 2026 to $214.29 million in May, suggesting the bond-market flight and the FDI picture are not moving in lockstep.
Discover more from The Economy
Subscribe to get the latest posts sent to your email.
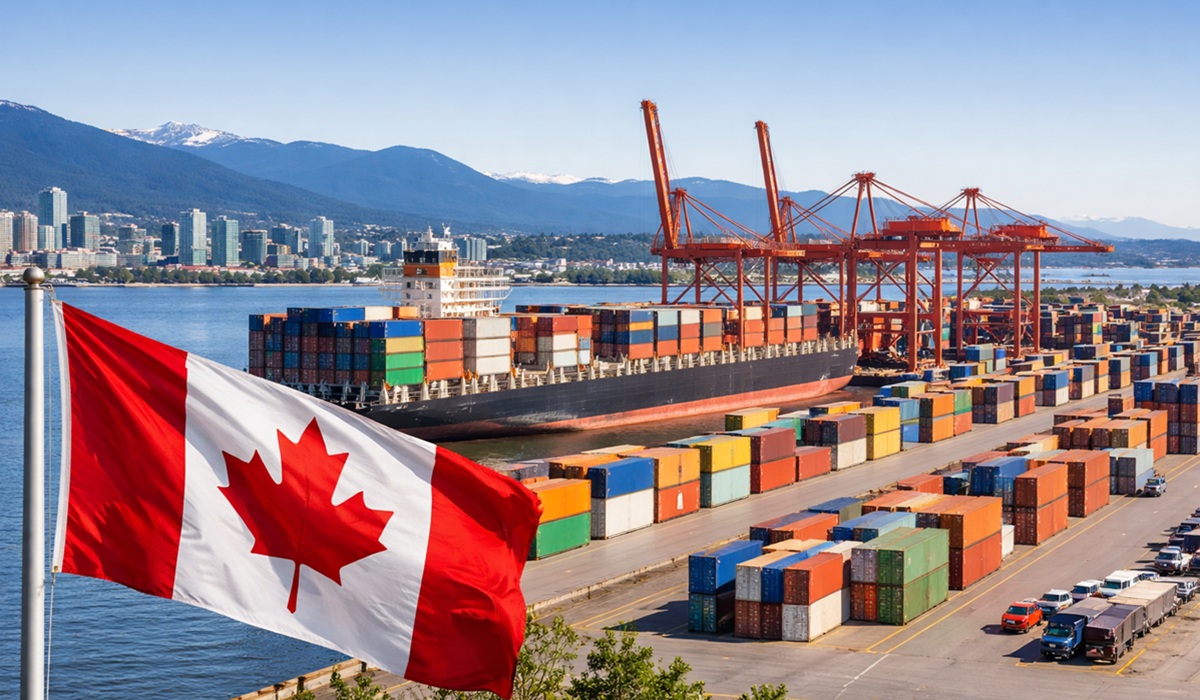
As US tariffs strain CUSMA, Canada is striking deals with China, Indonesia and the UAE. Here’s how Ottawa’s pivot away from the US is actually unfolding.
Every Canadian trade story in 2026 tends to lead with the same character: Washington. But the more consequential story may be what Ottawa is doing everywhere else. Facing sustained US tariff pressure and uncertainty over the CUSMA review, the Carney government has initiated a strategy to diversify Canada’s international trade, with a specific target of doubling exports to non-US markets by 2035.
Canada’s trade diversification strategy aims to double exports to non-US markets by 2035. In 2025–26 it produced a stabilisation deal with China on EVs and canola, a new trade agreement with Indonesia, a Foreign Investment Promotion and Protection Agreement with the UAE, and consultations with India, Thailand and Mercosur.
The deals nobody outside trade-law circles is tracking
Three moves stand out as substantively new rather than aspirational:
- China: during a visit to Beijing, Canada’s prime minister struck a deal establishing a tariff-rate quota for a set number of Chinese EVs — reverting to pre-2024 tariff levels — in exchange for reduced Chinese tariffs on Canadian canola, lobster and peas. This is a live trade-off between EV protectionism and agricultural market access.
- Indonesia: Canada signed a new trade agreement with Indonesia in 2025, opening a Southeast Asian market largely absent from Canadian export strategy until now.
- UAE: Ottawa launched trade-agreement negotiations and signed a new Foreign Investment Promotion and Protection Agreement with the United Arab Emirates, positioning the Gulf as a capital and market-access partner rather than just an energy counterpart.
Meanwhile, exporter confidence has ticked up but remains below its historical average, and diversification remains concentrated in a narrow set of commodities rather than being broad-based.
Why the gravity model is the real obstacle
Trade economists point to the Gravity Model of trade to explain why diversification is structurally hard: the US economy’s size, physical proximity, regulatory similarity and deeply integrated supply chains with Canada make full substitution unrealistic in the near term, even as China and India are flagged as the two most promising long-term markets given they will account for roughly 45% of global economic growth.
The underserved angle
Most coverage treats “Canada diversifying away from the US” as a single narrative. It is actually three distinct, sometimes contradictory tracks: a commodity-for-EV-tariff trade with China, a market-opening play in Southeast Asia via Indonesia, and a capital-and-investment play with the Gulf via the UAE. Each carries different risk profiles — geopolitical risk with China, execution risk with a new Indonesian relationship, and Gulf capital that is itself increasingly redirected toward domestic reconstruction needs amid regional conflict.
Discover more from The Economy
Subscribe to get the latest posts sent to your email.
Analysis of how the Federal Reserve, Bank of England and Bank of Japan could reshape global markets, inflation, currencies and economic growth in 2026.
Executive Summary
The world’s most influential central banks are entering one of the most consequential policy weeks of 2026. Investors are watching closely as the U.S. Federal Reserve, the Bank of England, and the Bank of Japan weigh the competing pressures of easing inflation, geopolitical uncertainty, elevated energy prices, and slowing global growth. Financial markets are also preparing for major corporate earnings and fresh GDP data from several advanced economies. �
Financial Times +1
Unlike the synchronized tightening cycle that dominated recent years, policymakers are increasingly responding to country-specific economic conditions. This divergence is expected to influence capital flows, exchange rates, bond yields, and investment decisions across both developed and emerging markets. �
McKinsey & Company +1
A New Monetary Landscape
Global inflation has moderated from its post-pandemic peaks, yet central banks remain cautious. Recent movements in energy markets and ongoing geopolitical tensions continue to threaten price stability, even as labor markets show signs of cooling. �
McKinsey & Company +1
For investors, the question is no longer whether interest rates have peaked, but how long they will remain elevated.
United States: The Federal Reserve Faces a Delicate Balance
Attention is centered on the Federal Reserve, where policymakers are expected to keep rates steady while evaluating the effects of inflation, consumer demand, and accelerating investment in artificial intelligence infrastructure. Markets are also monitoring whether AI-driven capital spending could contribute to future inflationary pressures. �
Investopedia +1
Bond investors remain sensitive to any shift in the Fed’s language, as Treasury yields continue to reflect expectations about future policy and inflation risks. �
MarketWatch
United Kingdom: Stability Before Growth
The Bank of England is expected to maintain a cautious stance amid moderating wage growth and relatively stable unemployment. However, policymakers continue to weigh external risks, including energy market volatility and global geopolitical developments. �
Financial Times
Businesses remain particularly attentive to borrowing costs, which continue to influence investment decisions across the UK economy.
Japan Ends an Era of Ultra-Loose Money
Japan is undergoing one of its most significant monetary transitions in decades. Rising wages and gradually strengthening inflation have encouraged the Bank of Japan to continue moving away from the ultra-accommodative policies that defined much of the past generation. �
Financial Times
This normalization has implications far beyond Japan, affecting global capital markets and currency dynamics.
Why Emerging Markets Are Watching Closely
Emerging economies including Pakistan, Indonesia, Malaysia, and others remain particularly exposed to decisions made by advanced economy central banks.
Higher U.S. interest rates typically strengthen the dollar, increase external financing costs, and place pressure on countries with significant foreign currency debt.
Conversely, a more stable interest rate environment could improve capital flows into emerging markets while easing exchange rate volatility.
AI Is Becoming a Monetary Policy Variable
One of the most important structural developments in 2026 is the rapid expansion of artificial intelligence infrastructure.
Major technology companies continue investing heavily in data centers, semiconductors, cloud computing, and digital infrastructure. These investments are supporting economic growth but are also creating new questions about inflation, productivity, and long-term financing needs. �
Investopedia +1
Investment Implications
Several themes are emerging:
Higher-for-longer interest rates remain possible.
Government bond markets are likely to remain volatile.
The U.S. dollar could remain relatively strong.
AI-related investment continues attracting capital.
Emerging markets may benefit if inflation continues to moderate.
Competitor Keyword Gap Analysis
Leading publications such as the Financial Times, Reuters, Bloomberg, and CNBC primarily emphasize immediate policy decisions. An opportunity exists to capture additional search traffic by targeting broader intent-based queries.
Key Takeaways
Central bank decisions this week are expected to shape global financial markets.
AI investment is becoming an increasingly important economic driver.
Bond markets remain sensitive to inflation expectations.
Emerging economies face both risks and opportunities from policy divergence.
Investors should monitor GDP releases, corporate earnings, and inflation indicators alongside interest rate announcements.
Frequently Asked Questions
Why are central bank meetings so important?
They influence borrowing costs, inflation expectations, currency values, and investment decisions worldwide.
How do interest rates affect stock markets?
Higher rates generally increase financing costs and can reduce company valuations, while lower rates often support economic activity and equity markets.
Why is AI influencing monetary policy discussions?
Large-scale investment in AI infrastructure is reshaping productivity, corporate spending, and long-term inflation expectations.
Discover more from The Economy
Subscribe to get the latest posts sent to your email.

Pakistan Gulf Investment Outflows 2026: Peace Deal Stakes Explained

Canada Trade Diversification 2026: China, Indonesia, UAE Deals Explained

US Forced-Labour Tariffs on 60 Countries: The Hidden Trade Shock of 2026

Global Central Banks 2026: Fed, BoE and BoJ Decisions Could Reshape Markets

Gulf Capital Retreat From Pakistan 2026: UAE Loan Freeze & What It Means

Pakistan’s Most Reliable Export Is Its People: Remittances Hit $41.6 Billion, Overtaking Total Exports

Indonesia’s Confidence Problem: Record Investment, a Sinking Rupiah, and a Widening Credibility Gap

Down But Not Out: Inside the Slow Sinking of Russia’s War Economy

China’s Growth Slips to a Four-Year Low: Why Beijing Still Won’t Pull the Stimulus Trigger

The Johor-Singapore Corridor: How Malaysia Became Southeast Asia’s AI Infrastructure Powerhouse

Canada’s Economy ‘On Pause’: Inside the CUSMA Deadline That Passed Without a Deal

Dubai’s Millionaire Magnet: How the UAE Turned Middle East Turmoil Into a Capital Safe-Haven Boom

Britain’s Sixth Prime Minister in a Decade: What Starmer’s Exit Means for Gilts, Sterling and Your Portfolio

Anthropic Offers Up to $600,000 Salary for Critical IPO Role as AI Giant Prepares for Wall Street Debut

Carry Trade Unwind 2026: How the Yen’s Snapback Triggered a Global Margin Call

AI Bubble Warning 2026: Why BIS, IMF and Bank of England Fear a Market Crash

BRICS De‑Dollarization Strategy Takes Shape with $15 Billion Local‑Currency Push

The AI Super Bubble Is Ready to Burst

Russia Bans Diesel Exports 2026: Global Fuel Market Impact Explained

Strait of Hormuz Blockade 2026: Oil Prices Surge 9% as US-Iran Conflict Reignites

Private Credit Warning: Most BDCs Turn Unprofitable in 2026, Reuters Finds

IMF Cuts Pakistan Growth Forecast, Raises Inflation to 8.4%

Bitcoin $150k Milestone Achieved as US Sovereign Crypto Pivot Looms
Gulf Capital Retreat From Pakistan 2026: UAE Loan Freeze & What It Means

India Economic Rise 2026: How the Subcontinent Toppled Japan

Strait of Hormuz 2026: Why Markets Still Don’t Trust It’s Open

China Housing Market Turnaround: White‑List Model Stabilises Prices

Chipmakers Just Lost 6.7% in Two Days: Inside the Great AI Trade Rotation
-

 Markets & Finance7 months ago
Top 15 Stocks for Investment in 2026 in PSX: Your Complete Guide to Pakistan’s Best Investment Opportunities
-

 Analysis5 months ago
Johor’s Investment Boom: The Hidden Costs Behind Malaysia’s Most Ambitious Economic Surge
-

 Analysis5 months ago
Top 10 Stocks for Investment in PSX for Quick Returns in 2026
-

 Analysis6 months ago
Brazil’s Rare Earth Race: US, EU, and China Compete for Critical Minerals as Tensions Rise
-

 Banks6 months ago
Best Investments in Pakistan 2026: Top 10 Low-Price Shares and Long-Term Picks for the PSX
-

 Investment7 months ago
Top 10 Mutual Fund Managers in Pakistan for Investment in 2026: A Comprehensive Guide for Optimal Returns
-

 Global Economy7 months ago
15 Most Lucrative Sectors for Investment in Pakistan: A 2025 Data-Driven Analysis
-

 Global Economy7 months ago
Pakistan’s Export Goldmine: 10 Game-Changing Markets Where Pakistani Businesses Are Winning Big in 2025