
Analysis
MSCI Boots Indonesian Tycoon-Owned Stocks from Indices: A $15 Trillion Rupiah Reckoning

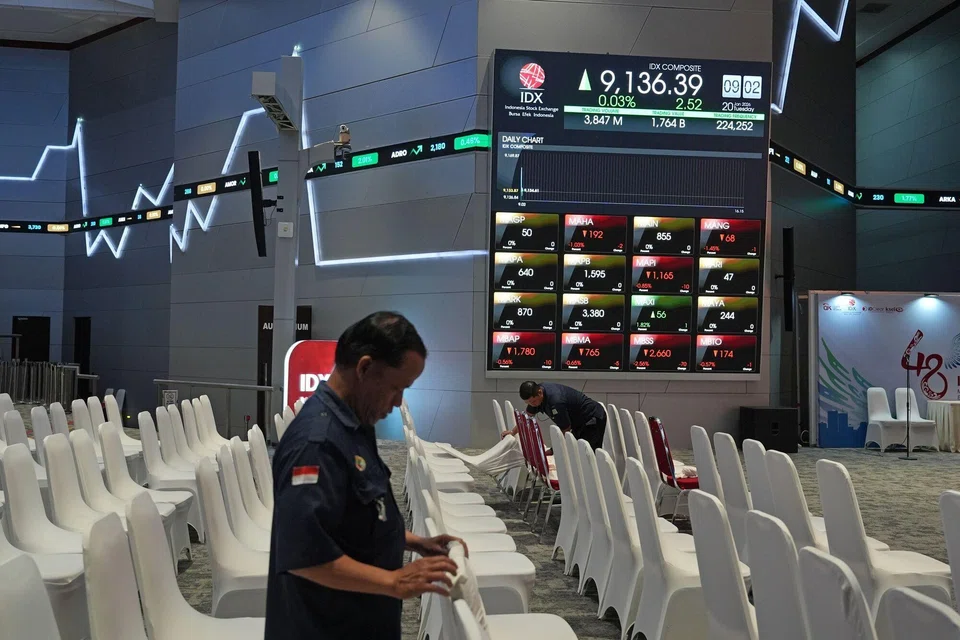
In a landmark investability review, MSCI has moved to boot tycoon-owned Indonesian stocks — most prominently PT Barito Renewables Energy (BREN) and PT Dian Swastatika Sentosa (DSSA) — from its global indices ahead of its May 2026 rebalancing, citing opaque shareholding structures and concerns over coordinated trading that undermines price formation. The Jakarta Composite Index (JCI) has already shed approximately $80 billion in market value since MSCI first raised alarm in January, and passive fund outflows from BREN and DSSA alone are estimated at IDR 15 trillion. This article argues that the MSCI intervention is not merely a technical reweighting exercise — it is a structural forcing function that exposes the incompatibility of Indonesia’s oligarchic ownership model with the standards demanded by global capital markets.
When MSCI announced in January 2026 that it would freeze all index additions for Indonesian securities and place the country’s emerging-market status under formal review, the reaction in Jakarta was instantaneous and brutal. The benchmark Jakarta Composite Index plunged 7.4% in a single session — the steepest one-day drop in nine months — triggering a 30-minute market halt. The following day, the index fell a further 10%, cascading to 7,482 and forcing three trading halts across two sessions. Roughly $80 billion in market capitalisation was erased in the span of 48 hours.
The trigger was a four-page statement from the New York-headquartered index compiler that used the driest possible regulatory language to say something explosive: Indonesia’s largest listed companies were too tightly controlled by their founders to be reliably investable. MSCI boots Indonesian tycoon-owned stocks from indices not merely as a routine methodological housekeeping — but as a verdict on decades of governance neglect that global institutional investors can no longer afford to overlook.
Background: How Indonesia Built a Market on Billionaire Foundations
The Jakarta Stock Exchange has long been dominated by family-owned conglomerates whose listed subsidiaries span mining, banking, tobacco, petrochemicals and renewable energy. According to data compiled by PT Trimegah Sekuritas, the top 20 tycoon-linked companies account for nearly 43% of the Jakarta Composite Index’s total weighting. This concentration was not accidental — it was the architecture of post-Suharto capitalism, where business licences and political proximity created dynasties that listed subsidiaries on the exchange without meaningfully surrendering control.
The concept of Indonesia’s so-called “deep-fried stocks” — a term that gained international currency after reporting by the Financial Times — captures the essential problem. These are tightly held shares, often with fewer than 5% of outstanding stock available for public trading, whose price can be engineered to spike dramatically in the hands of a controlling shareholder, lifting their owners into the upper echelons of Asia’s richest overnight. The very illiquidity that enables such manoeuvres is what makes these stocks structurally unfit for inclusion in a globally benchmarked index that passive fund managers must faithfully replicate.
MSCI’s own consultation paper on Indonesian free-float methodology — released in September 2025 and seeking responses by January 2026 — proposed using the Monthly Holding Composition Report from KSEI (PT Kustodian Sentral Efek Indonesia) as an additional data source to estimate true free float. The findings were damning. Many Indonesian companies disclose only shareholders owning 5% or more of total shares, leaving a vast opacity below that threshold. The KSEI report, while providing some additional granularity by investor category, could not identify individual shareholders — meaning the true beneficial ownership remained obscured behind opaque corporate and nominee structures.
“Opacity in shareholding structure and concerns about possible co-ordinated trading behaviour that undermines proper price formation.”
— MSCI Official Statement, January 2026
The Decision and the Immediate Market Rout
By early April 2026, the Indonesia Stock Exchange (IDX) published a public list of nine companies where more than 95% of shares are held by a concentrated group of investors. Two names dominated the conversation: PT Barito Renewables Energy Tbk (BREN), controlled by Prajogo Pangestu — Indonesia’s richest man with an estimated net worth of $35.2 billion — and PT Dian Swastatika Sentosa Tbk (DSSA), affiliated with the Widjaja family’s Sinar Mas Group. Both are constituents of the MSCI Global Standard Index since 2025. Both fell more than 7% on the day of the IDX announcement.
Affected Tycoon-Linked Indonesian Stocks — MSCI Exclusion Risk Tracker (April 2026)
| Ticker | Company | Conglomerate / Tycoon | Est. Free Float | Price Move (Apr) | Est. Passive Outflow | MSCI Risk |
|---|---|---|---|---|---|---|
| BREN.JK | PT Barito Renewables Energy | Prajogo Pangestu / Barito Group | <5% | −9.17% | ~IDR 6T | 🔴 Removal Likely |
| DSSA.JK | PT Dian Swastatika Sentosa | Widjaja Family / Sinar Mas | <5% | −9.34% | ~IDR 9T | 🔴 Removal Likely |
| ABLI.JK | PT Abadi Lestari Indonesia | Undisclosed consortium | <5% | −3.20% | ~IDR 1.2T | 🟡 Under Review |
| AGII.JK | PT Samator Indo Gas | Rachmat Handoyo family | ~7% | −2.80% | ~IDR 0.9T | 🟡 Under Review |
Sources: Bloomberg; IDNFinancials / Maybank Sekuritas; IDX filings April 2026. Passive outflow estimates are indicative.
The anticipated passive fund outflows from BREN and DSSA combined are estimated at approximately IDR 15 trillion if both are removed at the May 2026 rebalancing, according to analysts at Maybank Sekuritas Indonesia. That figure represents forced selling by index-tracking funds that have no discretion over whether to hold or sell once a stock is excised from a benchmark. In a market already suffering from 13.96 trillion rupiah ($834 million) in foreign outflows across all of 2025 — the worst annual figure since 2020 — mechanical passive selling on top of discretionary exits could prove destabilising.
“Stocks included in the high-concentration category are highly likely to be removed from MSCI. That is almost certain, and they will not be eligible for re-entry within the next 12 months.”
— Fath Aliansyah Budiman, Head of Investment Specialist, Maybank Sekuritas Indonesia
Governance and Ownership: A Forensic View
The Structural Problem No Regulator Would Solve
For years, institutional investors pressed Indonesian regulators to address the market’s chronic free-float problem. The minimum public shareholding requirement stood at just 7.5% — a threshold so low it was effectively an invitation for controlling shareholders to list subsidiaries as stock market proxies without surrendering meaningful economic or voting control. International fund managers operating under fiduciary mandates found it increasingly difficult to enter and exit positions at scale without moving the market, inflating trading costs and compressing risk-adjusted returns.
Governance Scorecard — Key Tycoon-Linked MSCI Constituents
| Company / Ticker | Free Float | Disclosure Transparency | MSCI Governance Risk |
|---|---|---|---|
| BREN.JK — Barito Renewables | 🔴 Critical (<5%) | 🔴 Low | Exclusion Imminent |
| DSSA.JK — Dian Swastatika | 🔴 Critical (<5%) | 🔴 Low | Exclusion Imminent |
| BBCA.JK — Bank Central Asia | 🟡 Moderate (~15%) | 🟡 Partial | Watch — 15% Transition |
| BYAN.JK — Bayan Resources | 🟡 ~12% | 🟢 Improving | Monitoring Period |
Assessments based on IDX filings, MSCI consultation findings, and Maybank/BCA Sekuritas research. Not investment advice.
What makes the BREN and DSSA cases particularly instructive is that their problems were visible well in advance. Analysts at Maybank Sekuritas noted that MSCI had been monitoring high ownership concentration in both stocks since August 2025 — months before the January 2026 public warning. The regulator’s failure to act pre-emptively, and the tycoons’ unwillingness to dilute their stakes voluntarily, transformed what should have been a managed governance upgrade into a systemic market crisis.
The resignations of Mahendra Siregar, chair of Indonesia’s Financial Services Authority (OJK), and Iman Rachman, president-director of the IDX — along with three other senior OJK officials — were extraordinary acknowledgments that the regulatory apparatus had failed. Siregar’s statement described his departure as a “form of moral responsibility.” In practice, it was a recognition that years of regulatory capture by conglomerate interests had made Indonesia’s capital markets structurally unfit for the global index ecosystem they claimed membership of.
“The swift reaction to MSCI’s downgrade threat underscores the influence of index providers.”
— Alex Matturri, Former Head of S&P Global’s Indexing Business
Macro and Policy Implications: Reforms Under Fire
The Indonesian government’s policy response has been swift — but its adequacy remains in serious question. The OJK and IDX have committed to raising the minimum free-float requirement from 7.5% to 15%, with a phase-in period of up to three years for non-compliant companies. Future IPOs will be required to offer between 15% and 25% of shares, up from the previous 10%–20% range. These are meaningful structural reforms — but the transition timelines may be too generous to satisfy an MSCI deadline measured in weeks, not years.
As of April 20, 2026, MSCI announced it would delay its high-stakes review pending further assessment of the scope, consistency and effectiveness of the new transparency measures — effectively keeping Indonesia in what one analyst described as “a holding pattern.” The delay provides temporary relief but sends a chilling signal: MSCI is unconvinced that the reforms go far enough. The index compiler has now pushed its formal verdict to June 2026, extending market uncertainty and suppressing any incremental passive inflows in the interim.
Indonesia’s macro backdrop amplifies the stakes. The rupiah has weakened materially against the dollar, the fiscal deficit has widened, and concerns about central bank autonomy have added to sovereign risk perceptions. Overseas investors sold a net $834 million worth of Indonesian equities in 2025, the worst outflow year since the pandemic. A formal downgrade to frontier-market status — still a non-trivial tail risk — would force systematic selling by funds benchmarked to the MSCI Emerging Markets Index, potentially triggering a capital account shock that the rupiah would struggle to absorb.
Investor Takeaways
Tactical Guidance for Institutional & Retail Investors
- Reduce or hedge BREN and DSSA exposure immediately. Exclusion from the MSCI Global Standard Index at the May or June review appears highly probable. Stocks removed from the index are ineligible for re-entry for at least 12 months, creating a sustained valuation discount.
- Watch the free-float transition list closely. The nine companies named by IDX for concentrated ownership are on a de facto probation list. Any that fail to dilute stakes within the phase-in period face further exclusion risk at subsequent reviews.
- Underweight Indonesia relative to MSCI EM peers while the June review outcome remains uncertain. The holding pattern means no incremental passive inflows — a structural negative for momentum.
- Monitor the rupiah and sovereign spreads as leading indicators of capital account pressure. A sustained breach of 16,500 IDR/USD would signal heightened systemic risk.
- Selective re-entry opportunities may emerge in quality Indonesian names — particularly those with genuine free floats above 15% and transparent ownership structures — once the MSCI review resolves. Bank Central Asia (BBCA) and Telkom Indonesia (TLKM) are among the names analysts flag as structurally better-positioned.
- Track Prajogo Pangestu’s stake-dilution timeline in Barito and Petrindo. The South China Morning Post has reported he is already moving to loosen his grip — if sufficient dilution occurs before the June review, BREN’s exclusion is not fully certain.
Conclusion and Outlook: The Long Road from “Deep-Fried” to Investable
The MSCI intervention in Indonesia is best understood not as a punishment but as a market-design correction that was overdue by at least a decade. Indonesia’s capital markets developed in the shadow of oligarchic conglomerates whose power was political as much as economic. The index provider’s leverage — derived from the trillions of dollars benchmarked to its emerging markets classifications — has done in weeks what years of investor pressure failed to achieve: it forced the Indonesian state to confront the incompatibility of its ownership culture with the standards of global investability.
The reforms now underway — doubling the free-float minimum, publishing transparency disclosures modelled on Hong Kong’s 2016 precedent, and reforming IPO requirements — represent genuine structural progress. But reforms on paper are not reforms in practice. The three-year phase-in period for existing companies means that the underlying concentration problem will persist well into 2029, even in a best-case scenario. And persuading Indonesia’s most powerful tycoons to genuinely relinquish controlling stakes — as opposed to engineering cosmetic compliance — remains the critical unresolved political economy challenge.
Three scenarios define the near-term outlook:
| Scenario | Conditions | Market Outcome |
|---|---|---|
| 🟢 Bull Case | Tycoons dilute stakes before June; MSCI confirms EM status | Reduced weighting; foreign confidence stabilises |
| 🟡 Base Case | BREN/DSSA excluded at May–June rebalancing; EM status retained | Lower EM weighting; subdued inflows through 2027 |
| 🔴 Bear Case | Reform stalls; MSCI downgrades Indonesia to Frontier by year-end | Sustained capital outflow cycle; rupiah/fiscal stress |
Monitor these three signal variables: MSCI’s June statement; IDX free-float compliance filings; rupiah volatility vs. 16,500 IDR/USD.
Citations & Sources
- MSCI Indonesia Index — MSCI Official
- MSCI Free Float Consultation Paper (Sept 2025)
- Bloomberg — Indonesia Flags Tightly Held Companies (Apr 3, 2026)
- Bloomberg — Indonesia Stocks Plunge 7% After MSCI Warning (Jan 28, 2026)
- Bloomberg — MSCI Delays High-Stakes Indonesia Review (Apr 20, 2026)
- Jakarta Globe — Indonesia to Raise Minimum Free Float to 15%
- Bangkok Post — Indonesian Stocks Plunge on Downgrade Warning (Jan 28, 2026)
- IDNFinancials — BREN, DSSA Face MSCI Exit Risk
- South China Morning Post — Indonesia’s Richest Man Loosens Grip on Barito
- ETF Stream — MSCI Action in Indonesia Proves Growing Power of Index Providers
Discover more from The Economy
Subscribe to get the latest posts sent to your email.



Key Takeaways
- Rolex’s secondary market rose approximately 7.9% year-over-year as of 2026 (per WatchCharts data) — trailing Patek Philippe (+16.2%) and Tudor (+11.4%) but still outperforming Audemars Piguet (+3.4%).
- Rolex raised U.S. retail prices 4–9% in January 2026 (steel models ~5.6%, gold models ~8.7%), narrowing the historical gap between retail and pre-owned pricing.
- Not every model appreciates: steel sports references (Submariner, GMT-Master II, Daytona) have held value far better than two-tone or widely available dress references like the standard Datejust.
- The Lady-Datejust posted the sharpest 2026 gain among tracked collections — up 22.73%, from roughly $9,269 to $11,376 — driven by demand for smaller, “everyday luxury” watches.
- Gold’s rise past $2,400/oz has directly lifted the investment case for Rolex’s precious-metal references (Day-Date, Sky-Dweller, Yacht-Master).
The Model-by-Model Picture
| Category | 2026 Trend |
|---|---|
| Lady-Datejust | +22.73% (strongest performer among tracked collections) |
| Steel sports models (Submariner, GMT-Master II) | Held value well; corrected from 2022 peak but stabilized above retail |
| Daytona | Corrected from highs above $50,000 to the mid-$30,000s; still among the most sought-after references |
| Two-tone/widely available Datejust | Flat to negative — “holds value” is an overstatement for this category |
| Gold references (Day-Date, Sky-Dweller) | Lifted by gold’s rise above $2,400/oz |
Why the “Rolex Always Appreciates” Myth Is Fading
The pandemic-era boom pushed some references — the Daytona above all — to speculative highs disconnected from historical norms. Since the March 2022 peak, steel sports models have compressed meaningfully, and dealers who bought inventory near the top have in some cases faced 20–40% markdowns on liquidation. The lesson for 2026 buyers: Rolex as a category is not a monolith. Value retention depends heavily on specific reference, condition, and whether the piece comes with box and papers (“full set”).
What’s Actually Driving 2026 Strength
- Retail price increases raise the floor. When a new Submariner retails at $10,050 (up from $9,500), a pre-owned example at $11,000–$12,000 suddenly represents a smaller premium — narrowing the gap without secondary prices actually moving.
- Supply discipline remains Rolex’s core lever. The brand has never confirmed production numbers, and secondary-market premiums remain entirely a function of Rolex’s own manufacturing decisions — a risk factor as much as a support.
- Certified Pre-Owned rollout. Rolex’s now fully rolled-out CPO program has changed how buyers transact in the used market, adding a layer of brand-verified legitimacy that supports pricing.
The Case for Rolex as a Portfolio Diversifier
Financial advisors increasingly frame luxury watches not as a replacement for equities or bonds, but as a tangible, historically low-correlation diversifier — one that carries its own risks (illiquidity, condition-dependent pricing, no yield) but has demonstrated multi-decade resilience for specific references.
Is Rolex a good investment in 2026?
It depends heavily on the specific reference. Steel sports models like the Submariner and Daytona have held or grown in value; two-tone and widely available dress models generally have not. Overall, Rolex’s secondary market rose about 7.9% year-over-year in 2026, trailing Patek Philippe but ahead of Audemars Piguet.
Discover more from The Economy
Subscribe to get the latest posts sent to your email.

Navigating Mortgage and Loan Refinancing in a High-Yield Environment
Global public debt crossing critical thresholds has kept central bank policies volatile, resulting in fluctuating US Treasury yields throughout 2026. For homeowners and commercial property holders burdened by previous high-interest borrowing cycles, finding optimal refinance windows has become a high-stakes financial puzzle. Stalled disinflation and stubborn employment numbers mean rate cuts are incremental, requiring borrowers to act with precision.
Timing your mortgage or commercial loan refinance in this environment requires a deep understanding of yield curve movements and lender risk appetites.
Decoding 2026 Refinance Dynamics
The 10-Year Treasury Yield Benchmark
Mortgage rates continue to track closely with the 10-year US Treasury yield. When macroeconomic anxiety spikes debt issuance, yields rise, tightening consumer borrowing capacity. Savvy borrowers monitor weekly Treasury auctions to lock in rates during brief dip windows.
Hybrid ARMs and Alternative Structures
With fixed rates remaining elevated, 7/1 and 10/1 adjustable-rate mortgages (ARMs) have surged in popularity. These products offer lower initial monthly payments, giving borrowers breathing room until central bank easing cycles fully materialize.
| Loan Product | Current Rate Range | Best For | Key Risk Factor |
| 30-Year Fixed Mortgage | 6.2% – 6.8% | Long-term predictability | Higher initial monthly outlay |
| 7/1 Hybrid ARM | 5.5% – 5.9% | Short-term ownership / flipping | Rate reset risk after year 7 |
| Commercial Refinance | 7.0% – 8.2% | Corporate asset restructuring | Strict DSCR lender covenants |
Actionable Steps for Successful Refinancing
To maximize your chances of securing favorable refinance terms in a volatile market, follow a disciplined preparation strategy.
Boost Your Credit Score Immediately: Lenders in 2026 are applying stringent credit tiering; a 20-point increase can drop your APR by a crucial quarter-point.
Shop Regional Credit Unions: Smaller financial institutions often offer portfolio loans with more flexible underwriting than major national banks.
Calculate the Break-Even Point: Ensure your total closing costs are recouped through monthly savings within 24 months of closing.
“Market Strategist View: Refinancing in 2026 is an exercise in opportunistic timing. Borrowers must maintain immaculate financial profiles ready to strike the moment Treasury yields dip.”
Mastering the complexities of today’s debt environment ensures you can successfully lower your debt service costs and protect your long-term financial stability.
Discover more from The Economy
Subscribe to get the latest posts sent to your email.

The days of pulling generic auto insurance quotes based purely on your zip code and age are officially over. In 2026, insurance comparison engines are powered entirely by generative AI and real-time telematics. These platforms digest thousands of live data points—ranging from your driving smoothness via connected vehicle sensors to real-time traffic congestion patterns—to generate hyper-personalized premiums instantly.
For consumers, this evolution represents both a massive opportunity for savings and a hidden trap for penalty pricing. Understanding how AI algorithms evaluate risk is essential for anyone looking to lower their monthly auto insurance premiums.
How AI Comparison Engines Evaluate Your Risk Profile
Behavioral Telematics and Connected Cars
Modern cars stream performance data directly to insurance aggregators. Generative AI models analyze braking sharpness, acceleration curves, cornering G-forces, and phone distraction metrics. Drivers who maintain smooth, defensive habits are rewarded with dynamic rate cuts of up to 40% compared to traditional rating tiers.
Predictive Traffic and Weather Modeling
AI tools now cross-reference your daily commute route with predictive weather and accident probability models. If your standard parking location or driving corridor has a statistically higher incidence of uninsured motorist claims, your quotes will reflect that hyper-local risk assessment.
| Comparison Factor | Traditional Rating Model | 2026 Generative AI Model | Impact on Premium |
| Mileage & Usage | Annual estimated odometer reading | GPS tracking & live trip duration | High (up to 35% savings) |
| Driving Behavior | MVR driving record & accidents | Real-time braking, speed, & G-force | Critical (determines tier) |
| Vehicle Tech | Make, model, and safety rating | ADAS calibration & repair cost data | Moderate |
Strategies to Lower Your AI-Driven Insurance Quote
To outsmart the algorithm and secure the lowest possible premium in 2026, drivers must proactively manage their digital footprint on insurance platforms.
Opt-In for Telematics Trial Periods: Many insurers offer immediate 15% discounts just for installing their driving app; let it track safe habits for 30 days to lock in permanent savings.
Scrub Unverified Public Records: Ensure your motor vehicle report is free of clerical errors that AI risk models misinterpret as reckless behavior.
Compare AI Aggregators: Use platforms that integrate multi-carrier API feeds rather than single-brand comparison sites to find the best risk-adjusted rate.
“Industry Note: AI-driven pricing rewards transparency and precision. Drivers who actively manage their telematics data consistently out-save those relying on legacy quote calculators.”
Embracing AI comparison tools allows savvy policyholders to customize coverage limits precisely to their driving habits, eliminating wasted premium spend while ensuring robust protection.
Discover more from The Economy
Subscribe to get the latest posts sent to your email.

Bitcoin Price Forecast 2026–2027: Will the 4-Year Cycle Hold?

Fidelity Crypto vs. Traditional Brokerages: A Guide for Modern Investors

The 2026 Global Smartphone Market: AI Integration and Competitor Analysis

SpaceX IPO: How Aerospace Is Reshaping Tech Startup News

Fidelity Investments Review: Maximizing Returns in a Volatile Stock Market

How Crypto Transformed the Trump Fortune: A $1.4 Billion Financial Breakdown

Global Pension Systems Ranked: The World’s Best and Worst Retirement Frameworks

Global Supply Chain Vulnerabilities: From Eurasian Trade Corridors to Food Consumer Recalls

Why 5% U.S. Treasury Yields Signal a Global Market Regime Shift.

Federal Reserve Defies White House Pressure: Inside Trump’s Demand for Sub-1% Interest Rates After Historic 2026 Rate Hike

How Rising Interest Rates Impact Gig Economy Apps: DoorDash, Uber, and Urban Services

GasBuddy Market Insights: How Crude Price Shifts Impact Local Fuel Cost Averages

DoorDash Driver Payouts, Fee Structures, and Market Competition Analysis

OPINION:Breaking the 3.5% Growth Trap: How Pakistan Can Build a High-Productivity Export Economy

State Farm’s $5B Dividend 2026: Who Qualifies & Payout Dates

US-China Relations in Q3 2026: Trade Tariffs and Supply Chain Risks

SpaceX Starship Flight 14: First Orbital Attempt & Starlink V3 Launch Explained

Top 30 Stocks for Investment in PSX for Massive ROI in 2026

The 2026 Crypto Regulatory Shift: What It Means for Institutional Investors

AI Chip Stocks 2026: The Best Semiconductor Investments Beyond Marvell

AI-Powered Training: The Next Multi-Billion Dollar Ecosystem in Fitness

Tween Back-to-School Trends 2026: What’s Driving the $85B Season

Oil Prices Break $100 in 2026: Middle East Conflict & Energy Markets

10-Year Treasury Yield Hits 4.80%: What It Means for Rates & Portfolios

Fidelity Investments Review 2026: SPAXX Yields & Zero-Fee Funds

Shein Clothes Quality & Safety in 2026: What Lab Tests Show

MRVL Earnings 2026: Why Marvell Sank Despite Beating Estimates

China’s US$10.8 Billion Trade Shortcut: Why the Pinglu Canal Matters
-

 Markets & Finance9 months ago
Top 15 Stocks for Investment in 2026 in PSX: Your Complete Guide to Pakistan’s Best Investment Opportunities
-

 Analysis7 months ago
Johor’s Investment Boom: The Hidden Costs Behind Malaysia’s Most Ambitious Economic Surge
-

 Analysis7 months ago
Top 10 Stocks for Investment in PSX for Quick Returns in 2026
-

 Analysis8 months ago
Brazil’s Rare Earth Race: US, EU, and China Compete for Critical Minerals as Tensions Rise
-

 Banks8 months ago
Best Investments in Pakistan 2026: Top 10 Low-Price Shares and Long-Term Picks for the PSX
-

 Investment8 months ago
Top 10 Mutual Fund Managers in Pakistan for Investment in 2026: A Comprehensive Guide for Optimal Returns
-

 Global Economy9 months ago
15 Most Lucrative Sectors for Investment in Pakistan: A 2025 Data-Driven Analysis
-

 Global Economy9 months ago
Pakistan’s Export Goldmine: 10 Game-Changing Markets Where Pakistani Businesses Are Winning Big in 2025