
Analysis
China Claims the US Agreed to a Tariff Ceiling. Is the Trade War Finally Waning?

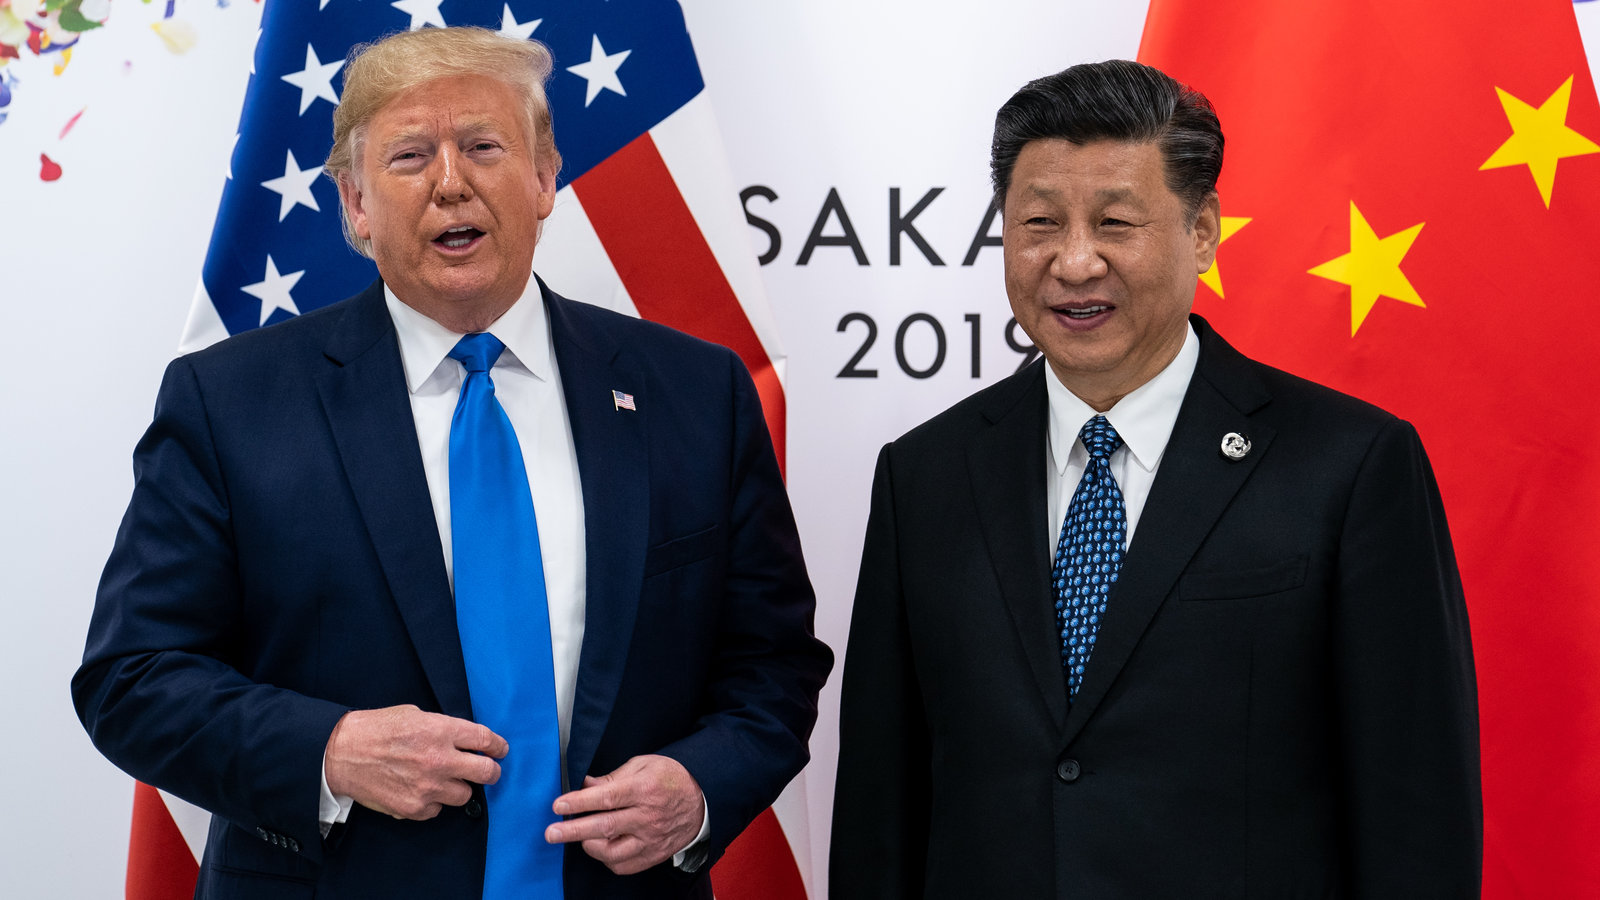
Beijing’s Ministry of Commerce says Washington has committed to keeping future levies within the bounds of the Kuala Lumpur arrangement — a declaration that signals a meaningful, if fragile, shift in the world’s most consequential bilateral trade relationship.
On Wednesday, May 20, 2026, China’s Ministry of Commerce issued a statement that was, by the standards of trade diplomacy, unusually direct. Washington would not raise tariffs on Chinese goods above the level stipulated in the October 2025 Kuala Lumpur arrangement, Beijing said — a commitment arising from preparatory talks held in Seoul, hours before US President Donald Trump arrived in Beijing for his closely watched summit with President Xi Jinping. The pledge, Beijing added, was not merely aspirational. It was a ceiling.
Whether Washington views it that way is another matter entirely. But the fact that such a statement could be issued at all — publicly, by name, citing a named bilateral mechanism — marks a different kind of moment in a trade war that, at its April 2025 peak, saw average US tariff rates on Chinese goods reach 127.2 percent, a level that briefly froze bilateral trade and rattled supply chains from Shenzhen to Sacramento.
The Context: From Tariff Shock to Managed Competition
The speed of the reversal has been striking. In the first week of April 2025, the Trump administration layered on 125 percentage points of additional tariffs in three tranches. China retaliated in kind. Average US tariffs on Chinese imports peaked at 127.2 percent before Geneva talks in May 2025 brought them down to 51.8 percent — still historically elevated, but no longer existential for global supply chains.
Then came Kuala Lumpur. The October 30–November 1, 2025 summit in Busan, South Korea, between Trump and Xi produced the so-called Kuala Lumpur Joint Arrangement, which suspended the additional 24 percent reciprocal tariff on Chinese goods for one year, cancelled the 10 percent fentanyl tariff, and extracted Chinese commitments on rare earth export controls and agricultural purchases. The effective rate on a broad swath of Chinese goods fell to approximately 47 percent — still nearly double pre-2025 levels, but a world away from the spring’s peak.
The architecture that has emerged since is, as analysts at PwC described it, a “shift toward managed competition and sector-specific cooperation.” It’s a phrase worth sitting with. It doesn’t mean peace. It means the two sides have decided to fight more predictably.
The US-China Trade War’s Tariff Ceiling: What Beijing Is Claiming
The US-China trade war tariff ceiling claim rests on a specific reading of the Seoul pre-summit talks, which preceded Trump’s May 14 arrival in Beijing. China’s commerce ministry said Washington committed that future tariff actions — regardless of the mechanism invoked, whether Section 301, fentanyl-related levies, or any new instrument — would not push the effective rate above the Kuala Lumpur benchmark.
“We hope the US side will honour its commitment that … US tariff levels on Chinese goods will not exceed those set under the Kuala Lumpur trade consultation arrangements,” a ministry spokesperson said in the Wednesday statement, as reported by the South China Morning Post.
That framing is deliberate. Beijing is not merely citing a goodwill gesture. It’s recording an institutional commitment — the kind of statement designed to function as a reference point in future disputes, a baseline against which unilateral US actions could be characterised as violations.
The ministry went further. Both sides had, in principle, agreed to form a new bilateral trade council and to discuss a framework for reciprocal tariff cuts covering at least $30 billion worth of each other’s goods, according to the statement. Products identified under the arrangement would enjoy most-favoured-nation rates — or even lower. The US called this mechanism a “Board of Trade.” US Trade Representative Jamieson Greer had first floated it in March as a key deliverable for the Beijing summit.
The numbers are modest relative to the scale of the relationship. In 2025, China exported $308.4 billion in goods to the United States. A $30 billion mutual tariff-reduction basket covers roughly ten cents on every dollar of that flow. Yet the significance isn’t purely arithmetical. It’s architectural: Washington is, for the first time, agreeing to manage bilateral trade flows jointly rather than unilaterally shock them.
What Does “Managed Competition” Actually Mean for Markets?
Is the US-China trade war over, or just paused?
The US-China trade war is neither over nor simply paused — it has entered a new phase of managed competition. Both governments have agreed to maintain high tariffs on strategically sensitive sectors (technology, semiconductors, electric vehicles) while selectively reducing levies on non-sensitive consumer and industrial goods. The truce expires November 10, 2026, and its renewal remains subject to political conditions on both sides.
That answer, compressed to its essence, captures why markets have reacted with cautious optimism rather than euphoria. The Trump-Xi summit in Beijing produced a “constructive China-US relationship of strategic stability” framework, with Xi proposing it as the guiding architecture for the next three years. Graham Allison, Harvard professor and former assistant secretary of defense, called the truce’s formalisation “the big word” from the summit — predicting on CNBC’s The China Connection that the two sides would turn the existing arrangement into a standing agreement.
Yet there’s a reason the Council on Foreign Relations’s Rush Doshi was measured in his assessment. The summit reduced near-term escalation risk; it did not remove structural risks. Tariffs on semiconductors, EVs, steel, and aluminium remain at stratospheric levels. Export controls on advanced chips and related technology remain in force. The Board of Trade mechanism has what CFR analyst Zoe Liu described as “very little clarity” on which sectors qualify, whether it can grow beyond $30 billion, and who manages the inevitable lobbying pressure that any approved-goods list will generate.
The picture is more complicated than the headlines suggest. Washington has quietly abandoned the posture it maintained for 25 years — the insistence that China liberalise its state-directed economic model. As Greer put it bluntly at a Semafor conference in April: “We’re not going to do what Washington tried to do for 25 years, which is, go to the Chinese and say, ‘We’re going to pretend they’re going to become a market economy.'” That’s an honest acknowledgement of failure. But it’s also a significant narrowing of US ambitions that has left some trade hawks uneasy about what, precisely, has been won.
Implications: Boeing, Rare Earths, and the Global Supply Chain Reshuffle
The downstream consequences of a stabilised US-China trade relationship are already visible in asset prices and corporate behaviour. Trump confirmed that China has agreed to order 200 Boeing aircraft — more than the 150 units the company had anticipated. For Boeing, battered by years of manufacturing crises and market share erosion to Airbus, the order is a rare genuine upside. For the trade relationship, it functions as the kind of headline purchase commitment that has historically served to paper over structural disagreements.
Rare earths are, arguably, the more consequential thread. The October 2025 Kuala Lumpur arrangement required China to “postpone and effectively eliminate” its export controls on rare earth elements and related technology, according to the White House’s own executive order formalising the deal. That was the concession that fundamentally changed Washington’s leverage calculus. China’s ability to switch off global supply chains for critical minerals — it had activated that capability in April 2025 with extraterritorial effect — gave Beijing an asymmetric tool that counterbalanced US tariff escalation. The truce suspended both sets of weapons.
For global manufacturers, the immediate effect is a recalibration of diversification strategies rather than their reversal. Roughly 25 percent of iPhone production has already shifted to India; Vietnam now handles most US-bound Apple peripheral devices. Those supply chain moves are not reversing. Companies that have invested in Vietnam, Mexico, and India aren’t going to unwind that investment on the basis of a truce that expires in six months. What changes is the urgency: firms that were accelerating their China-exit strategies can now pace those moves rather than sprint.
The IMF’s global growth forecast of approximately 3.3 percent for 2026 carries within it a tariff drag that has not disappeared. US households are still bearing an estimated $1,500 in annual tariff costs. China’s growth projection of 4.2–4.5 percent reflects a successful pivot toward Asian and European export markets, not a return to pre-trade-war dependency on the American consumer. The global trading system has restructured, not recovered.
The Counterargument: Why Scepticism Is Warranted
There are serious grounds for doubting that Beijing’s tariff ceiling claim translates into durable constraint.
The most obvious parallel is Phase One. In January 2020, China committed to purchasing an additional $200 billion in US goods over two years. That commitment was never close to being fulfilled. The current framework — $30 billion in reciprocal tariff cuts, contingent on a “Board of Trade” mechanism that hasn’t been designed yet — is a much smaller ask. But the pattern of vague commitments outpacing delivery is well established.
Sean Stein, president of the US-China Business Council, has flagged that the business community holds “deep reservations about the idea of managed trade.” The concern is structural: a government-approved goods list is an invitation for political interference, lobbying capture, and the kind of industrial policy distortions that free traders regard as precisely the problem they’ve spent three decades trying to dismantle.
The US-China trade relationship isn’t reverting to any prior normal. The tariff infrastructure — elevated Section 301 duties on electric vehicles at 100 percent, on solar cells at 50 percent, and on semiconductors at rates that effectively fence off Chinese supply — remains fully intact. The Board of Trade mechanism, even if it succeeds, will cover a sliver of the trade relationship. The rest stays in the deep freeze of economic nationalism.
Jack Lee, analyst at China Macro Group, offered a sharp observation after the Beijing summit: Beijing is “trying to turn Trump’s transactional willingness to stabilize ties into a longer-term operating framework for US-China relations” — one that could bind the next US president before they’ve taken office. The tariff ceiling claim fits precisely into that strategy. Record it publicly, name it after a bilateral mechanism, and the institutional weight accumulates even without a formal treaty.
Closing
What’s emerging from the wreckage of the 2025 trade war isn’t a new era of openness. It’s something more transactional, more managed, and — in an odd way — more honest. Both governments have acknowledged that economic decoupling in its full form was always a fiction; the supply chains are too entangled, the mutual dependencies too deep, for clean separation. What they’re building instead is a set of managed lanes: high tariffs and export controls on strategic goods, selected tariff relief on non-sensitive goods, and institutional mechanisms to keep the temperature from spiking again.
The Kuala Lumpur arrangement expires on November 10, 2026. Xi Jinping has been invited to visit the United States on September 24. That meeting, not the Beijing summit, will tell us whether the tariff ceiling Beijing just announced is a real constraint — or simply the latest line drawn in sand.
The trade war isn’t waning. It’s being institutionalised.
Discover more from The Economy
Subscribe to get the latest posts sent to your email.



Key Takeaways
- Rolex’s secondary market rose approximately 7.9% year-over-year as of 2026 (per WatchCharts data) — trailing Patek Philippe (+16.2%) and Tudor (+11.4%) but still outperforming Audemars Piguet (+3.4%).
- Rolex raised U.S. retail prices 4–9% in January 2026 (steel models ~5.6%, gold models ~8.7%), narrowing the historical gap between retail and pre-owned pricing.
- Not every model appreciates: steel sports references (Submariner, GMT-Master II, Daytona) have held value far better than two-tone or widely available dress references like the standard Datejust.
- The Lady-Datejust posted the sharpest 2026 gain among tracked collections — up 22.73%, from roughly $9,269 to $11,376 — driven by demand for smaller, “everyday luxury” watches.
- Gold’s rise past $2,400/oz has directly lifted the investment case for Rolex’s precious-metal references (Day-Date, Sky-Dweller, Yacht-Master).
The Model-by-Model Picture
| Category | 2026 Trend |
|---|---|
| Lady-Datejust | +22.73% (strongest performer among tracked collections) |
| Steel sports models (Submariner, GMT-Master II) | Held value well; corrected from 2022 peak but stabilized above retail |
| Daytona | Corrected from highs above $50,000 to the mid-$30,000s; still among the most sought-after references |
| Two-tone/widely available Datejust | Flat to negative — “holds value” is an overstatement for this category |
| Gold references (Day-Date, Sky-Dweller) | Lifted by gold’s rise above $2,400/oz |
Why the “Rolex Always Appreciates” Myth Is Fading
The pandemic-era boom pushed some references — the Daytona above all — to speculative highs disconnected from historical norms. Since the March 2022 peak, steel sports models have compressed meaningfully, and dealers who bought inventory near the top have in some cases faced 20–40% markdowns on liquidation. The lesson for 2026 buyers: Rolex as a category is not a monolith. Value retention depends heavily on specific reference, condition, and whether the piece comes with box and papers (“full set”).
What’s Actually Driving 2026 Strength
- Retail price increases raise the floor. When a new Submariner retails at $10,050 (up from $9,500), a pre-owned example at $11,000–$12,000 suddenly represents a smaller premium — narrowing the gap without secondary prices actually moving.
- Supply discipline remains Rolex’s core lever. The brand has never confirmed production numbers, and secondary-market premiums remain entirely a function of Rolex’s own manufacturing decisions — a risk factor as much as a support.
- Certified Pre-Owned rollout. Rolex’s now fully rolled-out CPO program has changed how buyers transact in the used market, adding a layer of brand-verified legitimacy that supports pricing.
The Case for Rolex as a Portfolio Diversifier
Financial advisors increasingly frame luxury watches not as a replacement for equities or bonds, but as a tangible, historically low-correlation diversifier — one that carries its own risks (illiquidity, condition-dependent pricing, no yield) but has demonstrated multi-decade resilience for specific references.
Is Rolex a good investment in 2026?
It depends heavily on the specific reference. Steel sports models like the Submariner and Daytona have held or grown in value; two-tone and widely available dress models generally have not. Overall, Rolex’s secondary market rose about 7.9% year-over-year in 2026, trailing Patek Philippe but ahead of Audemars Piguet.
Discover more from The Economy
Subscribe to get the latest posts sent to your email.

Navigating Mortgage and Loan Refinancing in a High-Yield Environment
Global public debt crossing critical thresholds has kept central bank policies volatile, resulting in fluctuating US Treasury yields throughout 2026. For homeowners and commercial property holders burdened by previous high-interest borrowing cycles, finding optimal refinance windows has become a high-stakes financial puzzle. Stalled disinflation and stubborn employment numbers mean rate cuts are incremental, requiring borrowers to act with precision.
Timing your mortgage or commercial loan refinance in this environment requires a deep understanding of yield curve movements and lender risk appetites.
Decoding 2026 Refinance Dynamics
The 10-Year Treasury Yield Benchmark
Mortgage rates continue to track closely with the 10-year US Treasury yield. When macroeconomic anxiety spikes debt issuance, yields rise, tightening consumer borrowing capacity. Savvy borrowers monitor weekly Treasury auctions to lock in rates during brief dip windows.
Hybrid ARMs and Alternative Structures
With fixed rates remaining elevated, 7/1 and 10/1 adjustable-rate mortgages (ARMs) have surged in popularity. These products offer lower initial monthly payments, giving borrowers breathing room until central bank easing cycles fully materialize.
| Loan Product | Current Rate Range | Best For | Key Risk Factor |
| 30-Year Fixed Mortgage | 6.2% – 6.8% | Long-term predictability | Higher initial monthly outlay |
| 7/1 Hybrid ARM | 5.5% – 5.9% | Short-term ownership / flipping | Rate reset risk after year 7 |
| Commercial Refinance | 7.0% – 8.2% | Corporate asset restructuring | Strict DSCR lender covenants |
Actionable Steps for Successful Refinancing
To maximize your chances of securing favorable refinance terms in a volatile market, follow a disciplined preparation strategy.
Boost Your Credit Score Immediately: Lenders in 2026 are applying stringent credit tiering; a 20-point increase can drop your APR by a crucial quarter-point.
Shop Regional Credit Unions: Smaller financial institutions often offer portfolio loans with more flexible underwriting than major national banks.
Calculate the Break-Even Point: Ensure your total closing costs are recouped through monthly savings within 24 months of closing.
“Market Strategist View: Refinancing in 2026 is an exercise in opportunistic timing. Borrowers must maintain immaculate financial profiles ready to strike the moment Treasury yields dip.”
Mastering the complexities of today’s debt environment ensures you can successfully lower your debt service costs and protect your long-term financial stability.
Discover more from The Economy
Subscribe to get the latest posts sent to your email.

The days of pulling generic auto insurance quotes based purely on your zip code and age are officially over. In 2026, insurance comparison engines are powered entirely by generative AI and real-time telematics. These platforms digest thousands of live data points—ranging from your driving smoothness via connected vehicle sensors to real-time traffic congestion patterns—to generate hyper-personalized premiums instantly.
For consumers, this evolution represents both a massive opportunity for savings and a hidden trap for penalty pricing. Understanding how AI algorithms evaluate risk is essential for anyone looking to lower their monthly auto insurance premiums.
How AI Comparison Engines Evaluate Your Risk Profile
Behavioral Telematics and Connected Cars
Modern cars stream performance data directly to insurance aggregators. Generative AI models analyze braking sharpness, acceleration curves, cornering G-forces, and phone distraction metrics. Drivers who maintain smooth, defensive habits are rewarded with dynamic rate cuts of up to 40% compared to traditional rating tiers.
Predictive Traffic and Weather Modeling
AI tools now cross-reference your daily commute route with predictive weather and accident probability models. If your standard parking location or driving corridor has a statistically higher incidence of uninsured motorist claims, your quotes will reflect that hyper-local risk assessment.
| Comparison Factor | Traditional Rating Model | 2026 Generative AI Model | Impact on Premium |
| Mileage & Usage | Annual estimated odometer reading | GPS tracking & live trip duration | High (up to 35% savings) |
| Driving Behavior | MVR driving record & accidents | Real-time braking, speed, & G-force | Critical (determines tier) |
| Vehicle Tech | Make, model, and safety rating | ADAS calibration & repair cost data | Moderate |
Strategies to Lower Your AI-Driven Insurance Quote
To outsmart the algorithm and secure the lowest possible premium in 2026, drivers must proactively manage their digital footprint on insurance platforms.
Opt-In for Telematics Trial Periods: Many insurers offer immediate 15% discounts just for installing their driving app; let it track safe habits for 30 days to lock in permanent savings.
Scrub Unverified Public Records: Ensure your motor vehicle report is free of clerical errors that AI risk models misinterpret as reckless behavior.
Compare AI Aggregators: Use platforms that integrate multi-carrier API feeds rather than single-brand comparison sites to find the best risk-adjusted rate.
“Industry Note: AI-driven pricing rewards transparency and precision. Drivers who actively manage their telematics data consistently out-save those relying on legacy quote calculators.”
Embracing AI comparison tools allows savvy policyholders to customize coverage limits precisely to their driving habits, eliminating wasted premium spend while ensuring robust protection.
Discover more from The Economy
Subscribe to get the latest posts sent to your email.

Anthropic Bans Sustained Abuse of Claude AI Under New Usage Policy Effective November 12, 2026

Jeff Bezos Three-Day Workweek View: What He Really Said

Celeste Frozen Pizza Discontinued: What Conagra Confirmed

US–China Critical Minerals Competition: Why a Trade Deal Cannot Fix Every Supply Risk

Oil Price Outlook 2026: How Supply Risks Reach Fuel Bills, Inflation and Business Costs

AI in Business 2026: Why Faster Employees Do Not Automatically Mean Higher Profits

Mortgage Rates in 2026: Why They Remain High and How to Compare the True Cost

Gold Price Outlook 2026: The Forces Behind the Forecasts—and What Could Reverse Them

Global Economic Outlook 2026: Growth, Inflation and Risks

Trump–Putin Diesel Deal: Why Zelensky Is Angry and What It Means for Fuel Prices

Anthropic Draws the Line: Why Claude’s New Usage Policy Explicitly Bans ‘Cruel Behavior’ Toward AI

Ynon Kreiz & Mattel’s Digital Transformation: Franchise Strategy and Financial Growth

Crude Oil & Petroleum Market Analysis: OPEC+ Decisions and Price Forecasts

Top US Convenience Store Chains: Store Counts, EV Charging, and Sales Trends

Oil Prices Break $100 in 2026: Middle East Conflict & Energy Markets

China Stocks Today: Are Big Economies in Asia Nearing a Market Bottom?

Middle East War Economics 2026: Oil Prices & Energy Markets

PSX Forecast 2026: KSE-100, IMF Reviews & Geopolitics

Crypto Daily Outlook: Bitcoin, Altcoins, and the Future of Decentralized Finance

Global Pension Systems Ranked: The World’s Best and Worst Retirement Frameworks

Enterprise AI Platforms Disrupting B2B SaaS in 2026: Full Analysis

World’s Largest Economies: Ranking the Top Global Powers

Elon Musk’s Next Moves: Disrupting the 2026 Global Economy

Pakistan Economy 2026: Inside the SBP’s Balancing Act

GasBuddy Market Insights: How Crude Price Shifts Impact Local Fuel Cost Averages

World Bank & IMF Reports 2026: Why the “3% Growth” Consensus Is Actually a Debate

Global Equity Market Divergence: US Tech vs. European Dividend Stocks vs. Asian Growth

Stock Market Today: Dow Climbs 500 Points as Markets Shake Off Inflation Jitters
-

 Markets & Finance9 months ago
Top 15 Stocks for Investment in 2026 in PSX: Your Complete Guide to Pakistan’s Best Investment Opportunities
-

 Analysis8 months ago
Johor’s Investment Boom: The Hidden Costs Behind Malaysia’s Most Ambitious Economic Surge
-

 Analysis8 months ago
Top 10 Stocks for Investment in PSX for Quick Returns in 2026
-

 Banks9 months ago
Best Investments in Pakistan 2026: Top 10 Low-Price Shares and Long-Term Picks for the PSX
-

 Analysis8 months ago
Brazil’s Rare Earth Race: US, EU, and China Compete for Critical Minerals as Tensions Rise
-

 Investment9 months ago
Top 10 Mutual Fund Managers in Pakistan for Investment in 2026: A Comprehensive Guide for Optimal Returns
-

 Global Economy10 months ago
15 Most Lucrative Sectors for Investment in Pakistan: A 2025 Data-Driven Analysis
-

 Global Economy10 months ago
Pakistan’s Export Goldmine: 10 Game-Changing Markets Where Pakistani Businesses Are Winning Big in 2025