
News
China Warns of ‘Severe’ Global Conditions as Economy Shows Weakness


The numbers from Beijing’s statistics bureau tell one story. The street-level reality tells another.
On 15 April 2026, China’s National Bureau of Statistics announced that GDP had expanded 5.0 percent in the first quarter — a headline figure that beat market expectations and appeared, at first glance, to validate Beijing’s confidence. Yet within the same press release, the NBS’s own deputy commissioner, Mao Shengyong, issued a sobering qualifier: “External conditions have become more complex and volatile, while structural imbalances at home — marked by strong supply and weak demand — remain pronounced.” Then came April’s data. Industrial output slumped to 4.1 percent growth, retail sales barely registered at 0.2 percent, and fixed-asset investment turned negative for the first four months of the year. The headline had quietly collapsed.
A Fragile Recovery in a Destabilised World
China enters mid-2026 at an economic crossroads it has been approaching for years but has never quite reached. The proximate triggers are well-known: a trade war with Washington that has pushed effective US tariff rates on Chinese goods to 145 percent or above; the inflationary shockwave radiating from the US-led war against Iran, which began in late February and has upended global energy and commodity markets; and a property sector now in its fifth consecutive year of decline, with sales down roughly 65 percent from their 2021 peak.
But the structural forces run deeper. The World Bank estimated China’s growth at 4.9 percent in 2025 and projected a further deceleration to 4.4 percent in 2026, citing “a protracted property sector downturn, subdued confidence, deflationary pressure from weak domestic demand, and heightened uncertainty from shifting global trade policies.” The IMF’s 2026 Article IV consultation went further still, warning that a severe downside shock — comparable in magnitude to the 2008–09 Global Financial Crisis — could trigger a prolonged deflationary spiral and reduce GDP by 5.4 percent relative to the baseline over five years.
That is the backdrop against which China’s latest data must be read.
The Core of the China Economy Weakness Story
The China economy weakness visible in April’s data is not a sudden deterioration. It’s the continuation of a pattern that has persisted, with occasional false dawns, since the property bubble began deflating in 2021.
April’s retail sales figure — just 0.2 percent year-on-year growth — is the single most telling data point. The US-China Economic and Security Review Commission’s May 2026 bulletin documented the trajectory clearly: retail growth bottomed out at 0.9 percent in December 2025, recovered modestly to 2.8 percent in the January-February period boosted by Chinese New Year spending, then fell back to 1.7 percent in March before effectively flatlining in April. The bounce was seasonal noise. The trend is structural weakness.
The property sector’s role in this cannot be overstated. For much of the past two decades, real estate accounted for roughly a quarter of Chinese GDP — directly, through construction and investment, and indirectly, through the collateral and wealth effects that drove consumer spending. That engine has stalled. Property sales have fallen 65 percent from their 2020 peak, and construction has slowed to its lowest level since before 2000. Goldman Sachs Research estimated that the property sector alone dragged approximately two percentage points off annual real GDP growth in both 2024 and 2025.
The trade shock compounds the domestic weakness. China’s Q1 2026 exports to the United States fell 16 percent year-on-year, a direct consequence of American tariff escalation. Beijing offset part of that loss through export diversification — shipments to Southeast Asia rose 20 percent, to Africa 32 percent, to the EU 21 percent — but the arithmetic of substitution has limits when the world’s largest consumer market is imposing triple-digit tariffs.
Industrial output, meanwhile, told a bifurcated story. The headline 4.1 percent growth in April masked a sharp deceleration from March’s 5.7 percent and came in well below the 5.9 percent economists had expected. Yet within that figure, production of 3D printing devices, lithium-ion batteries, and industrial robots surged 54 percent, 40.8 percent, and 33.2 percent respectively year-on-year. China’s economy is not uniformly weak. It is running at two very different speeds.
The Structural Interpretation: Why Growth Numbers Can Mislead
Why does China keep missing its own consumption targets? The question matters — for global commodity markets, for multinational corporates, and for the policymakers in Washington and Brussels deciding how hard to press Beijing on trade.
The standard answer is the property crisis and pandemic scarring. Both are real. Yet the picture is more complicated. China’s household saving rate has risen over the past decade not primarily because consumers are traumatised, but because the social safety net — for healthcare, education, and old-age support — remains inadequate relative to income levels. Without credible public insurance against catastrophic costs, households rationally hold cash. The IMF’s 2026 consultation explicitly linked “weak domestic demand” and “persistent economic slack” to insufficient social protection reform, not simply to property wealth destruction.
What does China’s consumption weakness mean for global growth?
China’s domestic consumption weakness constrains global demand directly and indirectly. Directly, it suppresses Chinese imports of consumer goods, commodities, and services — markets that suppliers from Brazil to Germany depend upon. Indirectly, it intensifies China’s export pressure: a manufacturing base that cannot sell at home redirects output abroad, heightening competitive pressures and trade tensions worldwide. Beijing contributed roughly 30 percent of global growth in recent years; a sustained consumption shortfall there ripples through every commodity curve and supply chain that intersects with it.
The inflation picture adds another layer of complexity. Factory-gate prices turned positive for the first time since September 2022 in March 2026 — a development Beijing had long sought as a sign that deflation was receding. But analysts at Trivium China characterised this as “the wrong kind of inflation”: cost-push from oil price surges caused by the Middle East conflict, rather than demand-pull from genuine consumer recovery. The distinction matters enormously. When producers face higher input costs but cannot pass them on to consumers without killing demand, margins compress further. Overcapacity, already a chronic feature of Chinese industry, becomes more acute.
Beijing set its 2026 GDP growth target at 4.5 to 5 percent in March — the lowest on record going back to the early 1990s, barring 2020 when no target was set at all. That modest ambition is itself a signal. For years, Beijing treated its growth target as a floor to be defended by whatever stimulus was required. Lowering the range is an implicit acknowledgement that the old model — investment-led, export-heavy, real estate-propelled — is running out of road.
Downstream Consequences for Markets, Policy, and the World
The second-order effects of China’s economic fragility are already visible, and they extend well beyond Beijing’s quarterly statistics.
The most immediate concern is deflationary export pressure. With domestic demand weak and production running at overcapacity, Chinese manufacturers face powerful incentives to price aggressively in foreign markets. China’s 2025 trade surplus reached a record $1.2 trillion, even as exports faced stiff tariff headwinds from Washington. That surplus is not simply a bilateral trade story. It represents a structural imbalance — excess savings, insufficient domestic absorption — that puts downward pressure on global prices across dozens of product categories, from steel and chemicals to solar panels and electric vehicles.
For European manufacturers, the consequences are particularly acute. Chinese exports of electric vehicles to the EU surged in Q1 2026 despite the bloc’s own tariffs on Chinese EVs, prompting warnings of a “China Shock 2.0” — a replay of the deindustrialisation wave that followed China’s WTO accession in 2001, but this time concentrated in advanced manufacturing sectors that European policymakers had assumed were insulated.
For commodity markets, the outlook depends entirely on whether Beijing delivers the consumption stimulus it has promised. China has earmarked 1.3 trillion yuan ($188.5 billion) in ultra-long-term special treasury bonds for 2026, alongside 4.4 trillion yuan in local government special-purpose bonds. The numbers are large. Yet “government spending this year will continue to be fairly large in scale,” Premier Li Qiang said in March’s government work report — language that analysts read as continuation rather than escalation.
The fiscal math has changed. China’s budget deficit target now sits at around 4 percent of GDP, the most expansionary stance in modern Chinese fiscal history. Yet the IMF recommended an even larger expansion — focused specifically on consumption rather than investment — arguing that the current fiscal mix, still tilted toward infrastructure and supply-side support, would not adequately close the output gap or decisively break deflationary dynamics. Beijing has heard the advice. Whether it follows it is a different matter.
For global monetary policy, China’s weakness creates an unusual constraint. Central banks in Asia and parts of Latin America that had begun normalising rates now face a deflationary spillover risk from Chinese goods prices. If the yuan depreciates further — the IMF estimated in early 2026 that the renminbi was undervalued by 16 percent — that spillover intensifies. The world’s second-largest economy exporting its excess supply is, in effect, exporting its deflationary pressure.
The Counterargument: China Has Confounded Pessimists Before
It would be intellectually dishonest to write about Chinese economic weakness without steelmanning the contrary view — because China’s economy has, repeatedly and spectacularly, beaten forecasts written off as bearish.
Some prominent analysts argue that the current pessimism is overstated in at least three dimensions. First, the technology transition. China’s exports of green technologies in Q1 2026 showed electric vehicles up 78 percent, lithium batteries up 50 percent, and wind turbine goods up 45 percent year-on-year. These are not the outputs of an economy in structural decline — they are the outputs of one reorienting rapidly toward higher-margin, higher-growth sectors. Goldman Sachs Research projected real GDP growth of 4.8 percent for 2026, above the consensus estimate of 4.5 percent, partly because of export resilience. The property sector’s drag, Goldman estimates, will narrow by 0.5 percentage points per year over the next few years.
Second, policy space. China’s central bank — the People’s Bank of China — has signalled it will maintain an accommodative stance, with potential reserve-requirement ratio cuts and further interest rate reductions anticipated. Unlike many Western economies tightening into a slowdown, Beijing retains both fiscal and monetary tools.
Third, the data transparency problem cuts both ways. Critics who argue that official GDP figures overstate growth should acknowledge that alternative proxies — electricity consumption, rail freight, satellite data — tell a mixed rather than uniformly negative story. China’s 15th Five-Year Plan, unveiled in 2025, explicitly prioritised consumption as the driver of growth — a structural shift that, if implemented, would change the economy’s long-term trajectory materially.
Still, the optimists must grapple with a stubborn fact: consumption’s share of Chinese GDP has not risen meaningfully despite decades of official pledges to rebalance. Promising a pivot is not the same as executing one.
Closing: The Stakes of the Slow Burn
What makes China’s economic situation genuinely alarming — and genuinely consequential — is not any single data point. It’s the convergence of forces that each, in isolation, might be manageable: a property bust that has erased household wealth on a historic scale; a trade war with the world’s largest consumer market that has no resolution in sight; a demographic decline that strips the economy of workers and domestic consumers simultaneously; and an energy shock imported from a Middle East conflict that Beijing neither started nor controls.
Beijing’s policymakers are not passive. They are spending at record levels, cutting rates, and attempting — through the 15th Five-Year Plan and a raft of consumption subsidies — to engineer the demand-led recovery that has eluded them for the better part of a decade. The government set a target of creating 12 million urban jobs in 2026, a commitment that signals awareness of the human stakes behind the aggregate figures.
Yet the language the NBS reached for in April — “complex and volatile,” “acute imbalance,” “strong supply and weak demand” — is the language of a system under genuine strain. When Chinese statisticians, historically among the world’s most optimistic economic communicators, start warning about severe global conditions, it is worth taking them at their word.
The slow burn in Beijing doesn’t stay in Beijing for long.
Discover more from The Economy
Subscribe to get the latest posts sent to your email.


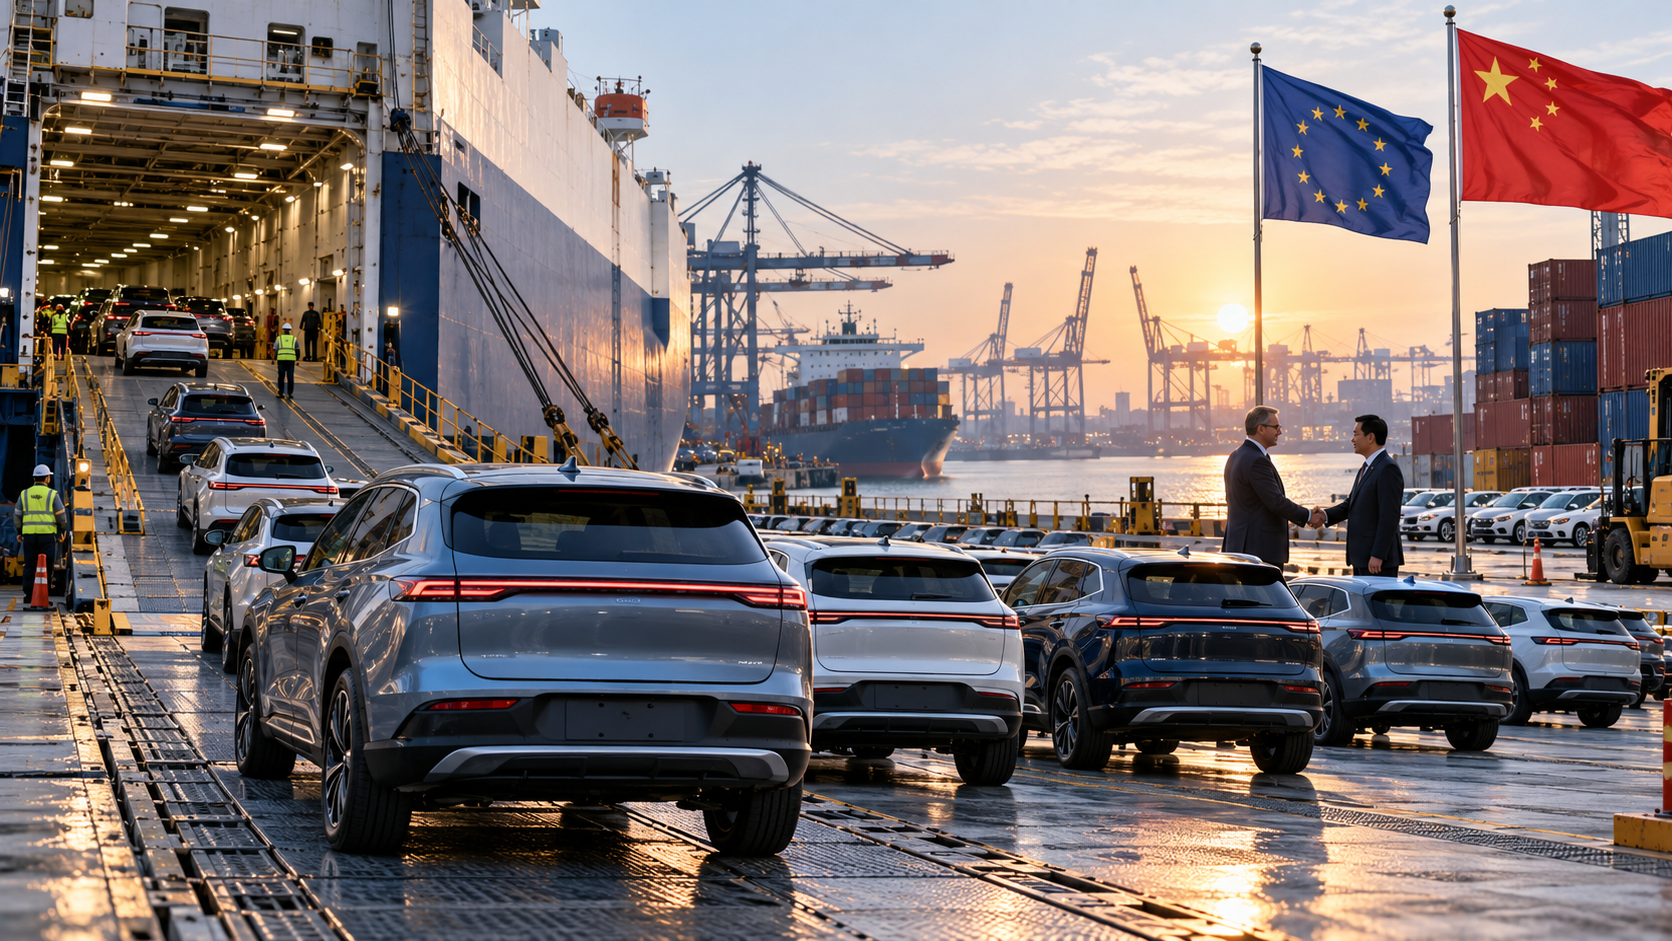
The European Union and China have reached a trade understanding that would sharply limit Chinese hybrid-car imports, reduce selected Chinese tariffs on European goods and ease critical-mineral supply disruptions. But beneath the diplomatic breakthrough lies a much larger conflict over industrial competitiveness, trade imbalances and the future of European manufacturing.
BRUSSELS/BEIJING, October 12, 2026 — China and the European Union have stepped back from a potentially damaging trade confrontation, reaching an agreement that could reshape the European automobile market while opening a new chapter in economic relations between two of the world’s largest trading powers.
The breakthrough, announced on October 9 following negotiations in Beijing, would limit China’s exports of hybrid vehicles to the European Union, improve access to the Chinese market for selected European goods and facilitate licensing for critical rare-earth materials.
The most consequential measure is a planned import quota initially set at approximately 350,000 Chinese-made hybrid vehicles annually, with the ceiling scheduled to rise by 6% each year.
The agreement offers temporary relief after months of escalating friction over Chinese industrial subsidies, European import restrictions and increasingly aggressive competition between Chinese and European manufacturers.
But calling it the end of the trade war would be premature.
The wider dispute remains unresolved, and the agreement’s long-term significance will depend on implementation, regulatory enforcement and whether China and the EU can make progress toward reducing their substantial trade imbalance.
According to Reuters’ October 12 assessment, the arrangement reduces the threat of immediate tariff escalation but replaces it with new risks surrounding import quotas, distribution rights and local manufacturing investment.
The result is not free trade in the traditional sense. It is a negotiated attempt to manage commercial competition before it becomes a broader economic crisis.
Key Takeaways: What the EU-China Trade Deal Means
- Chinese hybrid-car imports face new limits. The EU plans an initial annual ceiling of 350,000 vehicles, rising by 6% annually, compared with a projection of roughly 800,000 shipments in 2026.
- China has accepted a framework for limiting exports. Beijing emphasizes that its producers must receive nondiscriminatory treatment and retain opportunities for growth.
- European exporters receive concessions. China has agreed to lower tariffs on selected products, including automotive components, olive oil and footwear.
- Rare-earth supply chains are part of the understanding. Both sides agreed to facilitate licensing procedures for materials essential to manufacturing.
- The €359.8 billion trade deficit remains a central issue. Europe’s goods imports from China substantially exceed its exports.
- The arrangement is not a complete trade settlement. Further negotiations are scheduled, including another ministerial meeting in March 2027.
What Did China and the EU Actually Agree To?
The agreement followed negotiations on October 8 and 9 between European Trade Commissioner Maroš Šefčovič and Chinese Commerce Minister Wang Wentao, alongside discussions with other senior Chinese officials.
The European Commission’s official account of the consultations describes the talks as productive and confirms that both sides reached a series of understandings intended to stabilize their relationship within the framework of World Trade Organization rules.
The package contains three major components.
1. Restrictions on Chinese hybrid-vehicle exports
The EU has outlined a four-year safeguard arrangement initially limiting imports of Chinese-built hybrid vehicles to approximately 350,000 annually.
The quota is expected to increase by 6% each year.
The Guardian’s October 12 report says the restrictions are expected to begin in December 2026, while the first full-year arrangements cover 2027. The final legal instruments and some implementation details still require clarification.
The policy covers hybrid vehicles, including plug-in hybrids, which became an increasingly important Chinese export category after the EU imposed additional tariffs on battery-electric vehicles in 2024.
EU projections suggest Chinese hybrid shipments could reach around 800,000 vehicles in 2026 without restrictions.
An initial annual quota of 350,000 represents approximately 56% fewer vehicles than that projected baseline.
Crucially, this is a comparison with a forecast, not evidence that actual Chinese exports have already fallen by 56%.
2. Lower Chinese tariffs on selected European products
In return for the automobile arrangements, Beijing agreed to improve market access for several European exports.
According to the Associated Press, the concessions cover products with existing export values approaching €4 billion.
The affected categories include automobile parts, olive oil and footwear, while subsequent reporting also identified ice cream among the products benefiting from lower duties.
The €4 billion figure describes the approximate value of covered trade. It is not the amount of tariffs being eliminated or a guaranteed increase in future European exports.
That distinction is important when assessing the deal’s economic benefits.
Lower duties may improve the competitiveness of affected European products, but actual sales depend on Chinese demand, domestic competitors, exchange rates and other barriers to market access.
3. Greater predictability for rare-earth export licensing
The third component concerns strategically important minerals and industrial materials.
China and the EU have agreed to facilitate Chinese export licensing for rare earths and permanent magnets, according to the Associated Press’ reporting on the negotiations.
These materials support numerous industries, including electric vehicles, wind turbines, industrial equipment and advanced electronics.
The agreement does not establish that China has removed all export controls.
Instead, it represents a commitment to improving licensing processes and making supplies more predictable.
For European companies, reducing administrative delays and uncertainty could be as commercially important as changes in tariffs.
Why Did China Agree to Restrict Its Automobile Exports?
At first glance, China’s willingness to accept limits on one of its fastest-growing export categories appears surprising.
Chinese automakers have invested heavily in electric and hybrid technology, and international expansion has become increasingly important as domestic competition intensifies.
Nevertheless, Beijing faced a difficult choice.
Rejecting the EU’s demands could have encouraged Brussels to introduce more aggressive restrictions, potentially extending the confrontation beyond automobiles.
Accepting a negotiated arrangement allows China to preserve access to an important overseas market while reducing the immediate threat of additional trade retaliation.
China’s public explanation also differs from the European interpretation.
On October 12, the Chinese Commerce Ministry said its agreement with Brussels would ensure that China’s quota for hybrid vehicles would not be lower than quotas allocated to other import sources.
The ministry further emphasized the importance of nondiscriminatory treatment and continued export growth.
As Reuters reported on October 12, Beijing framed the understanding as a way to protect Chinese enterprises and create a more predictable trading environment.
This reveals the underlying compromise.
Europe wants to restrain the speed of Chinese import growth. China wants to preserve market access and prevent a broader campaign of punitive trade measures.
Both sides can therefore claim that the deal protects their core interests, even though neither obtained everything it wanted.
The €360 Billion Problem Behind Europe’s Trade Strategy
The EU-China trade dispute cannot be understood through automobiles alone.
The imbalance between European exports and Chinese imports has become one of the defining economic challenges facing Brussels.
According to Eurostat’s official April 2026 report, the EU imported €559.4 billion in goods from China during 2025 while exporting €199.6 billion.
That produced a goods trade deficit of €359.8 billion.
European exports to China declined by 6.5% compared with 2024, while imports increased by 6.4%.
The imbalance is particularly significant in manufacturing.
EU-China trade: The economic numbers
| Indicator | 2025 figure |
|---|---|
| EU imports from China | €559.4 billion |
| EU exports to China | €199.6 billion |
| EU goods trade deficit | €359.8 billion |
| Year-on-year change in EU exports | -6.5% |
| Year-on-year change in EU imports | +6.4% |
Source: Eurostat, Trade in Goods with China in 2025.
China supplied 22.3% of the EU’s imports from outside the bloc in 2025, illustrating the scale of European dependence on Chinese manufactured products.
More recent official data shows the imbalance continuing.
In the second quarter of 2026, the EU imported €153.6 billion in goods from China, according to Eurostat’s August 26 report.
The underlying problem is structural.
Chinese manufacturers have developed enormous production capacity across automobiles, batteries, machinery, electronics and other industrial sectors.
European policymakers argue that China’s industrial subsidies, scale advantages and market-access restrictions make fair competition increasingly difficult.
China disputes the suggestion that its manufacturing success should automatically be attributed to unfair trade practices.
Chinese officials also argue that European restrictions on technology exports and investment contribute to the imbalance.
The disagreement therefore concerns more than prices or market shares. It reflects competing interpretations of industrial competitiveness and the rules governing international trade.
How the EU’s 2024 Electric Vehicle Tariffs Changed China’s Strategy
The latest agreement is closely connected to the EU’s earlier decision to impose additional duties on Chinese battery-electric vehicles.
In October 2024, the European Commission concluded an anti-subsidy investigation and introduced definitive countervailing duties on imports of Chinese-made battery-electric vehicles.
The measures were designed to address what the Commission described as unfair subsidization threatening European manufacturers.
The policy targeted battery-electric vehicles rather than all electrified vehicles.
That difference created an important commercial incentive.
Chinese manufacturers could expand exports of plug-in hybrid vehicles without facing the same additional duties that applied to fully battery-electric models.
The strategy produced rapid growth.
According to Reuters’ October 12 investigation, China’s hybrid-vehicle exports to the EU reached approximately $7.5 billion in the first half of 2026.
That was three times the $2.5 billion recorded during the same period of 2025.
The surge demonstrated the adaptability of Chinese manufacturers, but it also intensified European concerns that tariffs on one vehicle category were simply shifting competition into another.
The new quota is Brussels’ response.
It changes the central risk facing exporters from the cost of paying additional duties to the possibility of being unable to ship vehicles beyond an annual volume limit.
What is the difference between an import tariff and a quota?
An import tariff raises the cost of an imported product by imposing a duty.
An import quota restricts how much of a product can enter a market.
Under the new hybrid safeguard framework, vehicles exceeding the permitted volume are expected to be prevented from clearing customs rather than simply charged a higher duty, according to the Guardian’s reporting.
For manufacturers, the distinction can be substantial.
A company facing tariffs may choose to absorb part of the cost or raise prices.
A company facing a binding quota may be unable to supply additional vehicles at all.
That can change product planning, dealership arrangements, pricing strategy and decisions about where factories should be built.
Who Wins and Loses From the EU-China Trade Agreement?
The agreement creates different incentives for European manufacturers, Chinese carmakers, consumers and exporters.
European automakers gain temporary protection
Major manufacturers such as Volkswagen, Stellantis and Renault compete in a market undergoing rapid technological and commercial change.
Chinese brands have increased pressure through competitively priced electrified vehicles, improving technology and expanding product ranges.
By slowing the growth of Chinese hybrid imports, the EU may give established manufacturers more time to improve productivity and introduce competitive models.
European industry representatives have welcomed the opportunity for a more orderly adjustment.
However, import restrictions alone cannot resolve underlying problems such as high manufacturing costs, energy prices, investment requirements and the pace of technological innovation.
Without improvements in competitiveness, the protection could offer only temporary relief.
Chinese automakers face new strategic choices
The effect on Chinese manufacturers is more complicated.
Reuters identified SAIC, BYD and Chery as major beneficiaries of the earlier growth in hybrid exports.
Together, those companies accounted for more than 90% of Chinese hybrid sales volume in the EU, according to Jefferies data cited by Reuters.
The new rules may encourage manufacturers to prioritize higher-value vehicles or expand local production in Europe.
Larger companies with established European operations and sufficient investment capital could adapt more easily.
Smaller manufacturers entering the region may face a more difficult challenge.
In a separate Reuters Breakingviews analysis, Katrina Hamlin argued that the arrangement may reflect Beijing’s confidence that its leading manufacturers can increase their European production.
Chinese-built vehicles imported into the EU would be subject to the relevant restrictions, while Chinese-owned factories manufacturing vehicles inside the bloc would generally not be importing completed vehicles from China.
This could encourage a gradual shift from exporting finished cars to investing directly in European manufacturing facilities.
European consumers face a mixed outcome
Import restrictions can support domestic industries, but they can also affect the choices available to consumers.
A smaller supply of competitively priced imported vehicles could reduce price competition in certain market segments.
That may benefit existing manufacturers while limiting affordable options for some buyers.
However, the overall effect on vehicle prices will depend on domestic production, competing imports, demand and manufacturer pricing decisions.
There is not yet sufficient evidence to conclude that the agreement has caused a measurable rise in European vehicle prices.
The consumer impact will become clearer as the quota system begins operating.
European exporters gain market-access opportunities
Companies selling automobile components, footwear, olive oil and other affected products into China could benefit from lower import duties.
These concessions matter because European businesses have repeatedly raised concerns about their ability to compete in the Chinese market.
Nevertheless, the benefits will depend on whether tariff reductions are implemented as announced and whether other barriers continue to constrain sales.
A tariff concession creates an opportunity. It does not guarantee additional demand.
Why Rare Earths Matter as Much as Cars
The automobile agreement has attracted the most attention, but rare-earth licensing is strategically significant.
Rare-earth elements and associated materials are used in permanent magnets, which are essential components in many electric motors and industrial systems.
For an automobile manufacturer, a disruption in a critical component can affect production even when most other inputs remain available.
European policymakers have therefore become increasingly concerned about concentrated global supply chains.
The European Commission’s trade policy framework for China emphasizes the importance of a level playing field, supply-chain resilience and addressing asymmetries in the bilateral economic relationship.
The October agreement offers some reassurance by seeking to make Chinese licensing procedures more predictable.
But European dependence cannot be eliminated through a licensing understanding alone.
Long-term resilience would require investment in alternative suppliers, processing capacity, recycling and strategic inventories.
The risk for Brussels is that a diplomatic disagreement over vehicles could eventually affect entirely different industries through restrictions on essential inputs.
This is why the EU-China relationship cannot easily be reduced to a conventional trade dispute.
Automobiles, critical minerals, industrial policy and advanced technology are increasingly interconnected.
Why France and Germany Are Taking a Tougher Position
European unity has historically been complicated by differences in national economic interests.
Germany has deep commercial relationships with China, particularly through its automobile industry.
France has generally supported stronger European industrial protections in sectors facing intense international competition.
The gap between the two positions has narrowed as concerns over industrial competitiveness have grown.
According to Reuters Breakingviews’ October 9 analysis, France and Germany jointly pushed for stronger EU trade-defense measures, improved supply-chain diversification and mechanisms to respond more rapidly to economic retaliation.
Their approach reflects growing concern that Europe could lose strategically important manufacturing capacity if it remains unable to compete effectively with large-scale foreign producers.
Yet protectionist measures create their own trade-offs.
European carmakers often rely on Chinese production, components and demand.
Some European governments also welcome investment from Chinese automobile and battery manufacturers because new factories can generate employment and support regional development.
Consequently, EU policymakers must balance industrial protection with the risk of discouraging investment or provoking retaliation.
That balance will influence how the new agreement is implemented.
How the Agreement Could Reshape Europe’s Automotive Market
One of the most important consequences may be the acceleration of Chinese investment inside Europe.
When exporting complete vehicles becomes more difficult, building or assembling cars near customers becomes more attractive.
Chinese manufacturers have already begun pursuing that strategy.
According to Reuters’ analysis of the agreement, companies including BYD, Chery, SAIC and Geely have explored or established manufacturing and assembly arrangements in European countries.
Such investments could create European employment and strengthen regional supply chains.
They may also increase competition for established manufacturers operating within the same market.
The economic implications are therefore more complex than a straightforward European victory over Chinese exporters.
Europe may reduce imports of finished Chinese-built vehicles while encouraging additional Chinese-owned manufacturing facilities inside the EU.
Over time, the distinction between a Chinese car company and a European-produced vehicle could become increasingly important.
The key regulatory questions will concern local value creation, investment commitments, competition standards and whether manufacturing is genuinely established within the European market.
Will the Agreement Lower Inflation or Change Global Trade?
The immediate macroeconomic effects are likely to be concentrated in industries directly affected by the concessions.
Import quotas could limit competition in certain European vehicle categories.
Lower Chinese tariffs could support selected European exporters.
More predictable rare-earth licensing could reduce some supply-chain uncertainty.
However, the agreement does not automatically imply a significant reduction in inflation across Europe or China.
Its effect on overall consumer prices will depend on numerous factors, including energy costs, exchange rates, domestic demand, monetary policy and the responses of manufacturers.
The broader international implications may be more important.
The agreement could demonstrate that large economies are capable of negotiating sector-specific solutions even when they remain divided over subsidies, technology restrictions and industrial policy.
Alternatively, it could normalize a more managed form of trade in which quotas, safeguards and negotiated market-access arrangements become increasingly common.
For economies connected to global automotive and electronics supply chains, that development could influence future investment and trade decisions.
Is the EU-China Trade War Really Over?
No. The immediate confrontation has eased, but the underlying disagreements remain.
Several important questions have not yet been fully resolved.
First, the final details of quota administration still matter. Authorities and manufacturers need clarity on how import rights will be allocated, how different vehicle categories will be treated and how compliance will be enforced.
Second, Brussels and Beijing have different priorities.
Europe wants a sustainable reduction in trade imbalances and stronger protection against allegedly unfair competition.
China wants continued access to European consumers and greater certainty that European restrictions will not discriminate against Chinese manufacturers.
Third, existing trade-defense measures on battery-electric vehicles remain distinct from the new hybrid arrangements.
Fourth, future disagreements over semiconductors, industrial subsidies, market access, critical minerals and other strategic goods could trigger renewed tensions.
Finally, domestic political pressures may make the compromise difficult to sustain.
European governments face pressure to protect manufacturing employment, while Chinese authorities are seeking to support industrial growth and exports.
These forces will not disappear because negotiators reached an understanding in Beijing.
What Happens Next? Three Scenarios for 2027
Scenario 1: Managed competition becomes the new normal
The EU implements the quota framework, China delivers the promised market-access concessions, and rare-earth licensing becomes more predictable.
Both sides continue negotiating additional sector-specific arrangements while avoiding major retaliation.
This would produce a relationship characterized by managed competition rather than unrestricted trade.
Scenario 2: The agreement generates new investment
Chinese automobile manufacturers expand manufacturing in European countries to maintain market access.
European suppliers and workers benefit from some of the resulting investment, while domestic automakers face stronger competition from locally produced vehicles owned by Chinese groups.
Under this scenario, the trade restrictions could accelerate a restructuring of Europe’s automobile industry rather than simply reduce Chinese commercial influence.
Scenario 3: Implementation disputes revive the confrontation
Disagreements emerge over the quota’s legal design, its allocation among manufacturers, market-access concessions or export licensing for critical minerals.
The EU considers stronger trade-defense measures, while China responds with restrictions affecting European commercial interests.
This would undermine the temporary stabilization and increase uncertainty for manufacturers, suppliers and investors.
These are possible outcomes, not predictions with assigned probabilities.
The durability of the October understanding will become clearer as implementation rules are finalized and further negotiations take place.
Timeline: How the EU-China Trade Dispute Reached a Breakthrough
| Date | Major development |
|---|---|
| October 2024 | EU imposes definitive countervailing duties on Chinese-made battery-electric vehicles |
| 2025 | EU goods trade deficit with China reaches €359.8 billion |
| First half of 2026 | Chinese hybrid exports to the EU triple in value to approximately $7.5 billion |
| October 8–9, 2026 | Senior EU and Chinese officials negotiate in Beijing |
| October 9, 2026 | Both sides announce an initial trade understanding |
| October 12, 2026 | China describes nondiscrimination and export-growth provisions; further quota details emerge |
| December 2026 | Expected initial introduction of the EU’s new hybrid restrictions |
| March 2027 | Next ministerial EU-China Trade and Investment Consultations planned |
Sources: European Commission, Eurostat, Reuters and The Guardian.
Frequently Asked Questions
What is the EU-China trade deal of October 2026?
It is a negotiated trade understanding involving restrictions on Chinese hybrid-car exports to the EU, reduced Chinese tariffs on selected European products and cooperation on rare-earth export licensing. It aims to stabilize economic relations and prevent further escalation.
How many Chinese hybrid cars can enter the EU under the new deal?
The announced framework envisages an initial annual quota of approximately 350,000 vehicles, increasing by 6% annually. The final implementation rules remain important.
Has China agreed to end its trade dispute with Europe?
No. The October understanding reduces immediate tensions but does not resolve the wider disputes over industrial subsidies, trade imbalances, electric-vehicle duties and technology restrictions.
Will Chinese electric vehicles become more expensive in Europe?
The new agreement primarily concerns import volumes for hybrid vehicles. Its price effects are uncertain. Separately, EU countervailing duties on Chinese-made battery-electric vehicles remain a distinct policy issue.
Which Chinese automakers could be affected?
Major companies with European hybrid sales, including BYD, SAIC and Chery, are exposed to the new import framework. Manufacturers with European production arrangements may be better positioned to adjust over time.
What did European exporters receive in return?
China agreed to lower tariffs on selected European products, including automotive components and certain consumer goods. The affected export categories have an existing trade value approaching €4 billion, according to EU officials cited by the Associated Press.
Why is the EU concerned about its trade deficit with China?
The EU imports significantly more merchandise from China than it exports to the Chinese market. Policymakers argue that the imbalance creates pressure on European manufacturing and reflects wider differences in industrial support and market access.
When will China and the EU hold their next trade talks?
The European Commission has confirmed plans for another ministerial meeting in March 2027, with additional discussions expected before then.
Final Analysis: A Trade War Paused, Not a Competition Resolved
The October 2026 EU-China agreement is significant because it shows that Beijing and Brussels remain willing to compromise when the economic consequences of confrontation become difficult to ignore.
Europe secured a framework for restraining rapidly growing Chinese hybrid-car imports.
China preserved access to a major international market and obtained commitments intended to protect its manufacturers from discriminatory treatment.
Selected European exporters gained tariff concessions, while both sides recognized the importance of more reliable critical-mineral supply chains.
But the most important problems remain largely unchanged.
Europe faces intense pressure to improve its industrial competitiveness. China continues to rely on advanced manufacturing and overseas markets as important sources of economic growth. Both sides remain deeply connected through trade, investment and production networks.
The new agreement may reduce immediate risks, but it also illustrates the emerging reality of global commerce: economic interdependence no longer guarantees unrestricted market access.
The decisive test will be whether Brussels and Beijing can turn this limited diplomatic breakthrough into a stable, transparent and commercially workable relationship.
For now, the EU-China trade war is on pause. The contest over the future of global manufacturing is not.
Discover more from The Economy
Subscribe to get the latest posts sent to your email.
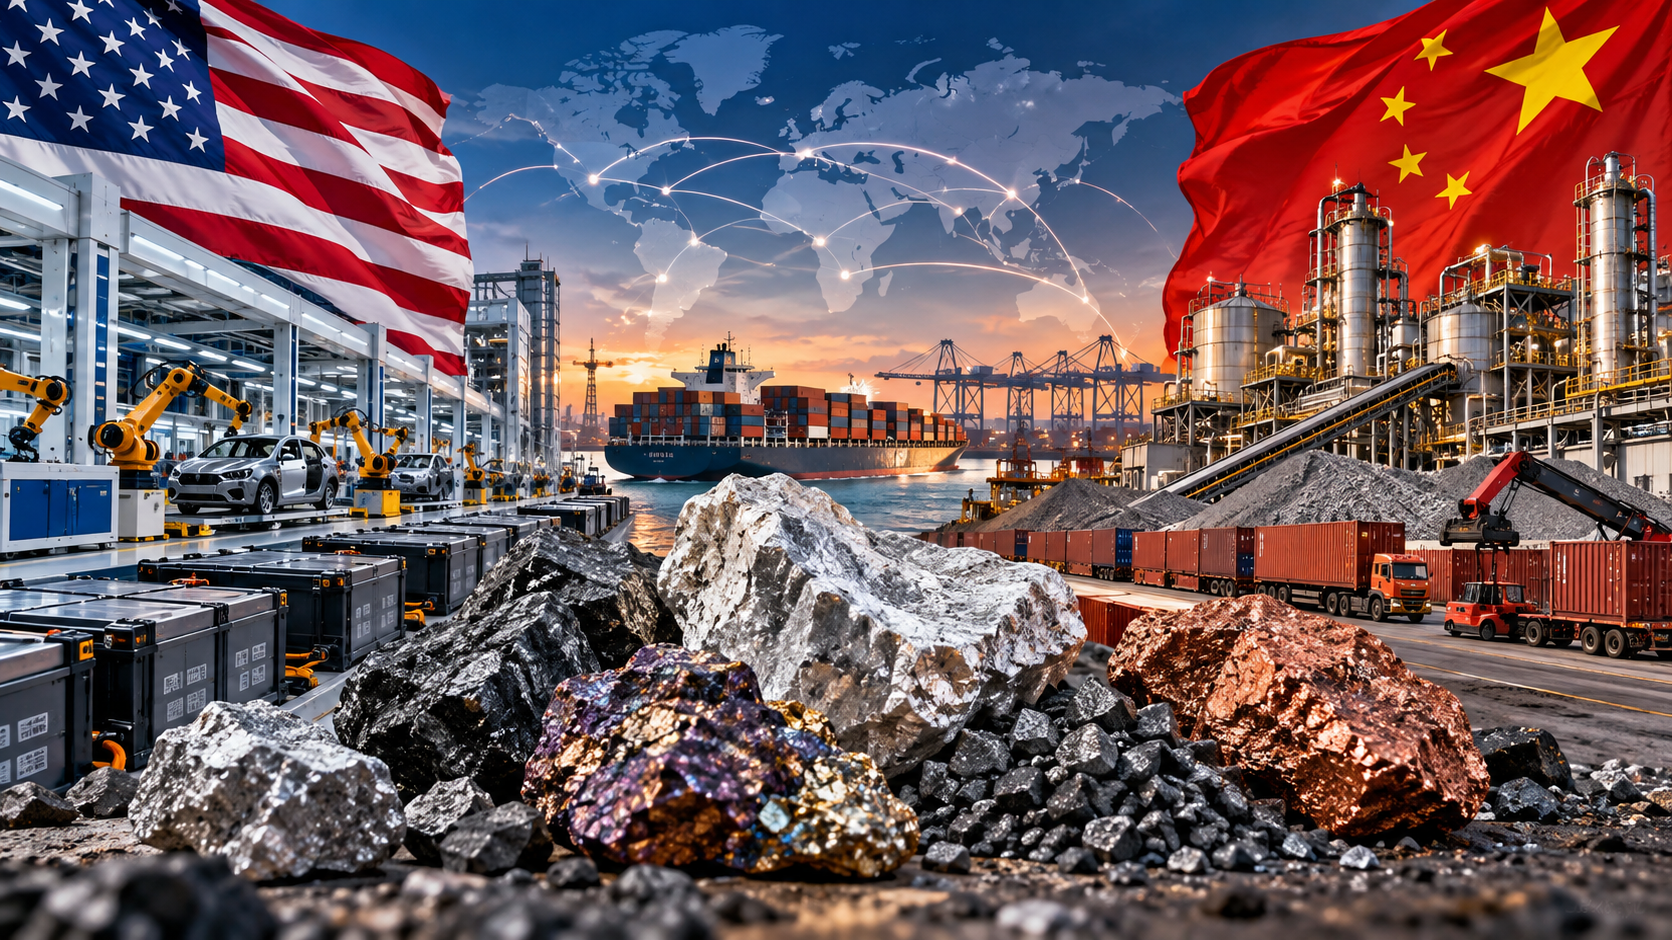
Critical minerals have become a foreign-policy issue because a small missing input can interrupt production far beyond the mining industry. The strategic question is not simply who owns deposits. It is who can process material to the required standard and deliver the components manufacturers need.
A September 2026 Council on Foreign Relations report describes Chinese export controls covering materials such as gallium and rare earths, alongside related components. The International Energy Agency’s 2026 critical minerals outlook examines supply security, diversification and the policy frameworks needed to support more resilient chains.
These developments help explain why tariff negotiations alone cannot resolve every vulnerability. Lower duties can make trade cheaper, but they do not automatically create processing plants, qualified alternative suppliers or a dependable supply of specialised equipment and skills.
Critical minerals and rare earths are not interchangeable terms
“Critical minerals” is a policy category generally concerned with economic importance and supply risk. Different governments maintain different lists because their industries and vulnerabilities differ. Rare earths are a particular group of elements within the wider materials discussion.
Using the terms interchangeably obscures important differences. Copper, lithium, graphite and individual rare earth elements have different applications, production processes and market structures. A policy that helps one material may do little for another.
The first question in any supply-risk assessment should therefore be specific: which material, in what processed form, for which use? A broad statement that a country has abundant minerals does not show that it can supply the exact input a manufacturer requires at a competitive price and dependable scale.
The chain continues long after extraction
A deposit must be explored, financed, permitted and developed before becoming a mine. Extracted material may then require concentration, chemical processing, refining and fabrication before it becomes useful in a component.
Each stage has its own constraints. A country can possess ore while lacking the facilities to process it. Another can dominate a processing step despite having fewer domestic deposits. Manufacturing capability can be concentrated separately again.
This explains why announcing a new mine does not immediately remove dependence. The project must connect with the rest of the chain. Transport, water, electricity, specialist knowledge and customer qualification all influence whether the output becomes commercially useful. Security depends on functioning industrial systems rather than a list of geological assets.
Export controls differ from tariffs
A tariff changes the cost of importing a covered product. An export control can instead affect whether a shipment is permitted, which buyer receives it or what documentation is required. The business consequences can therefore differ substantially.
Even where trade remains legally possible, licensing uncertainty may complicate production schedules. A manufacturer needs to know not only the expected price but whether a required input will arrive before existing stocks are exhausted.
The September reporting on US–China tariff adjustments illustrates why broader trade relief and unresolved mineral questions can coexist. Specific tariff or licensing obligations should be checked against current official measures; a diplomatic headline is not a substitute for a product-level compliance determination.
Why replacing a supplier takes time
Industrial components must meet performance specifications. A new source may need testing, certification and changes to production processes before it can be used reliably. Material with the same general name is not always an interchangeable input.
Buyers also need evidence of consistent quality across repeated deliveries. A successful sample is different from reliable production at scale. Depending on the application, failure can create expensive recalls, equipment damage or interruptions elsewhere in the chain.
This creates a timing problem for policy. Governments may want rapid diversification, while factories cannot responsibly switch overnight. The useful measure is qualified, commercially available alternative supply—not merely announcements, memoranda or theoretical capacity. Progress should be judged by what customers can actually buy and use.
Low prices can make diversification harder
Cheap materials help current consumers but can weaken the investment case for new suppliers. A proposed project must cover construction, financing and operating costs over a long period. If prices fall sharply, lenders and buyers may become reluctant to commit.
The resulting dilemma is strategic. Governments may want additional suppliers for resilience while private firms prefer the lowest available cost. Without a durable commercial arrangement, a diversification project can struggle even when policymakers describe it as essential.
Possible responses include long-term purchase agreements, financing support or other policy mechanisms. Each has trade-offs. Support can improve investment certainty but may transfer risk to taxpayers or customers. A credible programme should explain the vulnerability being addressed and how success will be measured beyond the initial funding announcement.
What mineral-producing countries want
Countries with deposits often want more than royalties from extraction. They may seek local processing, jobs, infrastructure and technical expertise. Their bargaining power depends on the quality of resources, investment conditions and the availability of competing suppliers.
Building downstream industry can add value, but it requires more than restricting raw exports. Reliable energy, skilled workers, environmental management and access to customers influence whether domestic processing becomes competitive.
For countries balancing relationships with Washington and Beijing, diversification can be a diplomatic strategy as well as an industrial one. However, signing agreements with several partners does not automatically eliminate dependence. Financing, equipment and final customers may still connect a project closely to one external market.
Recycling and substitution help, with limits
Recycling can return useful material to the supply chain and reduce demand for newly mined inputs. Its contribution depends on collection systems, recovery technology and the availability of products reaching the end of their lives.
A rapidly expanding technology sector may not yet generate enough retired equipment to meet all its material needs through recycling. Different products also vary in how easily their materials can be separated and recovered economically.
Substitution offers another route. Engineers may redesign products to use less of a constrained input or replace it with another material. That can reduce one vulnerability while changing performance, cost or dependence elsewhere. The practical question is whether the substitute works in the specific application, not whether an alternative exists in principle.
A business checklist that goes beyond supplier nationality
A company should map the origin of critical inputs beyond its immediate vendor. A supplier located in one country may rely on processing or components from another. Several apparently independent vendors can share the same upstream bottleneck.
The next step is to identify which inputs have few qualified alternatives and how long replacement would take. Inventory decisions can then reflect actual exposure rather than broad geopolitical anxiety. Holding more stock of every material may consume cash without solving the most serious problem.
Contracts, customer obligations and technical requirements should be considered together. A procurement team may find an alternative source that engineering cannot approve in time. Coordinating those functions early creates a more realistic picture of resilience and the cost of improving it.
Supplier concentration should also be revisited after mergers, ownership changes or new subcontracting arrangements. A company may believe it has diversified because it buys through several distributors, while those distributors purchase from the same processor. Resilience depends on independent capacity upstream, not simply the number of names in a purchasing database.
What a durable agreement would need to accomplish
A useful diplomatic agreement would improve predictability as well as market access. Businesses benefit from clear procedures, transparent licensing and dependable implementation. The text of an announcement matters less if operational delays remain unresolved.
Longer-term resilience requires additional work: commercially viable capacity, qualified suppliers, infrastructure and technical skills. Those investments usually outlast the news cycle and may span changes of government. Their durability depends on credible economics as well as political commitment.
The US–China critical minerals contest is therefore a test of industrial capability as much as negotiating power. A trade deal can reduce immediate pressure and create room for investment. Lasting security comes from a supply chain that continues to function when one route, supplier or diplomatic relationship becomes less reliable.
Discover more from The Economy
Subscribe to get the latest posts sent to your email.

Publix has closed several stores in 2026, mostly for rebuilds. See the closure list, which sites are being replaced, and where nearby shoppers can go.
Last verified: October 9, 2026. Store closures change often, so confirm details with Publix before making plans.
Key Takeaways
- Most 2026 Publix closures are rebuilds, not permanent exits. Publix says it “replaces supermarkets and closes supermarkets that are not meeting performance expectations.”
- Publix opened seven stores and closed eight between January and March 28, 2026. Seven of the eight closures were linked to replacement stores.
- Some closures have no announced replacement, and Publix has not explained several of them, including two Atlanta-area stores that closed in late 2025.
- Q1 2026 sales rose 2% to $16.1 billion, but comparable-store sales were flat.
- Rebuilds can leave a gap of a year or more. Check the replacement timeline and the nearest open stores before you change your shopping routine.
Search Intent Summary
Shoppers searching for Publix closures want to know whether their store is affected, when it closes, when it reopens, and where to shop in the meantime. This tracker lists the confirmed closures, separates permanent closures from rebuilds, and points to the nearest alternatives where reporting provides them.
The Closure List
The table below covers closures reported between late 2025 and September 2026. It is a snapshot, not a complete record. Publix operates more than 1,400 stores, and its own store locator is the most reliable source for any single location.
| Store and Location | Closure Date | Type | Status |
|---|---|---|---|
| 1380 Atlantic Dr NW, Atlanta, GA (Atlantic Station) | Dec. 27, 2025 | Permanent | No replacement announced; no reason given |
| 2562 Shallowford Rd NE, Chamblee, GA (Shallowford Exchange) | Dec. 27, 2025 | Permanent | No replacement announced; no reason given |
| 8250 Mills Dr, Kendall, FL (Palms at Town & Country) | Jan. 17, 2026 | Rebuild | Demolished and replaced on site; a timeline has not been given |
| 208 Saint James Ave, Goose Creek, SC | Jan. 17, 2026 | Rebuild | Entire store to be torn down and rebuilt |
| 5577 Park St N, St. Petersburg, FL (Eagles Park) | Mar. 7, 2026 | Replaced | New store opened March 12 at 6605 38th Ave |
| 4711 Babcock St NE, Palm Bay, FL | July 11, 2026 | Rebuild | Replacement store planned as part of redevelopment |
| Southdale store, West Palm Beach, FL (Store #50) | Sept. 26, 2026 | Rebuild | Opened in 1959; rebuild timeline not announced |
Two details require caution. Earlier coverage of the Atlanta closures suggested they would close in early 2026, but multiple later reports give December 27, 2025 as the date, and the table follows the later reporting. The Kendall date also appears in multiple formats across reports, so confirm it with the store before relying on it.
Permanent Closures Versus Rebuilds
The distinction matters for shoppers. A rebuild closes the old building, demolishes it, and opens a new store on the same or nearby site. Publix has said rebuilds generally take a year to 18 months, and reporting on one Florida rebuild noted that the old store typically stays closed for 12 to 15 months.
Permanent closures leave a gap. In the Atlanta cases, Publix did not explain its decision. Reporting from CBS News Atlanta found that the nearest alternative to the Shallowford Exchange store was 3.7 miles and about 13 minutes away, which is a meaningful change for shoppers who walked or used a short drive.
Where Shoppers Can Go
For the West Palm Beach Southdale store, Publix is directing customers to several nearby locations while the rebuild takes place. Those include the Village Commons store on Village Boulevard, about 5.1 miles away, the Crosstown Plaza store on North Military Trail, about 6.2 miles away, and the Greenwood Shopping Centre location in Palm Springs, about 4.1 miles away, according to WPTV’s reporting.
For the St. Petersburg Eagles Park shoppers, the replacement store at 6605 38th Ave opened five days after the old store closed. It includes a pharmacy, a liquor store, and curbside pickup and delivery options.
For Atlanta-area shoppers, reporting from the region says the closed stores have not been replaced. Check the Publix store locator for the nearest open location and its hours.
Is Publix Retreating?
The closures do not, on their own, indicate a broad exit. Publix’s 2025 activity included 52 openings, 13 of them replacements, 89 remodels, and 10 closures. Six of the 2025 closures were scheduled for on-site replacement.
The company’s 2026 spending points in the same direction. Capital spending in the first quarter reached $674 million, up from $465 million a year earlier. Publix plans roughly $2.4 billion in total spending for 2026.
Financial results show the strain. Total sales rose 2% in the first quarter, but growth came almost entirely from new stores, and comparable-store sales were flat. A new store’s revenue counts as new-store growth, which can make headline sales look stronger than same-store performance.
The company operated 1,434 stores and had more than 260,000 employees as of May 2026. Publix identifies supercenters, warehouse clubs, dollar stores, and online retailers as its main competitors.
What to Do If Your Store Is Closing
Check the Publix store locator to confirm whether your store is closing, the reopening date if known, and the nearest open location. Store closures are sometimes announced with only a few weeks’ notice, so verify before planning a trip.
If your store is being rebuilt, ask whether associates have been transferred to nearby stores. Publix has said in some cases that staff will be reassigned rather than laid off, as it did for the West Palm Beach closure.
If you rely on pharmacy services, confirm the transfer process with the nearest pharmacy before the closure date. Pharmacy prescriptions can often be transferred, but timing and eligibility depend on the store.
Future Outlook
The rebuild pattern suggests more closures and replacements over the coming year. Publix has not published a full closure schedule, so the list will keep changing. The most useful signals are the company’s quarterly SEC filings, its store locator, and local news coverage of specific sites.
Frequently Asked Questions
Is Publix closing a lot of stores in 2026?
Publix has closed several stores this year, but most closures are linked to rebuilds or replacements. The company opened seven stores and closed eight in the first quarter, with seven of the closures tied to replacement stores.
How long will a rebuilt Publix stay closed?
Publix has said rebuilds generally take a year to 18 months, and one report indicated the old store typically remains closed for 12 to 15 months. Publix often does not announce the reopening date in advance, so check the store locator for updates.
Why did Publix close the Atlanta stores?
Publix has not publicly explained the closures of its Atlantic Station and Shallowford Exchange stores. The company said it closes stores that do not meet performance expectations, but it has not given specific reasons for these locations.
Where can I shop if my Publix is closing?
Check the Publix store locator for the nearest open location. For the West Palm Beach Southdale store, Publix has pointed customers to nearby stores at Village Commons, Crosstown Plaza, and Greenwood Shopping Centre.
Discover more from The Economy
Subscribe to get the latest posts sent to your email.

Stock Market Crash in 2026? Warning Signs, Scenarios and a Calm Investor Checklist

Peso Mexicano vs Dólar Estadounidense: A Practical USD/MXN Guide for October 2026

Is the Stock Market Open on Columbus Day 2026? NYSE, Nasdaq and Bonds Explained

Concert Ticket Prices in 2026: Dynamic Pricing, Fees and How to Buy Safely

High-Yield Savings Accounts in 2026: How to Compare APY Without Chasing a Headline

EU-China Trade Deal 2026: How Beijing and Brussels Avoided a Trade War—and Who Wins

Social Security 2027 COLA Announcement: Date, Formula and What Retirees Should Check

China’s AI Microdrama Boom: How Beijing Is Reshaping Global Media

Q3 2026 Earnings Preview: Can Record Profit Expectations Keep Wall Street’s Rally Alive?

Russia Diesel Deal 2026: Oil Prices and Inflation Risks

Fed Rates 2026: Treasury Yields, Bonds and SGOV Explained

S&P 500 Market Breadth 2026: Weak Rally or Rotation?

The AI Capex Boom: Data Centers Reshaping Growth

Palantir Stock in 2026: Extraordinary AI Growth

PSX Forecast 2026: KSE-100, IMF Reviews & Geopolitics

Middle East War Economics 2026: Oil Prices & Energy Markets

China Stocks Today: Are Big Economies in Asia Nearing a Market Bottom?

Crypto Daily Outlook: Bitcoin, Altcoins, and the Future of Decentralized Finance

Global Pension Systems Ranked: The World’s Best and Worst Retirement Frameworks

World’s Largest Economies: Ranking the Top Global Powers

Elon Musk’s Next Moves: Disrupting the 2026 Global Economy

Pakistan Economy 2026: Inside the SBP’s Balancing Act

World Bank & IMF Reports 2026: Why the “3% Growth” Consensus Is Actually a Debate

GasBuddy Market Insights: How Crude Price Shifts Impact Local Fuel Cost Averages

Crude Oil & Petroleum Market Analysis: OPEC+ Decisions and Price Forecasts

Global Equity Market Divergence: US Tech vs. European Dividend Stocks vs. Asian Growth

IMF & World Bank Global Economic Outlook: Growth Forecasts Across Europe and Asia

Silver Price Today: Why the Xi-Trump AI Standoff Is Fueling a Safe-Haven Rally
-

 Markets & Finance9 months ago
Top 15 Stocks for Investment in 2026 in PSX: Your Complete Guide to Pakistan’s Best Investment Opportunities
-

 Analysis8 months ago
Johor’s Investment Boom: The Hidden Costs Behind Malaysia’s Most Ambitious Economic Surge
-

 Analysis8 months ago
Top 10 Stocks for Investment in PSX for Quick Returns in 2026
-

 Banks9 months ago
Best Investments in Pakistan 2026: Top 10 Low-Price Shares and Long-Term Picks for the PSX
-

 Analysis8 months ago
Brazil’s Rare Earth Race: US, EU, and China Compete for Critical Minerals as Tensions Rise
-

 Investment9 months ago
Top 10 Mutual Fund Managers in Pakistan for Investment in 2026: A Comprehensive Guide for Optimal Returns
-

 Global Economy10 months ago
15 Most Lucrative Sectors for Investment in Pakistan: A 2025 Data-Driven Analysis
-

 Global Economy10 months ago
Pakistan’s Export Goldmine: 10 Game-Changing Markets Where Pakistani Businesses Are Winning Big in 2025