
Analysis
The Resilient Periphery: What the Singapore-New Zealand Supply Pact Means for Global Trade

In the grand theater of global geopolitics, it is easy to fixate exclusively on the tectonic friction between superpowers. We monitor the escalating US-China tech rivalries, parse the rhetoric of calibrated economic coercion, and watch with bated breath as vital maritime arteries choke under geopolitical strain. The ongoing maritime disruptions in the Strait of Hormuz, which have sent cascading shockwaves through global energy routes and downstream petrochemical derivatives, are a stark reminder of our collective fragility.
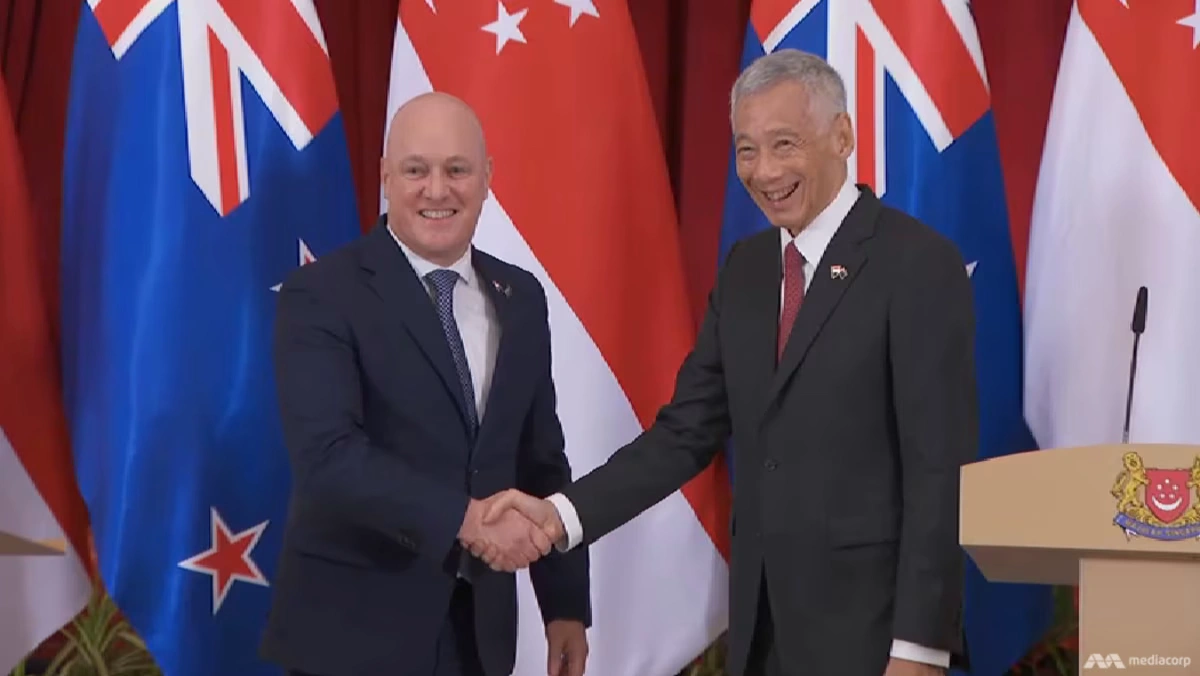
Yet, while the world’s heavyweights engage in a costly zero-sum game of tariffs and technological containment, a far quieter, vastly more pragmatic revolution is taking place on the periphery. On May 4, 2026, within the air-conditioned calm of a Singapore leadership forum, Singapore Prime Minister Lawrence Wong and New Zealand Prime Minister Christopher Luxon signed a document that, in my view, represents the future of global commerce.
The Agreement on Trade in Essential Supplies (AOTES) is the world’s first legally binding bilateral supply chain resilience pact. In an era defined by weaponized interdependence—where countries routinely hoard vaccines, ban semiconductor exports, and weaponize grain shipments—this agreement is a radical act of mutual trust. It offers a blueprint for how open, trade-dependent economies can pivot from the vulnerabilities of “just-in-time” supply chains to the security of trusted, “just-in-case” networks.
The Anatomy of the AOTES: Institutionalizing Trust
To appreciate the gravity of the AOTES, we must first understand the default reflex of the modern nation-state during a crisis: protectionism. When global supply chains buckle, the immediate political impulse is to shutter borders and halt exports to satisfy domestic anxieties. We saw this during the darkest days of the COVID-19 pandemic, and we are witnessing it again as global food and fuel prices oscillate wildly due to Middle Eastern conflicts.
The AOTES essentially outlaws this panic-induced protectionism between Singapore and New Zealand. As detailed by Singapore’s Ministry of Trade and Industry (MTI), both governments have legally committed not to impose unnecessary export restrictions on a predefined list of critical goods. This is not a vague memorandum of understanding; it is a binding framework integrated into their existing Closer Economic Partnership (ANZSCEP). The list of protected goods is comprehensive, encompassing food, fuel, healthcare products, chemicals, and construction materials.
“We will keep essential goods flowing… We will not shut each other out,” Prime Minister Wong stated with characteristic pragmatism during the signing. “In difficult times, every country will be tempted to look inward. But when that happens, supply chains break down and everyone ends up worse off.”
It takes profound confidence to codify such a promise. If a severe global fuel shortage occurs, Singapore’s domestic populace will undoubtedly demand that local refineries prioritize local pumps. By signing the AOTES, Singapore is tying its own hands to ensure New Zealand is not left stranded. Conversely, New Zealand is guaranteeing that, should a regional crisis sever international food networks, its agricultural bounty will continue to sustain Singaporeans. This is not mere diplomacy; it is the institutionalization of survival.
The Beautiful Symmetry of Food and Fuel
The Singapore-New Zealand relationship is uniquely positioned for this kind of pact because of a striking macroeconomic symmetry. They are two highly developed, profoundly open economies situated at opposite ends of the Indo-Pacific, each possessing exactly what the other lacks.
Consider the energy-agriculture nexus. As Prime Minister Luxon highlighted during the inaugural Annual Leaders’ Meeting, roughly one-third of New Zealand’s fuel is refined in Singapore. The diesel that flows from the refineries of Jurong Island directly underpins the vast farming and freight logistics networks across the New Zealand archipelago. Without Singaporean fuel, New Zealand’s agricultural engine grinds to a halt.
Conversely, Singapore imports over 90 percent of its nutritional needs. The city-state is a financial and technological powerhouse but remains existentially vulnerable to global food shocks. New Zealand, a global heavyweight in agricultural exports, serves as a vital guarantor of Singapore’s food security. Under AOTES, the New Zealand food that Singapore requires to feed its population is harvested and transported using the very diesel Singapore refined and shipped southward.
This reciprocal machinery is the antithesis of the broad, vulnerable, multi-node supply chains that defined globalization in the 2010s. It signals a shift away from efficiency at all costs, moving toward dedicated bilateral corridors that prioritize resilience. If the closure of the Strait of Hormuz limits flows to the broader region, as Prime Minister Wong starkly warned, this Singapore-New Zealand artery is designed to bypass the global arterial blockage.
Small States, Big Ideas: Navigating Geopolitical Fragmentation
The broader significance of the May 4 signing cannot be understood without looking at the Comprehensive Strategic Partnership (CSP) elevated between the two nations in October 2025. The CSP upgraded ties across six pillars, including defense, climate change, and science and technology, essentially aligning the strategic posture of two middle powers operating in an increasingly multipolar and fractured Indo-Pacific.
Both nations are acutely aware of the dangers posed by superpower decoupling. For Washington and Beijing, the restructuring of global trade is viewed through the lens of national security and strategic dominance. For Wellington and Singapore, maintaining open trade lines is quite literally a matter of economic life and death. They do not have the luxury of vast domestic markets or endless natural resources to fall back on if the global trading system collapses into fragmented, protectionist blocs.
Therefore, they have historically punched above their weight in setting global trade rules. It is worth recalling that New Zealand and Singapore, along with Chile and Brunei, were the original architects of the P4 agreement in 2005. That small, seemingly niche pact eventually snowballed into the Trans-Pacific Partnership, and ultimately the CPTPP—one of the world’s most significant trade blocs.
Similarly, they pioneered the Digital Economy Partnership Agreement (DEPA) alongside Chile, setting early global rules for digital trade, cross-border data flows, and AI governance. With the AOTES, they are running the same playbook. They are establishing a high-standard, proof-of-concept framework for supply chain resilience with the explicit hope that it will attract like-minded nations.
As PM Luxon noted in his remarks, they are open to inviting other countries that can “meet the standard” and are prepared to “have each other’s backs.” In a global economy desperate for stability, this plurilateral potential is immensely valuable. It offers a blueprint for middle powers—from Canada to South Korea to Australia—to build an overlapping web of resilient trade corridors that are immune to superpower whims or regional conflicts.
The Next Frontier: AI Deployment and the Green Transition
While the AOTES addresses the immediate, physical requirements of national survival—calories and kilowatts—the deepening Singapore-New Zealand partnership is equally focused on the defining economic transformations of our era: artificial intelligence and the green economy.
In the realm of AI, both nations wisely recognize their structural limitations. Neither Singapore nor New Zealand will win the capital-intensive arms race to build the next trillion-parameter foundational model; that arena is firmly dominated by the US-China tech rivalries and Silicon Valley monoliths. However, the true economic value of the next decade will not solely reside in creating the models, but in the speed and ingenuity of their deployment.
At the Singapore-New Zealand Leadership Forum, PM Wong emphasized synergies for deploying AI in practical, economy-boosting sectors. By establishing joint frameworks for AI governance, healthcare diagnostics, advanced manufacturing, and maritime logistics, these two nations can serve as agile regulatory sandboxes. They can attract capital from global enterprises seeking stable, forward-looking jurisdictions to test and scale AI applications without the regulatory whiplash seen in larger blocs.
Parallel to this digital collaboration is an urgent push toward the green economy. Both nations face distinct challenges in achieving net-zero emissions. Singapore is land-scarce and alternative-energy disadvantaged, relying heavily on imported natural gas. New Zealand, while blessed with renewable hydropower and geothermal energy, grapples with massive agricultural emissions.
Through the elevated CSP, the two are pooling intellectual and financial capital to address these hurdles. There is significant potential for cross-pollination between their sovereign wealth funds and institutional investors—such as Temasek Holdings and the NZ Super Fund—to scale sustainable finance, develop robust carbon markets, and accelerate the commercialization of green hydrogen and sustainable aviation fuels (SAF). It is no coincidence that the CEOs of Singapore Airlines and Air New Zealand are fostering closer ties; decarbonizing long-haul aviation is an existential requirement for both geographically isolated nations.
The Realist’s Caveat: Testing the Ties
Despite the undeniable strategic elegance of the AOTES and the broader partnership, a rigorous analysis must acknowledge the implementation risks. Treaties, no matter how ironclad the legal vernacular, are only as strong as the political will sustaining them during a true crisis.
What happens if a severe geopolitical shock fundamentally severs maritime routes through the South China Sea or the Strait of Malacca, rather than just the Middle East? While the political commitment to supply one another remains, the physical logistics of moving diesel from Jurong Island to Auckland, or dairy from Waikato to Pasir Panjang, could become prohibitively dangerous or expensive. The AOTES establishes a framework for consultations and information sharing during disruptions, but it cannot magically conjure cargo ships out of thin air or guarantee their safe passage through contested waters.
Furthermore, defining what constitutes an “unnecessary” export restriction leaves a sliver of ambiguity that could be exploited under intense domestic political pressure. If domestic fuel reserves in Singapore drop to critical, emergency-service-only levels, political leaders will face an excruciating choice between international legal commitments and domestic stability.
Scaling the AOTES to include other nations also presents a diplomatic hurdle. Bilateral trust between two deeply aligned, non-threatening, complementary economies is relatively easy to foster. Expanding this to a plurilateral agreement involving larger economies with competing domestic industries will require navigating fierce lobbying and protectionist instincts.
A Blueprint for Resilient Globalization
Despite these caveats, the signing of the Agreement on Trade in Essential Supplies on May 4 is a milestone worth celebrating. It is a necessary rebuke to the prevailing narrative of global decoupling.
For the past five years, the global economic discourse has been dominated by fear: fear of dependency, fear of technological espionage, fear of supply shocks. The default policy response from major capitals has been to build higher walls, subsidize domestic industries, and retreat into economic nationalism.
Singapore and New Zealand are offering an alternative. They are proving that the antidote to fragile globalization is not isolationism, but resilient globalization. By codifying mutual reliance, integrating their technological and green ambitions, and refusing to succumb to the sirens of protectionism, they have charted a course through the geopolitical storm.
In an era where large powers are increasingly defining themselves by who they choose to exclude, this partnership between two forward-looking middle powers reminds us of the enduring, stabilizing power of choosing to include. It is a small-state masterclass with profoundly big implications, and the rest of the world would do well to take notes.
Discover more from The Economy
Subscribe to get the latest posts sent to your email.



Key Takeaways
- Rolex’s secondary market rose approximately 7.9% year-over-year as of 2026 (per WatchCharts data) — trailing Patek Philippe (+16.2%) and Tudor (+11.4%) but still outperforming Audemars Piguet (+3.4%).
- Rolex raised U.S. retail prices 4–9% in January 2026 (steel models ~5.6%, gold models ~8.7%), narrowing the historical gap between retail and pre-owned pricing.
- Not every model appreciates: steel sports references (Submariner, GMT-Master II, Daytona) have held value far better than two-tone or widely available dress references like the standard Datejust.
- The Lady-Datejust posted the sharpest 2026 gain among tracked collections — up 22.73%, from roughly $9,269 to $11,376 — driven by demand for smaller, “everyday luxury” watches.
- Gold’s rise past $2,400/oz has directly lifted the investment case for Rolex’s precious-metal references (Day-Date, Sky-Dweller, Yacht-Master).
The Model-by-Model Picture
| Category | 2026 Trend |
|---|---|
| Lady-Datejust | +22.73% (strongest performer among tracked collections) |
| Steel sports models (Submariner, GMT-Master II) | Held value well; corrected from 2022 peak but stabilized above retail |
| Daytona | Corrected from highs above $50,000 to the mid-$30,000s; still among the most sought-after references |
| Two-tone/widely available Datejust | Flat to negative — “holds value” is an overstatement for this category |
| Gold references (Day-Date, Sky-Dweller) | Lifted by gold’s rise above $2,400/oz |
Why the “Rolex Always Appreciates” Myth Is Fading
The pandemic-era boom pushed some references — the Daytona above all — to speculative highs disconnected from historical norms. Since the March 2022 peak, steel sports models have compressed meaningfully, and dealers who bought inventory near the top have in some cases faced 20–40% markdowns on liquidation. The lesson for 2026 buyers: Rolex as a category is not a monolith. Value retention depends heavily on specific reference, condition, and whether the piece comes with box and papers (“full set”).
What’s Actually Driving 2026 Strength
- Retail price increases raise the floor. When a new Submariner retails at $10,050 (up from $9,500), a pre-owned example at $11,000–$12,000 suddenly represents a smaller premium — narrowing the gap without secondary prices actually moving.
- Supply discipline remains Rolex’s core lever. The brand has never confirmed production numbers, and secondary-market premiums remain entirely a function of Rolex’s own manufacturing decisions — a risk factor as much as a support.
- Certified Pre-Owned rollout. Rolex’s now fully rolled-out CPO program has changed how buyers transact in the used market, adding a layer of brand-verified legitimacy that supports pricing.
The Case for Rolex as a Portfolio Diversifier
Financial advisors increasingly frame luxury watches not as a replacement for equities or bonds, but as a tangible, historically low-correlation diversifier — one that carries its own risks (illiquidity, condition-dependent pricing, no yield) but has demonstrated multi-decade resilience for specific references.
Is Rolex a good investment in 2026?
It depends heavily on the specific reference. Steel sports models like the Submariner and Daytona have held or grown in value; two-tone and widely available dress models generally have not. Overall, Rolex’s secondary market rose about 7.9% year-over-year in 2026, trailing Patek Philippe but ahead of Audemars Piguet.
Discover more from The Economy
Subscribe to get the latest posts sent to your email.

Navigating Mortgage and Loan Refinancing in a High-Yield Environment
Global public debt crossing critical thresholds has kept central bank policies volatile, resulting in fluctuating US Treasury yields throughout 2026. For homeowners and commercial property holders burdened by previous high-interest borrowing cycles, finding optimal refinance windows has become a high-stakes financial puzzle. Stalled disinflation and stubborn employment numbers mean rate cuts are incremental, requiring borrowers to act with precision.
Timing your mortgage or commercial loan refinance in this environment requires a deep understanding of yield curve movements and lender risk appetites.
Decoding 2026 Refinance Dynamics
The 10-Year Treasury Yield Benchmark
Mortgage rates continue to track closely with the 10-year US Treasury yield. When macroeconomic anxiety spikes debt issuance, yields rise, tightening consumer borrowing capacity. Savvy borrowers monitor weekly Treasury auctions to lock in rates during brief dip windows.
Hybrid ARMs and Alternative Structures
With fixed rates remaining elevated, 7/1 and 10/1 adjustable-rate mortgages (ARMs) have surged in popularity. These products offer lower initial monthly payments, giving borrowers breathing room until central bank easing cycles fully materialize.
| Loan Product | Current Rate Range | Best For | Key Risk Factor |
| 30-Year Fixed Mortgage | 6.2% – 6.8% | Long-term predictability | Higher initial monthly outlay |
| 7/1 Hybrid ARM | 5.5% – 5.9% | Short-term ownership / flipping | Rate reset risk after year 7 |
| Commercial Refinance | 7.0% – 8.2% | Corporate asset restructuring | Strict DSCR lender covenants |
Actionable Steps for Successful Refinancing
To maximize your chances of securing favorable refinance terms in a volatile market, follow a disciplined preparation strategy.
Boost Your Credit Score Immediately: Lenders in 2026 are applying stringent credit tiering; a 20-point increase can drop your APR by a crucial quarter-point.
Shop Regional Credit Unions: Smaller financial institutions often offer portfolio loans with more flexible underwriting than major national banks.
Calculate the Break-Even Point: Ensure your total closing costs are recouped through monthly savings within 24 months of closing.
“Market Strategist View: Refinancing in 2026 is an exercise in opportunistic timing. Borrowers must maintain immaculate financial profiles ready to strike the moment Treasury yields dip.”
Mastering the complexities of today’s debt environment ensures you can successfully lower your debt service costs and protect your long-term financial stability.
Discover more from The Economy
Subscribe to get the latest posts sent to your email.

The days of pulling generic auto insurance quotes based purely on your zip code and age are officially over. In 2026, insurance comparison engines are powered entirely by generative AI and real-time telematics. These platforms digest thousands of live data points—ranging from your driving smoothness via connected vehicle sensors to real-time traffic congestion patterns—to generate hyper-personalized premiums instantly.
For consumers, this evolution represents both a massive opportunity for savings and a hidden trap for penalty pricing. Understanding how AI algorithms evaluate risk is essential for anyone looking to lower their monthly auto insurance premiums.
How AI Comparison Engines Evaluate Your Risk Profile
Behavioral Telematics and Connected Cars
Modern cars stream performance data directly to insurance aggregators. Generative AI models analyze braking sharpness, acceleration curves, cornering G-forces, and phone distraction metrics. Drivers who maintain smooth, defensive habits are rewarded with dynamic rate cuts of up to 40% compared to traditional rating tiers.
Predictive Traffic and Weather Modeling
AI tools now cross-reference your daily commute route with predictive weather and accident probability models. If your standard parking location or driving corridor has a statistically higher incidence of uninsured motorist claims, your quotes will reflect that hyper-local risk assessment.
| Comparison Factor | Traditional Rating Model | 2026 Generative AI Model | Impact on Premium |
| Mileage & Usage | Annual estimated odometer reading | GPS tracking & live trip duration | High (up to 35% savings) |
| Driving Behavior | MVR driving record & accidents | Real-time braking, speed, & G-force | Critical (determines tier) |
| Vehicle Tech | Make, model, and safety rating | ADAS calibration & repair cost data | Moderate |
Strategies to Lower Your AI-Driven Insurance Quote
To outsmart the algorithm and secure the lowest possible premium in 2026, drivers must proactively manage their digital footprint on insurance platforms.
Opt-In for Telematics Trial Periods: Many insurers offer immediate 15% discounts just for installing their driving app; let it track safe habits for 30 days to lock in permanent savings.
Scrub Unverified Public Records: Ensure your motor vehicle report is free of clerical errors that AI risk models misinterpret as reckless behavior.
Compare AI Aggregators: Use platforms that integrate multi-carrier API feeds rather than single-brand comparison sites to find the best risk-adjusted rate.
“Industry Note: AI-driven pricing rewards transparency and precision. Drivers who actively manage their telematics data consistently out-save those relying on legacy quote calculators.”
Embracing AI comparison tools allows savvy policyholders to customize coverage limits precisely to their driving habits, eliminating wasted premium spend while ensuring robust protection.
Discover more from The Economy
Subscribe to get the latest posts sent to your email.

SpaceX IPO 2026: History’s Biggest Stock Debut?

Pakistan Economy 2026: Inside the SBP’s Balancing Act

Is AI a Stock Bubble in 2026? What the Data Shows

Oil Prices 2026: Inside the Hormuz Crisis That Won’t End

Gold Price 2026: Inside the Wildest Rally in Decades

Federal Reserve 2026: Inside Kevin Warsh’s First Year

Fox Corp 2026: Record Revenue, Tubi Growth & Roku Deal

Wendy’s Stock 2026: Inside the Turnaround Plan

Technology News 2026: Inside the $1.3T AI Chip Boom

UK Stocks 2026: Inside the FTSE 100’s Record Run

Asian Stock Markets 2026: Japan, China, Pakistan & More

Mortgage Rates Today 2026: Full Rate Guide & Forecast

Beyond Paper Wealth: Unpacking Donald Trump’s Multibillion-Dollar Liquidity and Legal Crisis

Bitcoin & XRP 2026: Inside Crypto’s Institutional Era

Top 30 Stocks for Investment in PSX for Massive ROI in 2026

SpaceX Starship Flight 14: First Orbital Attempt & Starlink V3 Launch Explained

AI Chip Stocks 2026: The Best Semiconductor Investments Beyond Marvell

The 2026 Crypto Regulatory Shift: What It Means for Institutional Investors

Fidelity Investments Review 2026: SPAXX Yields & Zero-Fee Funds

Oil Prices Break $100 in 2026: Middle East Conflict & Energy Markets

Tween Back-to-School Trends 2026: What’s Driving the $85B Season

AI-Powered Training: The Next Multi-Billion Dollar Ecosystem in Fitness

BRICS+ Cross-Border Payments 2026: Interoperability Explained

10-Year Treasury Yield Hits 4.80%: What It Means for Rates & Portfolios

Shein Clothes Quality & Safety in 2026: What Lab Tests Show

China’s US$10.8 Billion Trade Shortcut: Why the Pinglu Canal Matters

MRVL Earnings 2026: Why Marvell Sank Despite Beating Estimates

Leveraging Viral AI & Climate Hashtags for Brand Growth on X
-

 Markets & Finance9 months ago
Top 15 Stocks for Investment in 2026 in PSX: Your Complete Guide to Pakistan’s Best Investment Opportunities
-

 Analysis7 months ago
Johor’s Investment Boom: The Hidden Costs Behind Malaysia’s Most Ambitious Economic Surge
-

 Analysis7 months ago
Top 10 Stocks for Investment in PSX for Quick Returns in 2026
-

 Banks8 months ago
Best Investments in Pakistan 2026: Top 10 Low-Price Shares and Long-Term Picks for the PSX
-

 Analysis8 months ago
Brazil’s Rare Earth Race: US, EU, and China Compete for Critical Minerals as Tensions Rise
-

 Investment8 months ago
Top 10 Mutual Fund Managers in Pakistan for Investment in 2026: A Comprehensive Guide for Optimal Returns
-

 Global Economy9 months ago
15 Most Lucrative Sectors for Investment in Pakistan: A 2025 Data-Driven Analysis
-

 Global Economy9 months ago
Pakistan’s Export Goldmine: 10 Game-Changing Markets Where Pakistani Businesses Are Winning Big in 2025