
Growth
Singapore GDP Q2 2026: 5.7% Growth Driven by AI-Linked Semiconductor Exports

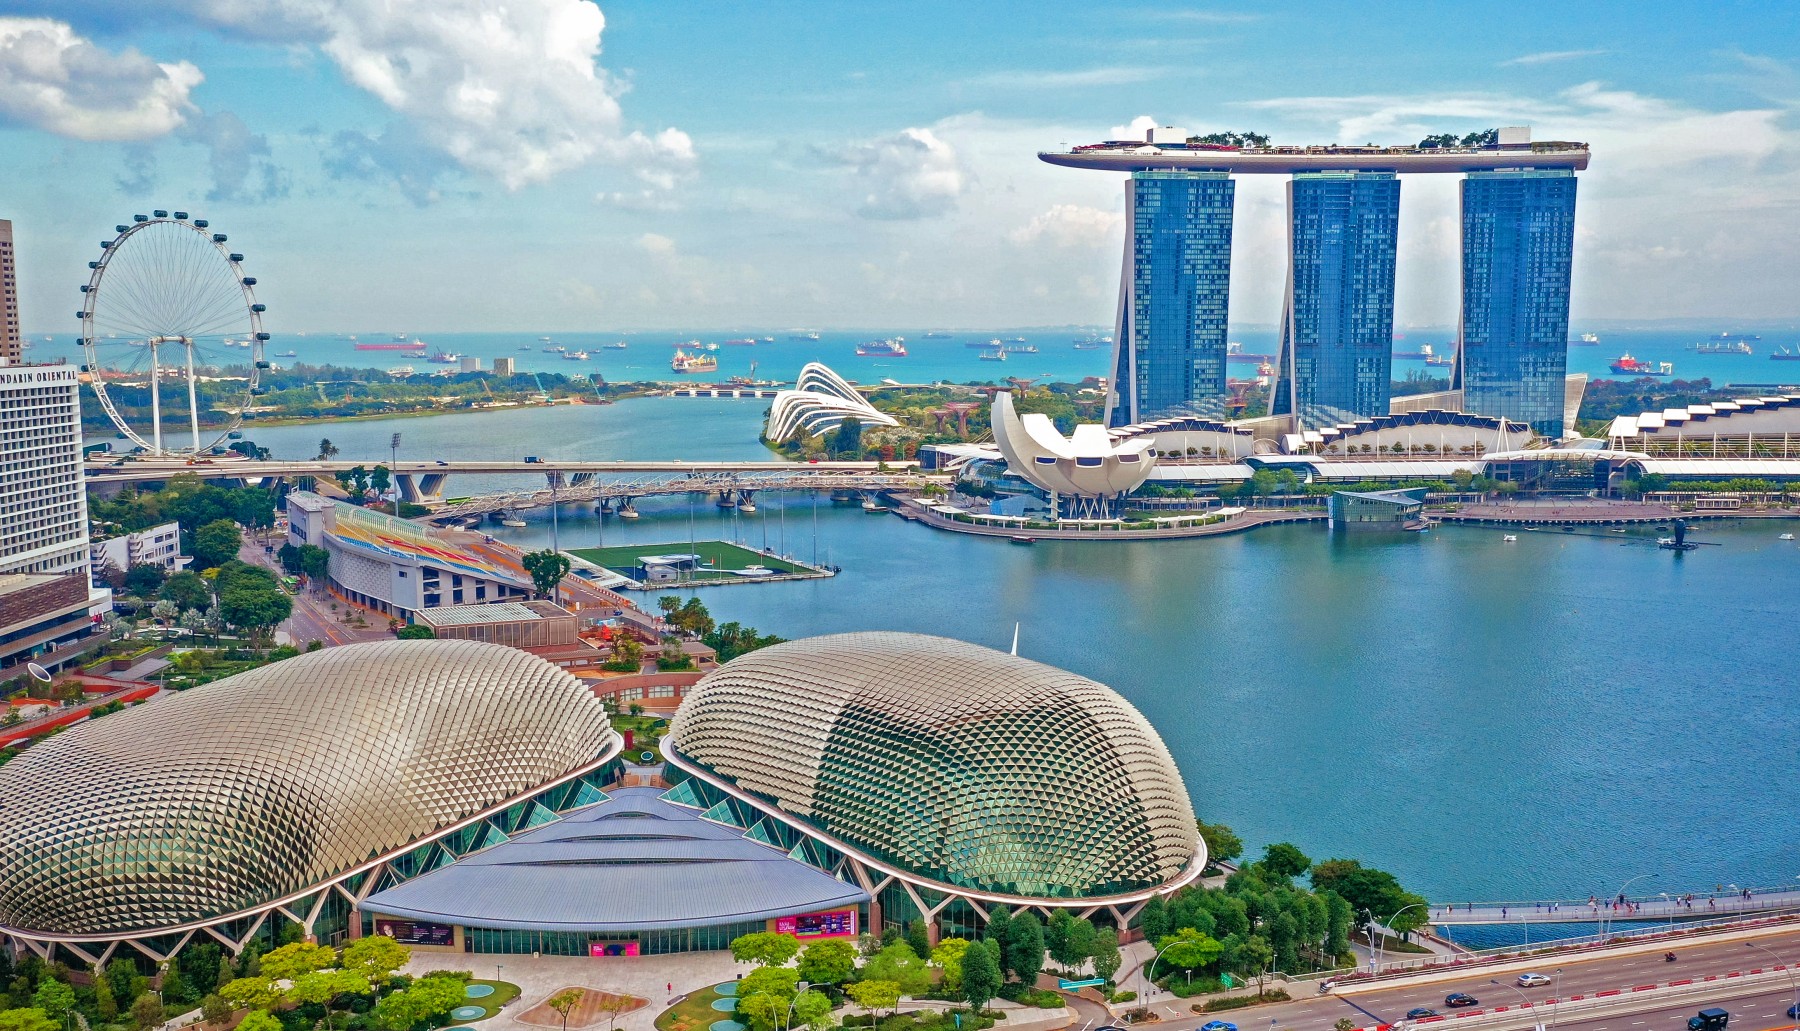
Singapore’s Ministry of Trade and Industry’s advance estimate shows the economy grew 5.7% year-on-year in the second quarter of 2026, with manufacturing output supported by electronics and precision-engineering activity tied to AI-related semiconductor demand, according to Southeast Asia Connect. That marks one of the city-state’s strongest quarterly readings in recent years and reinforces Singapore’s position as a critical node in the global AI supply chain, even as broader regional growth faces headwinds from Middle East-driven energy shocks.
Why the electronics cycle matters so much for Singapore
Singapore’s economy is disproportionately exposed to global electronics and semiconductor demand cycles relative to its size, given the concentration of chip design, testing, and precision-manufacturing activity based in the city-state. When AI infrastructure spending accelerates globally — as it has through 2026, with major technology companies collectively projected to spend hundreds of billions of dollars on AI capital expenditure — Singapore’s export-oriented manufacturing base captures an outsized share of that demand relative to peer economies.
The competitiveness warning underneath the good numbers
Even as the headline growth figure impressed, Singapore’s own policy establishment is flagging structural risk. The Singapore Institute of International Affairs (SIIA) warned this week that the city-state’s long-term economic competitiveness cannot be secured through domestic reforms alone, and that Singapore must deepen integration with its ASEAN neighbours — on everything from green energy to industrial parks — to remain resilient, according to Eco-Business. The warning came directly against the backdrop of Strait of Hormuz-driven market turmoil, illustrating how exposed even Singapore’s diversified, services-heavy economy remains to a single geopolitical chokepoint half a world away.
The regional environmental risk hiding behind the energy story
The same SIIA analysis flagged a less obvious consequence of the energy shock: some import-dependent Asian economies have turned back to coal in response to higher oil and gas prices, undermining efforts to phase down fossil fuel use, while increased biodiesel mandates could raise pressure on plantations and the risk of deforestation, per Eco-Business. The report specifically warned of a high risk of a severe transboundary haze event affecting Singapore, Malaysia, Indonesia, and Brunei this year amid a possible return of El Niño conditions — a reminder that Singapore’s economic and environmental resilience are increasingly intertwined with regional energy policy choices made well outside its borders.
What this means for investors and policymakers
The Q2 growth beat gives Singapore’s government room to maintain its current policy stance without urgent intervention, but the SIIA’s competitiveness warning suggests the current AI-driven export strength should not be read as a substitute for deeper structural integration with ASEAN. For investors, the takeaway is twofold: near-term momentum in electronics and precision engineering looks robust, but the durability of that momentum, and Singapore’s broader resilience to future energy shocks, depends on regional cooperation that is still very much a work in progress.
Key takeaways
- Singapore’s economy grew 5.7% year-on-year in Q2 2026, per MTI’s advance estimate, driven by electronics and semiconductor exports tied to AI demand.
- SIIA warns Singapore’s long-term competitiveness requires deeper ASEAN integration, not just domestic reform.
- The warning was issued amid Strait of Hormuz-driven market turmoil, highlighting Singapore’s exposure to a single distant geopolitical chokepoint.
- A possible return of El Niño raises the risk of a severe transboundary haze event affecting Singapore, Malaysia, Indonesia, and Brunei.
FAQ
How fast did Singapore’s economy grow in Q2 2026? 5.7% year-on-year, according to the Ministry of Trade and Industry’s advance estimate, driven largely by AI-related semiconductor and electronics exports.
What risks does Singapore face despite strong GDP growth? Analysts warn its long-term competitiveness depends on deeper ASEAN integration, and its economy remains exposed to external shocks like the Strait of Hormuz disruption and potential regional haze events.
Discover more from The Economy
Subscribe to get the latest posts sent to your email.


Opinion
OPINION:Breaking the 3.5% Growth Trap: How Pakistan Can Build a High-Productivity Export Economy
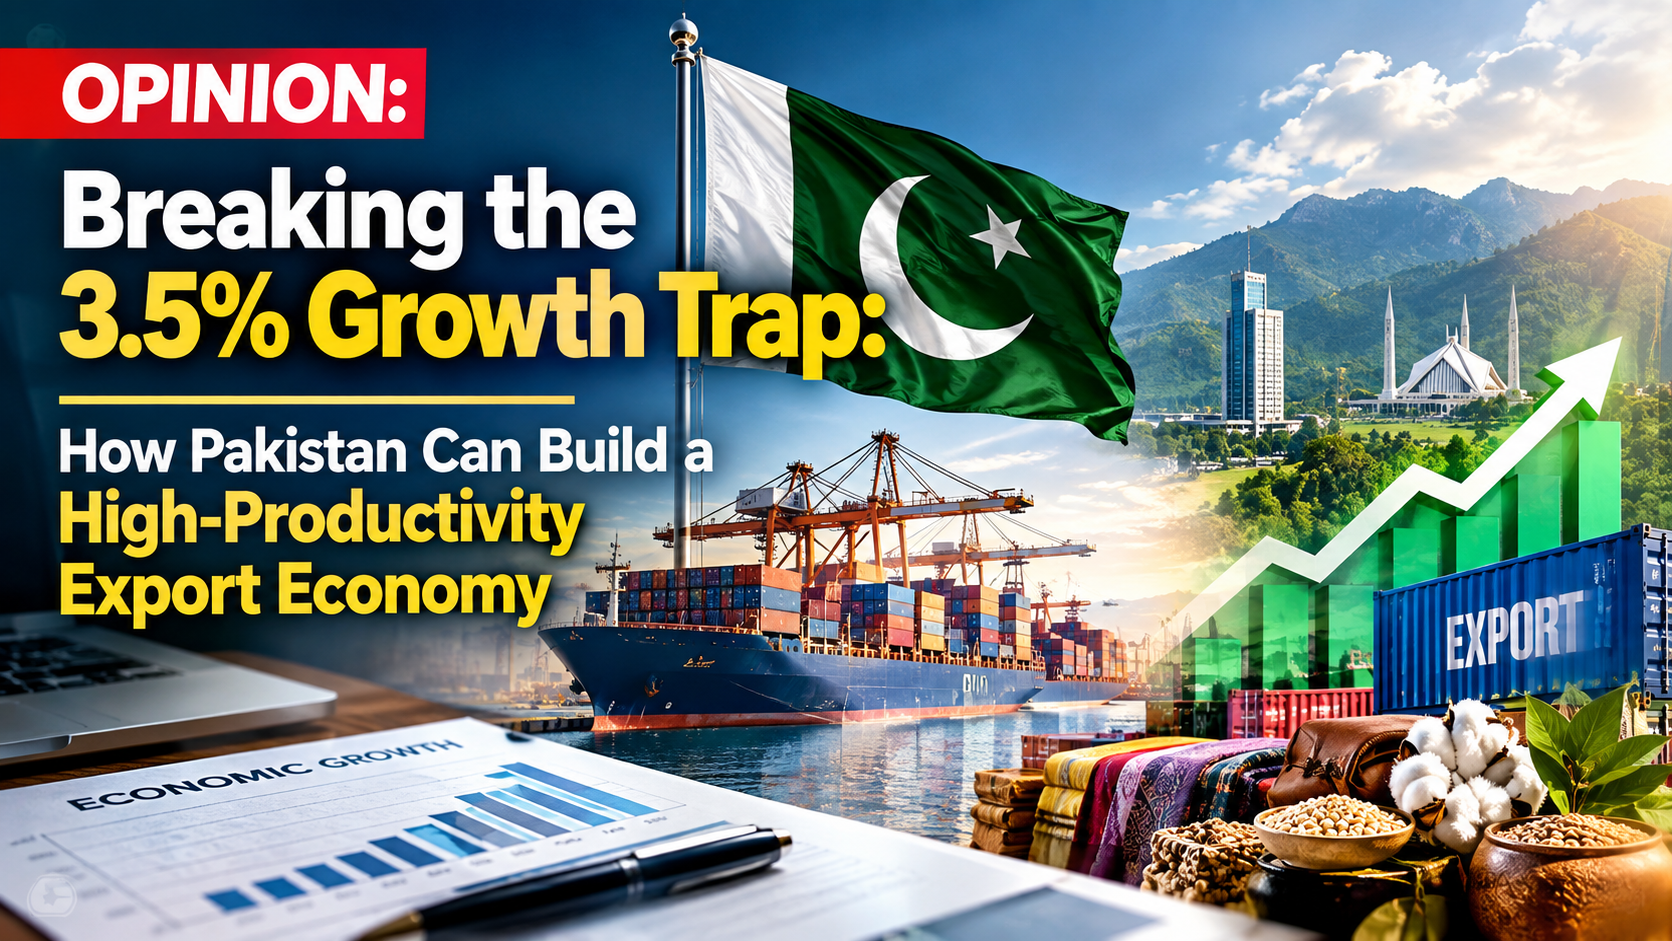
Over the last two centuries, global economic transformations have repeatedly demonstrated that escaping poverty requires moving labor from low-productivity agriculture to high-value industrial and technological sectors. While Western nations achieved this transition over centuries, East Asian economies—Japan, South Korea, Taiwan, and China—compressed the process into a few decades by sustaining growth rates near or above 8% per year.
Pakistan remains caught in a boom-and-bust stabilization cycle. While short-term fiscal adjustments under international programs stabilize reserves, real GDP growth continues to hover around 3.5%—a rate barely sufficient to match population growth and capital depreciation. Escaping this trap requires addressing the fundamental structural bottlenecks that constrain national productivity.
1. The Growth Divergence: Boom-and-Bust vs. Export-Led Industrialization
Pakistan’s growth model historically relies on domestic consumption driven by foreign remittances, debt-financed public spending, and import surges. Whenever domestic growth approaches 5%, import demand exhausts foreign exchange reserves, forcing monetary tightening, currency devaluation, and emergency fiscal consolidation.
In contrast, East Asian developmental models aligned domestic credit and state support directly with export discipline:
- State-Directed Capital Allocation: South Korea and Japan provided cheap credit, tax concessions, and infrastructure support exclusively to firms that achieved strict international export targets.
- Protection Tied to Performance: Domestic industrial protection was temporary and conditional on gaining global market share, preventing permanent reliance on state subsidies.
- High Savings and Investment: East Asian economies consistently maintained gross fixed capital formation above 30% of GDP, whereas Pakistan’s investment-to-GDP ratio routinely hovers below 15%.
2. The Three Structural Bottlenecks Holding Back Growth
I. The Economic Complexity Deficit
According to data from the Harvard Growth Lab’s Atlas of Economic Complexity, Pakistan ranks 89th globally in economic complexity. Its export basket remains concentrated in low-complexity goods—primarily basic textiles and raw agricultural commodities—which face volatile global prices and low income elasticity. Without expanding into medium- and high-tech manufacturing (such as electronics, auto components, and specialty chemicals), export revenues cannot cover the capital goods imports needed for sustained growth.
                     PAKISTAN'S STRUCTURAL GROWTH BARRIER

   +-------------------------------------------------------------------+
   |                 Low Industrial & Export Complexity                |
   |              (Textiles & Agriculture Dominate ~70%)               |
   +---------------------------------+---------------------------------+
                                     |
                                     v
   +-------------------------------------------------------------------+
   |                 Rapid Consumption-Driven Growth                   |
   |                     (Reaches ~4.5% - 5.0% GDP)                    |
   +---------------------------------+---------------------------------+
                                     |
                                     v
   +-------------------------------------------------------------------+
   |               Import Surge & Trade Deficit Spikes                 |
   |             (Foreign Exchange Reserves Depleted)                  |
   +---------------------------------+---------------------------------+
                                     |
                                     v
   +-------------------------------------------------------------------+
   |              Stabilization & Demand Contraction                  |
   |           (Higher Rates, Import Restrictions, Slow Growth)        |
   +-------------------------------------------------------------------+
II. Fiscal Crowding-Out and Energy Sector Inefficiencies
Data from the State Bank of Pakistan shows that public sector borrowing consumes the vast majority of commercial bank credit. This debt crowding-out deprives private enterprises of affordable long-term capital for industrial upgrades. Furthermore, structural power tariffs—driven by unaddressed circular debt, capacity payments, and transmission losses—render local manufacturers uncompetitive against regional peers in Vietnam, Bangladesh, and India.
“Escaping the 3.5% growth trap requires shifting resources from rent-seeking sectors into productive, export-oriented manufacturing.”
III. Human Capital & Agricultural Productivity Deficits
Recent economic analyses published in the World Bank Pakistan Development Update emphasize that low agricultural yield per hectare keeps a large share of the labor force tied to low-productivity farming. Stagnant agricultural yields limit raw material supply for processing industries and force the country to import essential food commodities during demand spikes.
3. A Four-Pillar Framework for Sustainable 7%+ Growth
To move beyond perpetual debt-fueled stabilization and achieve sustained double-digit growth, economic policy must focus on four structural imperatives:
| Reform Pillar | Strategic Action | Targeted Outcome |
| 1. Export Diversification | Transition subsidies from low-value textiles to high-complexity sectors (engineering, IT, specialty chemicals). Tie tax incentives to global market share gains. | Higher export complexity and reduced trade deficits. |
| 2. Energy & Fiscal Restructuring | Privatize mismanaged power distribution companies (DISCOs), eliminate cross-subsidies, and broaden the direct tax base to broaden credit for the private sector. | Lower industrial energy costs and increased private sector credit. |
| 3. Agricultural Modernization | Adopt high-yield seed technologies, corporate farming frameworks, and efficient drip irrigation systems to boost yield per acre. | Higher farm incomes, food security, and agricultural export surpluses. |
| 4. Institutional & Investment Reform | Create long-term policy predictability through legislative guarantees for foreign and domestic direct investment, structured via international standards like the International Monetary Fund (IMF) reform frameworks. | Increased Foreign Direct Investment (FDI) and gross capital formation. |
The Path Forward
Macroeconomic stabilization is a necessary condition for survival, but it is not a growth strategy. Without shifting resources from rent-seeking sectors into productive, export-oriented manufacturing, Pakistan will remain caught in its historical boom-and-bust cycle. Sustained, inclusive growth requires aligning state policy with market-driven export incentives, reforming the energy and tax structures, and modernizing the country’s economic foundation.
Discover more from The Economy
Subscribe to get the latest posts sent to your email.

S&P 500 at 7,620, FTSE at 10,698, Nikkei at 64,136. Compare US tech, European dividends and Asian growth as three central banks split on rates.
Executive Summary / Key Takeaways
- The three major regions are now priced off three different monetary regimes: the Fed hiking into strength, the ECB hiking into weakness, and the Bank of Japan normalising from near zero.
- On the day of the Fed’s hike, the Dow fell more than 600 points while the Nasdaq finished close to flat — a clean demonstration that “US equities” is no longer a single exposure.
- European indices held up: the FTSE 100 sat at 10,697.57 (+0.44%) while the DAX at 25,440.81 and Euro Stoxx 50 at 6,260.38 slipped.
- Japan outperformed on currency mechanics, with the Nikkei at 64,136 and the Topix at 4,094.
- Yardeni Research cut its year-end S&P 500 target to 7,900 from 8,400, citing yield pressure from rising energy prices.
Regional equity allocation has spent a decade being a low-conviction decision. Global indices moved together, US technology led, and everything else was a funding source. September 2026 broke that pattern within a single trading week.
The trigger was monetary divergence. The Federal Reserve raised rates to 3.75%–4.00% on 16 September. The ECB had already lifted its deposit rate to 2.5% on 10 September. The Bank of England held at 3.75% on a 6-3 split on 17 September, and the Bank of Japan is expected to hike on 18 September.
Four decisions, four different directions of travel, four different equity responses. That is the environment retail investors and portfolio managers now have to allocate into.
2. Core Market Analysis
2.1 The comparison matrix
| Region / Index | Level | Move | Monetary regime | Primary source |
|---|---|---|---|---|
| S&P 500 (US) | 7,619.98 | -0.48% | Fed tightening; ≥1 more hike signalled | Yahoo Finance |
| Nasdaq Composite (US) | 26,186.41 | -0.56% | Duration-sensitive; held up on Fed day | Yahoo Finance |
| Dow Jones (US) | 52,421.20 | -0.29% | Fell 600+ pts on the hike itself | Yahoo Finance |
| FTSE 100 (UK) | 10,697.57 | +0.44% | BoE on hold at 3.75% | Yahoo Finance |
| DAX (Germany) | 25,440.81 | -0.50% | ECB at 2.5% deposit rate | Yahoo Finance |
| CAC 40 (France) | 8,117.78 | -0.76% | ECB at 2.5% deposit rate | Yahoo Finance |
| Euro Stoxx 50 | 6,260.38 | -1.02% | Weakest major European print | Yahoo Finance |
| Nikkei 225 (Japan) | 64,136 | +0.33% | BoJ normalising; weak yen tailwind | Trading Economics |
| Hang Seng (HK) | 24,713 | +0.2% | Pegged; HKMA hiked to 4.25% | Trading Economics |
| VIX | 17.10 | +7.95% | Volatility bid but not stressed | Yahoo Finance |
2.2 US: the index is not the market
The single most revealing datapoint of the week was the internal dispersion on Fed day. Stocks turned lower during Warsh’s press conference as markets read his remarks as hawkish, with the Dow leading losses down more than 700 points at one stage — over 1.6% — while the S&P 500 declined 0.4% and the Nasdaq slid just below flat, Yahoo Finance reported.
Conventional rate logic says long-duration growth should suffer most when yields rise. It did not. The cyclical, energy-exposed and rate-sensitive parts of the market took the damage instead: J.B. Hunt Transport fell 12.64% after warning on earnings and rising operating costs, Diamondback Energy dropped 8% amid concerns over inflation, rising Treasury yields and crude-market geopolitical risk, and APA Corp fell 5.2%, according to TheStreet’s market coverage. Optical and photonics names rebounded, with Coherent and Lumentum each up around 6%.
The forward view has been trimmed. Yardeni Research cut its year-end S&P 500 target to 7,900 from 8,400 — implying 4.1% upside from Tuesday’s close of 7,585.73 rather than the 11% its previous estimate implied — citing higher Treasury yields due to rising energy prices and increased downturn risk over the next three to six months, CNBC reported.
2.3 Europe: the dividend case
European equities are not outperforming on growth. Euro-area output is projected around 1.3% for 2026 by the IMF, with the region benefiting less than others from the technology-driven investment boost and lingering energy-price effects still dragging on manufacturing.
They are outperforming, where they are, on payout and valuation. With the ECB deposit rate at 2.5% — the loosest of the major blocs — the yield competition from cash and short-dated bonds is materially weaker in Europe than in the US, where the funds rate is now 3.75%–4.00% and the 10-year has topped 5%. That relative-yield arithmetic is the structural argument for European income equity in this cycle, and it holds regardless of European growth being mediocre.
The UK sits awkwardly between the two. The FTSE’s commodity and energy weighting makes it a partial beneficiary of the same oil shock hurting importers elsewhere, which explains its positive print against a broadly weaker European tape.
2.4 Asia: growth with a currency asterisk
Japan’s advance came from yen weakness after the Fed decision, which improved the earnings outlook for export-focused industries, Trading Economics noted. Hong Kong’s caution came from the HKMA following the Fed with a hike to 4.25%, pressuring property.
The regional growth case is real — East Asia and Pacific is projected at 4.2% for 2026 and South Asia at 6.3% by the World Bank — but a meaningful share of recent Japanese equity return has been a currency effect that BoJ normalisation will erode.
3. Structural Drivers and Competitor Gaps
The gap in most comparative coverage is treating this as a regional rotation call. It is better understood as three separate factor exposures that happen to have geographic labels:
- US large-cap technology is a duration and AI-capex exposure. It held up on Fed day because the AI investment cycle is currently a stronger driver than the discount rate. Both the IMF and World Bank cite broader AI adoption as the principal upside risk to global growth. If that capex cycle cools, the rate sensitivity reasserts itself immediately.
- European income equity is a relative-yield exposure. Its attractiveness is a function of the ECB-Fed policy gap, not of European fundamentals. Narrow the gap and the case weakens.
- Asian growth equity is partly a currency exposure. Particularly in Japan, where the return decomposition between earnings and FX is doing more work than most allocators acknowledge.
Correctly labelled, these are not substitutes for one another. The diversification benefit of holding all three is higher in 2026 than at any point in the past decade — which is the practical conclusion most aggregator coverage fails to reach.
4. Key Implications for Stakeholders
Retail investors. A global index fund currently buys you a heavy weighting to a single factor: US technology and its AI capital-expenditure cycle. If that is the intended exposure, fine. If not, deliberate regional allocation is required to get it.
Portfolio managers. Volatility is bid but not stressed, with the VIX at 17.10 — an unusually calm reading given four central bank decisions in eight days and crude above $100. That combination favours adding hedges while they remain inexpensive rather than after a repricing.
Income investors. The yield hurdle is regional now. In the US, equity income competes against a 10-year above 5%. In the euro area, it competes against a 2.5% deposit rate. The same dividend yield is a materially better proposition in one market than the other.
Risk teams. Cross-regional correlation assumptions built on the 2015–2021 regime are stale. Three distinct monetary cycles produce genuinely differentiated drawdown paths.
5. Frequently Asked Questions
Q1: Why did the Nasdaq hold up while the Dow fell after the Fed hike?
The damage concentrated in cyclical, transport and energy-exposed names rather than long-duration technology. Investors are currently treating the AI capital-expenditure cycle as a stronger earnings driver than the discount rate is a valuation headwind.
Q2: Are European dividend stocks more attractive than US equities now?
On relative yield, arguably. The ECB deposit rate is 2.5% against a US funds rate of 3.75%–4.00% and a 10-year Treasury above 5%, so European equity income faces far weaker competition from cash and bonds. European growth, however, remains around 1.3%.
Q3: What is the current S&P 500 level and forecast?
The S&P 500 was at 7,619.98. Yardeni Research cut its year-end target to 7,900 from 8,400, implying roughly 4% upside, citing higher Treasury yields driven by rising energy prices.
Q4: Which region offers the best equity growth in 2026?
Asia on headline growth — East Asia and Pacific at 4.2% and South Asia at 6.3% per World Bank forecasts. But a meaningful share of recent Japanese equity returns reflects yen weakness rather than earnings, and Bank of Japan normalisation erodes that tailwind.
Discover more from The Economy
Subscribe to get the latest posts sent to your email.
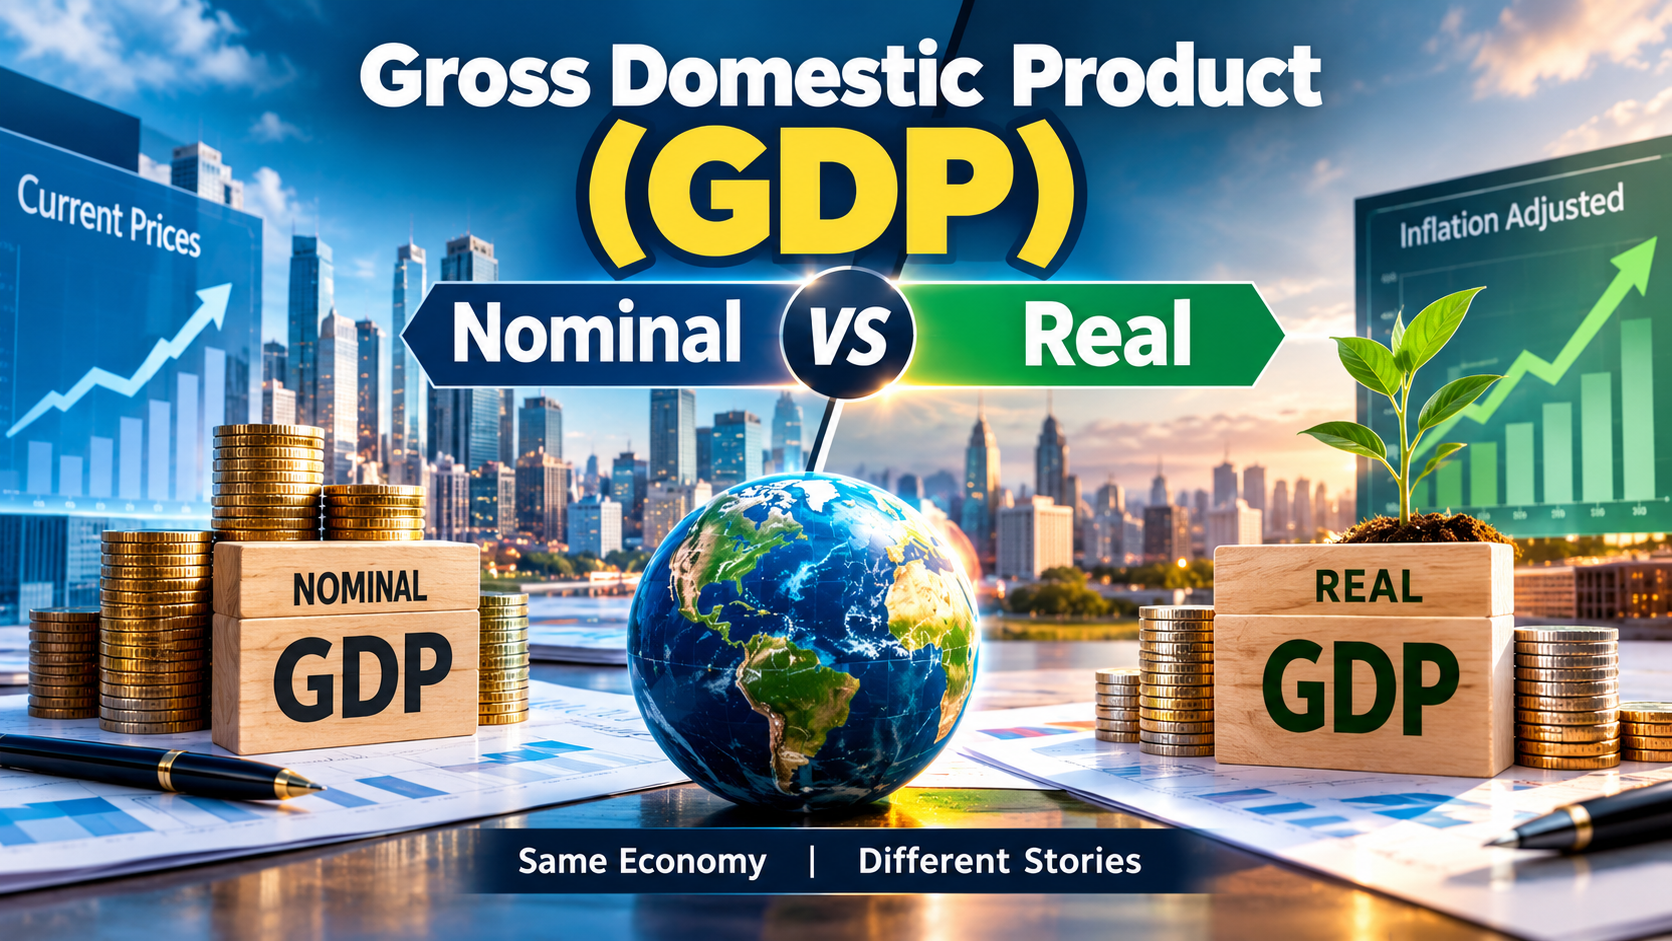
The Ultimate Measure of Economic Health and Output
Gross Domestic Product (GDP) is the most widely recognized macroeconomic indicator in the world. It represents the total monetary or market value of all final goods and services produced within a country’s geographic borders during a specific time period (usually a quarter or a year).
For financial analysts, policymakers, and readers of Thefinance.pk, GDP acts as a comprehensive scorecard for a country’s economic health. When GDP is growing, the economy is expanding, businesses are hiring, and tax revenues are rising. When GDP contracts for two consecutive quarters, the economy is technically in a recession.
The Four Pillars of GDP
GDP is traditionally calculated using the expenditure approach, summarized by the famous macroeconomic equation: GDP = C + I + G + (X – M)
- Consumption (C): This is the largest component of GDP. It includes all private consumption expenditures by households on durable goods (cars, appliances), non-durable goods (food, clothing), and services (haircuts, medical visits).
- Investment (I): This refers to business investments in capital. It includes the construction of new factories, the purchase of software and machinery, and changes in business inventories. (Note: This does not mean buying stocks and bonds).
- Government Spending (G): This encompasses all government consumption, investment, and expenditures. It includes infrastructure projects, military spending, and public sector salaries. It excludes transfer payments like pensions or unemployment benefits, as these do not represent new production.
- Net Exports (X – M): This is the value of a country’s total exports (X) minus its total imports (M). If a country exports more than it imports, it has a trade surplus, which adds to GDP. If it imports more, it has a trade deficit, which subtracts from GDP.
The Illusion of Nominal GDP
Nominal GDP is the raw measurement of economic output using current market prices. It does not strip out the effects of inflation or deflation.
This creates a significant analytical problem. Suppose a country produces 1,000 cars in Year 1 at $10,000 each. The Nominal GDP is $10,000,000. In Year 2, the country produces the exact same 1,000 cars, but due to inflation, the price of each car has risen to $12,000. The Nominal GDP in Year 2 is now $12,000,000.
Looking solely at Nominal GDP, the economy appears to have grown by 20%. However, the actual physical output—the number of cars produced—has not changed at all. The growth is entirely an illusion created by inflation.
The Truth of Real GDP
To get an accurate picture of economic growth, economists use Real GDP. Real GDP adjusts the nominal data for inflation, providing a metric that reflects the true volume of production.
To calculate Real GDP, statisticians use a tool called the GDP Deflator, which tracks the price changes of all domestically produced goods and services. By applying the GDP deflator, the output of the current year is evaluated using the constant prices of a designated “base year.”
If Real GDP goes up, it means the country is genuinely producing more goods and services, creating a higher standard of living. For sites like Economy.com.pk, emphasizing Real GDP is critical. In a high-inflation environment, nominal figures can suggest an economic boom, while Real GDP might reveal an economy that is actually stagnant or shrinking.
GDP Limitations: What It Doesn’t Measure
While GDP is the gold standard for measuring economic size, it is not a perfect indicator of societal well-being. Modern economists frequently point out its blind spots:
- The Informal Economy: GDP fails to capture off-the-books cash transactions, black markets, and undocumented labor. In developing nations, the informal economy can account for a massive percentage of actual economic activity that goes unrecorded.
- Unpaid Labor: Household chores, childcare, and volunteer work contribute immensely to society but have no market price, so they are excluded from GDP.
- Environmental Degradation: A country could achieve massive GDP growth by aggressively clear-cutting its forests and polluting its rivers. GDP counts the income from the timber but does not subtract the loss of natural capital or the future costs of environmental damage.
- Income Inequality: A rising GDP does not mean the wealth is distributed evenly. A country’s GDP can surge while the majority of its citizens experience stagnant wages and declining living standards.
Key Takeaways:
- GDP measures the total output of a country based on consumption, investment, government spending, and net exports.
- Nominal GDP uses current prices and can be artificially inflated by rising costs.
- Real GDP adjusts for inflation, providing the most accurate picture of actual economic growth.
- Despite its usefulness, GDP does not measure income distribution, environmental sustainability, or the informal economy.
Authoritative Sources & Further Reading:
- International Monetary Fund (IMF): World Economic Outlook and GDP Data
- World Bank: Gross Domestic Product Analytics
Discover more from The Economy
Subscribe to get the latest posts sent to your email.

Asian Stock Markets 2026: Japan, China, Pakistan & More

Mortgage Rates Today 2026: Full Rate Guide & Forecast

Beyond Paper Wealth: Unpacking Donald Trump’s Multibillion-Dollar Liquidity and Legal Crisis

Bitcoin & XRP 2026: Inside Crypto’s Institutional Era

Global Economy 2026: IMF Growth, AI Stocks & Market Risk

China’s Local Debt Race Against Time: Why Economists Demand Central Action Before the Deflation Window Closes

Money News: How to Protect Your Portfolio From Global Inflation

World Bank Projections: Emerging vs. Big Economies of Asia

IMF Reports 2026: What the Latest Data Means for the Global Economy

Singapore Stocks Outlook: A Safe Haven in the Asian Market?

China Stocks vs. Japan Stocks: Where Should You Invest in Late 2026?

VIX Index Explained: How to Trade Wall Street’s Fear Gauge Today

Commercial vs Residential Real Estate: Which Wins in 2026?

Presidential Stock Market Performance: How Trump’s Second Term Compares to History

Top 30 Stocks for Investment in PSX for Massive ROI in 2026

SpaceX Starship Flight 14: First Orbital Attempt & Starlink V3 Launch Explained

AI Chip Stocks 2026: The Best Semiconductor Investments Beyond Marvell

The 2026 Crypto Regulatory Shift: What It Means for Institutional Investors

Fidelity Investments Review 2026: SPAXX Yields & Zero-Fee Funds

Oil Prices Break $100 in 2026: Middle East Conflict & Energy Markets

Tween Back-to-School Trends 2026: What’s Driving the $85B Season

AI-Powered Training: The Next Multi-Billion Dollar Ecosystem in Fitness

BRICS+ Cross-Border Payments 2026: Interoperability Explained

10-Year Treasury Yield Hits 4.80%: What It Means for Rates & Portfolios

Shein Clothes Quality & Safety in 2026: What Lab Tests Show

MRVL Earnings 2026: Why Marvell Sank Despite Beating Estimates

China’s US$10.8 Billion Trade Shortcut: Why the Pinglu Canal Matters

Leveraging Viral AI & Climate Hashtags for Brand Growth on X
-

 Markets & Finance9 months ago
Top 15 Stocks for Investment in 2026 in PSX: Your Complete Guide to Pakistan’s Best Investment Opportunities
-

 Analysis7 months ago
Johor’s Investment Boom: The Hidden Costs Behind Malaysia’s Most Ambitious Economic Surge
-

 Analysis7 months ago
Top 10 Stocks for Investment in PSX for Quick Returns in 2026
-

 Analysis8 months ago
Brazil’s Rare Earth Race: US, EU, and China Compete for Critical Minerals as Tensions Rise
-

 Banks8 months ago
Best Investments in Pakistan 2026: Top 10 Low-Price Shares and Long-Term Picks for the PSX
-

 Investment8 months ago
Top 10 Mutual Fund Managers in Pakistan for Investment in 2026: A Comprehensive Guide for Optimal Returns
-

 Global Economy9 months ago
15 Most Lucrative Sectors for Investment in Pakistan: A 2025 Data-Driven Analysis
-

 Global Economy9 months ago
Pakistan’s Export Goldmine: 10 Game-Changing Markets Where Pakistani Businesses Are Winning Big in 2025