
AI
Citi S&P 500 target 8100: AI earnings surge


Scott Chronert, Citi’s US equity strategist, doesn’t mince numbers. On Tuesday, he pushed his year-end S&P 500 target to 8,100 — a 10.3 per cent lift from his prior 7,500 forecast. The driver? What he calls an “episodic earnings surge” tied directly to the AI boom. Not a steady climb, but a series of explosive profit moments that keep rewriting the index’s ceiling. The market’s reaction was muted but telling: the S&P closed up just 0.6 per cent, as if investors were already pricing in a higher bar.
That calm belies a deeper tension. The last 18 months have seen AI-linked capital expenditure from Microsoft, Nvidia, and Amazon top $180 billion, according to Bloomberg data. Those spending sprees are now translating into bottom-line results: Q1 2025 earnings for the S&P 500 came in 9.3 per cent above consensus estimates, the biggest beat since the post-pandemic recovery of 2021. Yet the macro backdrop is hardly benign. Core PCE inflation remains stuck at 2.8 per cent, pushing the Federal Reserve’s first rate cut to September at the earliest. Citi’s target forces a question: can a single technology — and the episodic profit bursts it creates — override a central bank that is still tightening the noose?
1 — The Core Development
Citi’s new S&P 500 target of 8,100 hinges on an AI-fueled earnings surge that behaves more like a series of jumps than a smooth curve. Chronert’s note, published Tuesday, argues that the index’s forward earnings per share (EPS) will hit $265 in 2025, up from his previous $245 estimate. The revision is not across the board. It’s concentrated in the Info Tech and Communication Services sectors, where AI-related demand has pushed corporate revenue beyond all historical precedents. “We are seeing episodic earnings — three to five quarters of unusually high profit growth, followed by a digestion period,” Chronert told Reuters.
Nvidia’s latest quarter tells the story. The chipmaker reported $36.2 billion in data centre revenue, a 78 per cent year-over-year increase, and raised its forward guidance by another 9 per cent. Microsoft’s Azure cloud business grew 34 per cent, with AI services accounting for 12 percentage points of that growth. Amazon Web Services added $5.7 billion in incremental operating income, almost entirely from AI inference workloads. These aren’t one-offs; they’re the first phase of a multi-year capex cycle that Citi estimates will exceed $700 billion by 2027.
Yet the definition of “episodic” matters. Chronert is careful not to call this a bubble. He frames it as a structural shift in how earnings are generated — lumpy, unpredictable, but ultimately higher. “It’s not that every quarter will beat,” he said. “It’s that every time a new AI application scales, we get a compressed burst of profits.” That logic is what pushed the S&P 500’s forward P/E from 20.5 to 22.1 in just six weeks, a valuation expansion that historically signals either euphoria or genuine productivity gains. The BIS, in its latest annual report, warns that such compression can amplify sell-offs when the bursts subside.
2 — Analytical Layer
Why episodic earnings change the valuation game — and why the Fed is watching
Chronert’s target isn’t just a number; it’s a bet on the nature of profit growth. Traditional valuation models assume steady quarterly increases. Episodic earnings break that pattern. When profits surge for two quarters, then dip, then surge again, the annualised growth rate can look chaotic. That chaos is exactly what Citi is banking on.
Why did Citi raise its S&P 500 target?
Citi raised its S&P 500 target to 8,100 because AI-related earnings are coming in faster and larger than expected. The bank sees an “episodic earnings surge” where AI capital expenditure delivers compressed profit bursts across tech sectors, pushing forward EPS to $265 for 2025. This is not a smooth trend but a series of high-impact quarters.
That explanation, however, runs straight into a wall of Fed policy. The central bank is not forecasting an AI dividend. Its staff models treat productivity gains as spread out over 10 to 15 years, not condensed into a year of stock market outperformance. Chair Jerome Powell, in his most recent press conference, said “we are not seeing evidence of a broad-based productivity break yet.” That’s a polite way of saying the Fed still believes in mean reversion — that earnings surges will be followed by earnings misses, and that the S&P 500’s current multiple is unsustainable.
Citi counters with a different time horizon. The bank’s economists note that corporate capex on AI is now running at an annualised rate of $280 billion, a figure that exceeds the 1999–2000 internet buildout when adjusted for inflation. But unlike the dotcom era, much of this spending is going into real infrastructure — data centres, GPU clusters, specialised networking gear — that generates immediate capacity to sell AI services. In other words, the earnings are real, not speculative. The IMF’s April 2025 World Economic Outlook supports this, pointing to a 0.6 percentage point upward revision in US potential GDP growth, largely attributed to AI integration.
3 — Implications & Second-Order Effects
What 8,100 means for rates, liquidity, and the real economy
The first order of business is the ripple through interest rate expectations. When Citi lifted its target, the 10-year Treasury yield ticked up 8 basis points to 4.45 per cent. The logic: higher S&P earnings imply a stronger economy, which reduces the chance of deep Fed cuts. Futures markets now price only two 25-basis-point cuts for 2025, down from four cuts earlier this spring. That’s a direct trade-off between the AI earnings surge and monetary policy.
But the second-order effects are more interesting. Episodic earnings create a liquidity problem for pension funds and mutual funds that rely on smooth dividend streams. If profits spike and then stall, asset managers must rebalance more frequently, triggering transaction costs and potential forced selling during the “digestion” quarters. Citi’s own research shows that during the 2023–24 AI earnings bursts, funds that held high-weights in AI stocks saw 1.8 per cent per month tracking error versus benchmarks — a volatility premium that eats into returns.
The real economy also faces a lag. Companies that aren’t AI-exposed — consumer staples, utilities, industrials ex-tech — are not seeing the same earnings lift. S&P 500 earnings growth for 2025 is projected at 12 per cent for the index as a whole, but only 3 per cent for the non-tech half. That divergence is already showing up in hiring data. The US added 186,000 jobs in May, but 44 per cent of those were in tech and AI-adjacent roles, according to BLS data. The FT has reported that wage growth in the rest of the economy has slowed to 3.1 per cent, well below the Fed’s 4 per cent comfort zone. The AI boom is not lifting all boats — it’s only building a higher tide for the ones that already float.
4 — Competing Perspectives or Counterargument
The bear case: history doesn’t forgive episodic profits
Mike Wilson, Morgan Stanley’s chief equity strategist, is unconvinced. “What Citi calls episodic, I call unsustainable,” he wrote in a note last week. Wilson’s argument is straightforward: every time the S&P 500 has priced in a multi-year earnings surge based on a single technology, it has eventually corrected. The internet bubble peaked at a forward P/E of 27.5; today’s 22.1 is not far behind. He points to the fact that AI capex is already showing signs of overlap — 37 per cent of data centre capacity is now idle, per a recent McKinsey survey, a figure that was 22 per cent a year ago.
More pointedly, Wilson argues that episodes are not cycles. “An earnings surge that lasts four quarters and then vanishes leaves a valuation hangover that takes years to cure.” He cites the post-2002 recovery, where the S&P 500 took five years to reclaim its 2000 peak. The difference this time, Wilson concedes, is that AI does have tangible productivity applications — but he questions whether those will translate into sustained corporate profits as competition heats up. “Nvidia’s margins are 78 per cent. They won’t stay there,” he told Bloomberg.
The IMF, in its typically cautious language, echoes this concern. The April 2025 report notes that “productivity gains from AI may be concentrated in a small number of firms, leading to increased market concentration and potential earnings volatility.” That is a polite way of saying that the S&P 500’s climb is being driven by roughly 15 companies. When those 15 companies pause, the whole index could stall — even if the rest of the economy remains stable.
Closing
So where does that leave Chronert’s 8,100? It rests on a bet that AI’s profit cycle is not a bubble but a new rhythm — one that the market, the Fed, and the broader economy have yet to learn how to dance to. The evidence is mixed. Earnings are real, but they are lumpy. Capex is high, but so is idle capacity. Valuations are stretched, but not at bubble extremes.
What’s missing is the one variable no analyst can model: the timing of the next episodic burst. If it comes in Q3 2025, as Citi expects, 8,100 may prove conservative. If it stalls, the S&P could give back half of its 2025 gains in a single month. The only certainty is that the old rules of steady quarterly growth are dead. In their place is something messier, faster, and far less forgiving.
The machine is learning. So is the market. But they’re not on the same clock yet.
Discover more from The Economy
Subscribe to get the latest posts sent to your email.


AI
Anthropic Offers Up to $600,000 Salary for Critical IPO Role as AI Giant Prepares for Wall Street Debut

As anticipation builds around what could become one of the largest technology listings in recent history, artificial intelligence company Anthropic is offering an eye-catching base salary of up to $600,000 for a key investor relations position, underscoring how seriously the company is preparing for its expected initial public offering (IPO).
The San Francisco-based AI developer, best known for its Claude family of AI models, has posted a vacancy for a Director of Investor Relations with a base compensation ranging from $425,000 to $600,000, making it one of the most strategically important hires ahead of its anticipated public market debut. According to a report by Business Insider, the company is expected to pursue an IPO as early as fall 2026, following a surge in valuation and extraordinary revenue growth.
A Strategic Hire Ahead of a Landmark IPO
The investor relations director will be responsible for shaping Anthropic’s investment narrative, maintaining relationships with institutional investors, and helping Wall Street understand the company’s long-term strategy and financial outlook.
According to the job description, the successful candidate will:
- Develop Anthropic’s investment story for public markets.
- Serve as a primary liaison between executive leadership and investors.
- Analyze AI industry developments and communicate their financial implications.
- Support earnings communications, investor presentations, and regulatory disclosures.
- Work closely with the company’s newly appointed Head of Investor Relations.
The position reports into Kenneth Dorell, who joined Anthropic earlier this year after previously leading investor relations at Meta. His appointment reflects the company’s broader effort to build an experienced leadership team capable of navigating public market expectations.
Why Investor Relations Matters More Than Ever
While investor relations roles are common among public companies, they become especially significant during the transition from private to public ownership.
For Anthropic, the challenge extends beyond explaining quarterly financial results. The company must convince investors that its massive investments in AI research, computing infrastructure, and talent acquisition can translate into sustainable long-term growth.
Unlike many traditional software companies, Anthropic operates as a public benefit corporation, meaning it is legally committed to balancing shareholder returns with the responsible development of advanced artificial intelligence. The company’s official mission emphasizes building reliable, interpretable, and safe AI systems for the long-term benefit of society, according to the company’s website.
This dual mandate creates a unique communication challenge for investor relations executives, who must explain how commercial success aligns with responsible AI development.
AI Boom Drives Extraordinary Compensation
The offered salary highlights the increasingly fierce competition for executive talent across the AI industry.
Although a base salary of $600,000 is exceptional by conventional corporate standards, compensation at leading AI companies frequently includes stock awards, bonuses, and long-term incentives that can substantially increase total earnings.
Anthropic has become one of Silicon Valley’s fastest-growing companies, with demand for its enterprise AI products accelerating rapidly. The company’s coding assistant, Claude Code, has gained significant traction among software developers and businesses seeking AI-powered programming tools.
Recent reporting indicates that Anthropic’s annualized revenue has expanded dramatically as enterprise adoption of generative AI continues to accelerate, strengthening investor expectations ahead of a potential IPO.https://www.businessinsider.com/anthropic-ipo-hiring-investor-relations-director-2026-7
Preparing Wall Street for an Unconventional AI Company
Anthropic’s investor relations team faces a unique assignment.
Unlike mature technology companies with decades of operating history, frontier AI companies remain difficult to value because they invest billions of dollars annually in computing infrastructure, model training, and research talent while operating in a rapidly evolving competitive environment.
Potential investors will likely seek clarity on several key questions:
- Future profitability.
- Infrastructure spending.
- AI safety governance.
- Regulatory risks.
- Competitive positioning against OpenAI, Google, Meta, and xAI.
- Long-term monetization strategy.
The investor relations director will play a central role in translating these complex issues into a compelling investment thesis.
Strong Financial Momentum Strengthens IPO Expectations
Anthropic has emerged as one of the world’s most valuable privately held AI companies.
Backed by major investors including Amazon and Google, the company has attracted substantial funding over the past several years while rapidly expanding its enterprise customer base.
Its Claude models have become widely used for coding, research, enterprise automation, and business productivity, placing Anthropic among the strongest competitors to OpenAI.
The company’s remarkable financial momentum has fueled growing speculation that its IPO could become one of the defining public offerings of the AI era.
Competition for AI Talent Intensifies
The generous compensation package also reflects the broader battle for experienced executives across the artificial intelligence sector.
Companies developing frontier AI systems increasingly compete not only for elite researchers and engineers but also for specialists in finance, public markets, communications, and regulatory affairs.
As valuations continue climbing into the hundreds of billions of dollars, experienced executives capable of guiding companies through IPOs have become increasingly valuable.
Industry observers expect executive compensation across AI firms to remain elevated as competition intensifies.
The Bigger Picture
Anthropic’s decision to offer a base salary reaching $600,000 for an investor relations executive sends a clear signal that preparations for public markets are accelerating.
Beyond the headline salary, the recruitment reflects a broader transformation within the AI industry. As companies mature from venture-backed startups into global technology leaders, success increasingly depends not only on breakthrough research but also on convincing investors that enormous AI investments can produce sustainable long-term returns.
If Anthropic proceeds with its widely anticipated IPO, this investor relations hire could become one of the most influential behind-the-scenes roles in shaping how one of the world’s most valuable AI companies is introduced to public investors.
Sources
- Business Insider, Anthropic is offering a $600,000 salary for one of its most important IPO hires: https://www.businessinsider.com/anthropic-ipo-hiring-investor-relations-director-2026-7
- Anthropic, Official Company Website: https://www.anthropic.com/
Discover more from The Economy
Subscribe to get the latest posts sent to your email.
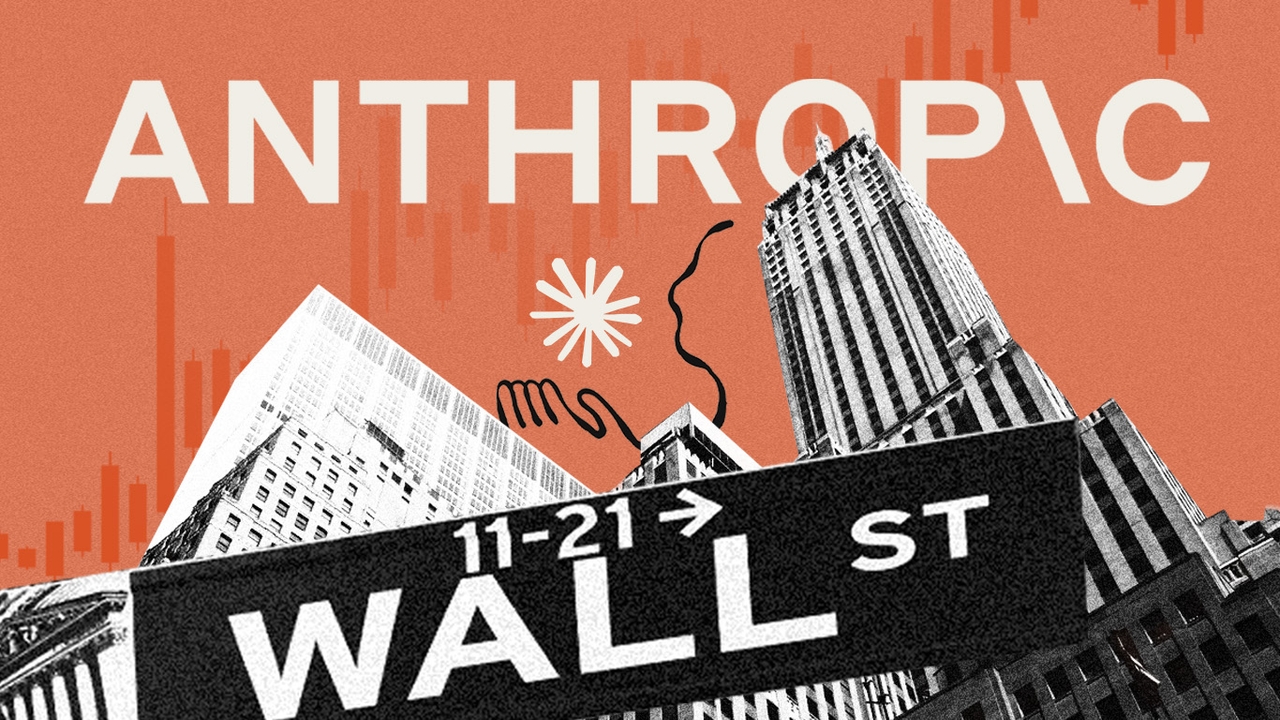
Anthropic is preparing for a possible October 2026 IPO with Morgan Stanley, Goldman Sachs and JPMorgan as lead underwriters, targeting a valuation close to or above $1 trillion — up from a $965 billion private valuation set in a May 2026 funding round. The listing would put Anthropic ahead of rival OpenAI, which has pushed its own IPO target from late 2026 into 2027.
Beyond the valuation headline
Most coverage of the Anthropic IPO has focused on a single number — the trillion-dollar valuation threshold. The more useful story for investors and market-watchers is the sequencing: why Anthropic is moving first, what its revenue trajectory actually looks like against that valuation, and what risks sit underneath the number that don’t show up in the headline.
Where things stand
Bankers working on Anthropic’s offering began scheduling meetings with prospective institutional investors in mid-July, according to reporting that cited people familiar with the process — a concrete signal that the company’s move toward a public listing, possible as early as October 2026, is advancing beyond speculation (CNBC via StartupHub; CNBC).
The valuation anchor is a $65 billion Series H funding round closed in May 2026, which pushed Anthropic’s post-money valuation to roughly $965 billion — surpassing OpenAI’s $852 billion valuation for the first time (CNBC; IG UK). Investment bankers and analysts widely expect the company to debut above the $1 trillion mark, assuming market conditions cooperate (IG UK).
Secondary-market pricing offers an early read on investor appetite: platforms tracking pre-IPO share transfers have shown an implied valuation range between roughly $1.05 trillion and $1.15 trillion, with one forecasting firm projecting a median first-day market capitalisation around $1.10 trillion — a 14% premium over the last private funding round (BitMEX).
The race against OpenAI
Timing is a deliberate part of the strategy. OpenAI also filed confidentially for an IPO but has since pushed its target from fall 2026 into 2027, giving Anthropic a window to list first (TheStreet). Being first matters for two structural reasons market analysts point to: the first mover sets the valuation benchmark the rest of the sector gets measured against, and it locks in institutional capital before broader AI-market sentiment has a chance to shift (TheStreet).
Prediction markets appear to be pricing that race directly: platform Kalshi has shown roughly a 72% probability of Anthropic listing before OpenAI, according to reporting (TheStreet).
The revenue math underneath the number
The valuation is aggressive relative to revenue by conventional software standards, though analysts describe it as within the range frontier AI companies have been commanding. Reported figures put Anthropic’s annualized revenue run-rate at roughly $47 billion as of May 2026, against the $965 billion private valuation — an implied multiple of around 20 times revenue (Luminix).
What stands out in the growth trajectory cited by analysts is its pace: the annualized run-rate reportedly moved from roughly $9 billion at the end of 2025 to $14 billion in February, $30 billion in April, and $47 billion by May — a rate of increase some analysts have described as effectively doubling every six weeks at points during that stretch (Luminix).
The consumer-versus-enterprise question
One structural risk analysts flag: Anthropic’s business is heavily weighted toward enterprise and API customers rather than consumer brand recognition. Estimates cited in investor analysis put ChatGPT’s share of consumer AI traffic at 53-68%, against roughly 2-6% for Claude (Luminix). That makes the IPO pitch to retail investors — who tend to reward consumer familiarity — different in kind from the enterprise-stickiness argument likely to anchor the institutional roadshow.
The SpaceX precedent looming over the deal
Anthropic’s timing follows closely behind SpaceX’s Nasdaq debut on June 12, 2026, which raised approximately $75 billion at a $1.77 trillion valuation under ticker SPCX. SpaceX shares have since fallen below their $135 IPO price — a data point IPO advisers and institutional buyers are reportedly weighing carefully as they assess how much premium markets will actually pay for a loss-making frontier technology company at IPO (StartupHub).
What’s confirmed versus speculative
It’s worth separating fact from forecast here. Confirmed: the confidential S-1 filing, the underwriter roster (Morgan Stanley, Goldman Sachs, JPMorgan), the $965 billion May funding round, and the ongoing investor meetings. Not yet confirmed: the actual offering price range, the exact IPO date, and the final valuation — none of which will be public until the S-1 is unsealed, expected in the lead-up to any autumn listing.
Anthropic has also taken an unusual defensive step ahead of the listing, warning multiple secondary-market platforms — including Forge, Hiive and Sydecar — that unauthorised transfers of its private shares are void and will not be recognised on the company’s books, a signal of how closely it is trying to control pre-IPO trading and pricing signals ahead of an official debut (IG UK).
The bottom line
For the nine markets covered in this analysis, the Anthropic listing is less a Silicon Valley story than a global capital-markets event: a trillion-dollar-plus debut would be among the largest IPOs in history, competing directly with OpenAI for the same pool of institutional capital and setting the valuation benchmark every subsequent AI listing — in the US, Singapore, the UK or elsewhere — will be measured against.
Discover more from The Economy
Subscribe to get the latest posts sent to your email.

Singapore’s non-oil domestic exports rose 20.7% year-on-year in June 2026, driven by a 115.4% surge in integrated circuit shipments tied to AI demand, even as a separate and less-covered trade story unfolds next door: Malaysia-Indonesia bilateral trade is projected to grow 10% to US$29.3 billion in 2026, powered by expanding halal-sector cooperation.
The story most coverage is missing
Regional business press has extensively covered Singapore’s semiconductor export boom. What’s had far less coverage is the parallel, non-tech growth engine developing in the halal trade corridor between Malaysia and Indonesia — a structural, policy-driven trade relationship that is scaling steadily even as the AI trade headlines dominate attention.
Singapore: the AI supply chain’s export barometer
Singapore’s June non-oil domestic exports climbed 20.7% year-on-year, with integrated circuit exports jumping 115.4% and disk media products and personal computers rising 170.9% and 95.8% respectively — a direct read on how deeply the AI infrastructure buildout is flowing through the city-state’s electronics trade (VietnamPlus/VNA). Non-electronic exports told a different story, falling 2.9% in June after a 17.7% rise in May, mainly on weaker shipments of non-monetary gold, petrochemicals and food preparations — evidence the export strength is narrowly concentrated in the AI-linked segment rather than broad-based.
Singapore’s economic gravitational pull on its neighbours is intensifying too: a joint study by the Singapore Business Federation, Restaurant Association of Singapore and Singapore Retailers Association found Singaporean consumers are projected to spend an additional S$1.05 billion (roughly US$810 million) annually in Johor Bahru, just across the Malaysian border — a cross-border consumption pattern that is becoming a meaningful line item in regional retail planning (VietnamPlus/VNA).
The halal corridor: a steadier, policy-built growth story
While AI exports grab headlines, Malaysia’s bilateral trade with Indonesia is forecast to grow 10% to US$29.3 billion in 2026, according to Malaysia’s Chargé d’Affaires in Jakarta, Farzamie Sarkawi — up from US$26.61 billion in 2025, itself a 5.3% increase on the year before (BusinessToday Malaysia).
The driver is structural rather than cyclical: a halal Memorandum of Cooperation signed by the two countries in 2023 established mutual recognition of halal certification, easing product movement and market access across sectors. Sarkawi described the arrangement as delivering “positive progress” through knowledge exchange, training and improved market access for businesses in both countries (BusinessToday Malaysia). The ambition extends beyond the bilateral relationship: intra-D-8 trade — spanning the eight-nation Developing 8 bloc of Muslim-majority economies — currently runs between US$150 billion and US$160 billion annually, with a stated target of US$500 billion by 2030.
The macro backdrop: a region growing, unevenly
The Asian Development Bank’s July 2026 outlook shows Indonesia’s growth forecast holding steady at 5.2% for both 2026 and 2027, while Malaysia’s outlook is unchanged at 4.6% for 2026 and 4.5% for 2027 (ADB). Regional growth leadership, per McKinsey’s Q1 2026 review, sits with Indonesia, Singapore and Vietnam, while the Philippines lagged as domestic challenges weighed on activity (McKinsey).
Indonesia’s investment story has particular momentum: foreign direct investment grew for a second consecutive quarter, rising 8.1% to 249.9 trillion rupiah (roughly US$14.5 billion) in the first quarter of 2026, with Singapore remaining Indonesia’s largest single foreign investor at US$4.6 billion, ahead of China, Japan, Hong Kong and the United States (McKinsey). Realised investment for full-year 2025 reached a record Rp1,931.2 trillion (about US$120.7 billion), exceeding the government’s own target, driven by downstream industrial projects outside Java (BERNAMA).
Indonesia’s central bank has flagged currency management as an active watch item, signalling readiness to step up both onshore and offshore FX intervention to curb rupiah weakness and keep inflation within its 2026-2027 target band (McKinsey). Foreign investment in Indonesian government bonds has nonetheless rebounded, with net inflows of 17.7 trillion rupiah following outflows in the first quarter, alongside cumulative foreign holdings of 174 trillion rupiah in Bank Indonesia Rupiah Securities (BERNAMA).
Institutional context: Singapore’s coming ASEAN chairmanship
Adding a governance dimension to the economic picture, Singapore is set to take over the ASEAN chairmanship from the Philippines in 2027, with Prime Minister Lawrence Wong pledging a smooth transition — a leadership handover that will shape how the bloc coordinates trade and investment policy, including the halal-corridor and semiconductor-trade dynamics described above, through the second half of the decade (BERNAMA).
The bottom line
Southeast Asia’s 2026 growth story is not a single narrative but two distinct, converging tracks: a high-velocity, AI-linked export boom concentrated in Singapore’s electronics trade, and a steadier, policy-engineered halal-sector trade corridor between Malaysia and Indonesia that is quietly scaling toward a $500 billion bloc-wide target by 2030. Investors and policymakers tracking only the semiconductor headlines risk missing the second, structurally more durable growth engine sitting right alongside it.
Discover more from The Economy
Subscribe to get the latest posts sent to your email.

Pakistan Gulf Investment Outflows 2026: Peace Deal Stakes Explained

Canada Trade Diversification 2026: China, Indonesia, UAE Deals Explained

US Forced-Labour Tariffs on 60 Countries: The Hidden Trade Shock of 2026

Global Central Banks 2026: Fed, BoE and BoJ Decisions Could Reshape Markets

Gulf Capital Retreat From Pakistan 2026: UAE Loan Freeze & What It Means

Pakistan’s Most Reliable Export Is Its People: Remittances Hit $41.6 Billion, Overtaking Total Exports

Indonesia’s Confidence Problem: Record Investment, a Sinking Rupiah, and a Widening Credibility Gap

Down But Not Out: Inside the Slow Sinking of Russia’s War Economy

China’s Growth Slips to a Four-Year Low: Why Beijing Still Won’t Pull the Stimulus Trigger

The Johor-Singapore Corridor: How Malaysia Became Southeast Asia’s AI Infrastructure Powerhouse

Canada’s Economy ‘On Pause’: Inside the CUSMA Deadline That Passed Without a Deal

Dubai’s Millionaire Magnet: How the UAE Turned Middle East Turmoil Into a Capital Safe-Haven Boom

Britain’s Sixth Prime Minister in a Decade: What Starmer’s Exit Means for Gilts, Sterling and Your Portfolio

Anthropic Offers Up to $600,000 Salary for Critical IPO Role as AI Giant Prepares for Wall Street Debut

Carry Trade Unwind 2026: How the Yen’s Snapback Triggered a Global Margin Call

AI Bubble Warning 2026: Why BIS, IMF and Bank of England Fear a Market Crash

BRICS De‑Dollarization Strategy Takes Shape with $15 Billion Local‑Currency Push

The AI Super Bubble Is Ready to Burst

Russia Bans Diesel Exports 2026: Global Fuel Market Impact Explained

Strait of Hormuz Blockade 2026: Oil Prices Surge 9% as US-Iran Conflict Reignites

Private Credit Warning: Most BDCs Turn Unprofitable in 2026, Reuters Finds

IMF Cuts Pakistan Growth Forecast, Raises Inflation to 8.4%

Bitcoin $150k Milestone Achieved as US Sovereign Crypto Pivot Looms
Gulf Capital Retreat From Pakistan 2026: UAE Loan Freeze & What It Means

India Economic Rise 2026: How the Subcontinent Toppled Japan

Strait of Hormuz 2026: Why Markets Still Don’t Trust It’s Open

China Housing Market Turnaround: White‑List Model Stabilises Prices

Chipmakers Just Lost 6.7% in Two Days: Inside the Great AI Trade Rotation
-

 Markets & Finance7 months ago
Top 15 Stocks for Investment in 2026 in PSX: Your Complete Guide to Pakistan’s Best Investment Opportunities
-

 Analysis5 months ago
Johor’s Investment Boom: The Hidden Costs Behind Malaysia’s Most Ambitious Economic Surge
-

 Analysis5 months ago
Top 10 Stocks for Investment in PSX for Quick Returns in 2026
-

 Analysis6 months ago
Brazil’s Rare Earth Race: US, EU, and China Compete for Critical Minerals as Tensions Rise
-

 Banks6 months ago
Best Investments in Pakistan 2026: Top 10 Low-Price Shares and Long-Term Picks for the PSX
-

 Investment7 months ago
Top 10 Mutual Fund Managers in Pakistan for Investment in 2026: A Comprehensive Guide for Optimal Returns
-

 Global Economy7 months ago
15 Most Lucrative Sectors for Investment in Pakistan: A 2025 Data-Driven Analysis
-

 Global Economy7 months ago
Pakistan’s Export Goldmine: 10 Game-Changing Markets Where Pakistani Businesses Are Winning Big in 2025