
Fintech & Global Finance
World Trade in 2026: Tariffs, Supply Chains and the Cost of Fragmentation


The debate over tariffs is often framed as a simple contest between protection and globalization. The WTO’s 2026 research takes a broader view: rules reduce uncertainty and help countries of different sizes participate in international trade. Its fragmentation simulations point to substantial losses in world production and exports under extreme bloc-based scenarios; simulations are not forecasts of what will certainly occur. Sources: World Trade Organization and WTO World Trade Report.
The important context competitors can overlook
Tariffs can shift the price paid by importers and consumers while also creating some domestic production incentives. Businesses may diversify suppliers, hold additional inventory or redesign products to satisfy rules-of-origin tests. Those adjustments involve transition costs that matter to small companies as much as multinationals. Services trade and AI-related goods add further complexity to a story that should not revolve solely around container volumes. For primary-source checks and current reporting, see World Trade Organization and Reuters critical-minerals report. The key distinction is use wto scenario data with clear caveats.
Tariffs can influence import costs, consumer prices and industrial decisions, but their burden depends on market and supply-chain conditions. Research cutoff: October 12, 2026; confirm developing facts before publication.
A practical way to use this information
When comparing government policy proposals, specify the tariff base, exemptions, enforcement timeline and likely retaliation. Add a simple product-level example rather than declaring a uniform percentage increase in retail prices. Quote the latest WTO outlook with its publication date and avoid presenting modeled economic losses as realized data.
What to verify before making a decision
The right next step is to identify the source, timestamp and applicable market or jurisdiction. Check whether a number is a historical observation, official announcement, target, forecast or scenario. If you intend to act financially, legally or commercially, use the relevant provider’s current terms and obtain professional advice where appropriate. The sources cited here establish context; they are not a substitute for live prices, individual eligibility checks or binding agreements.
Reader questions
Do tariffs always lower imports by the same percentage? No. Responses differ by product, substitutes, exchange rates and supplier decisions.
Are WTO fragmentation figures predictions? No. The cited large losses come from modeled scenarios.
A tariff is a tax at the border, not a complete industrial strategy
Tariffs change the costs of importing selected goods under applicable rules. The legal importer generally pays the customs charge, but the eventual economic burden can be distributed among importers, foreign suppliers, consumers and other businesses depending on pricing power and competition. Some companies raise final prices, some accept lower margins and some shift sourcing. This means a tariff announcement does not translate into an identical consumer-price rise for every product. The product classification, country of origin, exemptions and date of entry all matter.
The political goals of a tariff can include protection of domestic production, bargaining leverage, revenue or national-security concerns. Supporters argue that tariffs can encourage local capacity or address unfair competition. Critics argue that they raise costs, weaken competition or invite retaliation. The net effect depends on design, industry structure, adjustment time and policy responses. An informative analysis should present these competing mechanisms without assuming one tool produces the same outcome in all sectors.
Why moving a factory is much harder than changing a supplier
Supply chains combine raw materials, specialist components, equipment, logistics and skilled labor. A company buying parts from a supplier in one country may discover that proposed alternatives rely on the same upstream producer. Moving assembly to a new destination does not necessarily change where key components originate. Rules of origin determine whether goods qualify for particular trade treatment and can be technically complex. Companies must also consider qualification, standards, financing, infrastructure and contract penalties before making a shift.
Diversification can reduce exposure to one country but add administrative costs and smaller production runs. Localizing every input can be impossible or uneconomic for some industries. The realistic goal is often a balance of cost, resilience and geopolitical exposure, not absolute self-sufficiency. Good trade reporting identifies which stage of production is moving instead of proclaiming an entire supply chain has returned home because a final assembly plant opened.
The consumer and small-business impact
A retailer importing kitchen equipment may face direct landed-cost changes, while a local manufacturer using imported components may see an indirect impact. Each business must calculate customs, shipping, insurance, compliance and foreign-exchange costs to know the actual margin effect. Consumers can experience higher prices on some goods while seeing little change on others. Exchange-rate adjustments, discounting and existing inventories can obscure the immediate result. A price spike should not automatically be attributed to tariffs without a defensible comparison.
Small firms may be less able to absorb abrupt compliance costs than large multinationals with dedicated customs teams. They may need new documentation, alternate logistics or changes in pricing strategy. For policy analysis, compare the stated objective with observable outcomes such as investment, production, prices and trade flows. Announced investment intentions are useful but not equivalent to completed factories or jobs.
Why retaliation and trade rules matter
One country’s import restriction can trigger another government’s policy response, affecting exporters that were not part of the original dispute. Export controls, quotas, licensing requirements and tariffs are legally and economically distinct tools. Some measures are contested under international trade agreements or subject to national exceptions. A ruling, negotiation or exemption can alter practical exposure over time. Editors should identify whether a trade measure has been proposed, enacted, suspended, challenged or amended.
The World Trade Organization provides data and analysis on trade trends and rules, but national customs authorities remain important for product-specific requirements. A broad macroeconomic model can indicate risks from fragmentation; it does not determine the duty on a particular shipment. Businesses need current tariff schedules and professional customs advice for binding decisions.
A framework for reporting trade fragmentation
Track bilateral trade flows by product, capacity announcements, manufacturing output, consumer prices and new trade restrictions. Distinguish a change caused by cyclical demand from one caused by policy. When describing “friend-shoring,” name the goods and actual supplier changes. Cite the baseline year and currency in every export or import comparison. Avoid calculating a global economic cost by adding together incompatible estimates from different models.
International trade can provide gains through specialization while also creating vulnerabilities. The debate is not settled by claiming either that all globalization is beneficial or that every import is a strategic mistake. Useful reporting follows the evidence to explain who pays, who benefits and what tradeoffs emerge.
Three common tariff misconceptions
“The exporting country pays the tariff directly.” Customs charges are generally collected from the party legally responsible for import entry, while the economic burden can be shared through changed prices and margins. Exporters might lower prices to stay competitive; consumers might pay more; or importers might absorb the cost. It is not a universal one-party payment story.
“Imports automatically disappear when a tariff rises.” Some products have readily available alternatives; others require scarce components or long qualification processes. Demand may adjust slowly, and firms may carry existing inventory before changing suppliers. Trade statistics need sufficient time and product detail to reveal what actually changed.
“A new factory proves all jobs moved home.” Final assembly may be localized while essential inputs remain imported. Employment effects depend on automation, capacity, production volume and domestic supplier networks. A reliable report distinguishes announced construction investment from completed operating employment rather than equating every investment figure with realized jobs.
Discover more from The Economy
Subscribe to get the latest posts sent to your email.


Fintech & Global Finance
Global Market Outlook: Navigating Interest Rates, Inflation, and Commodity Spikes
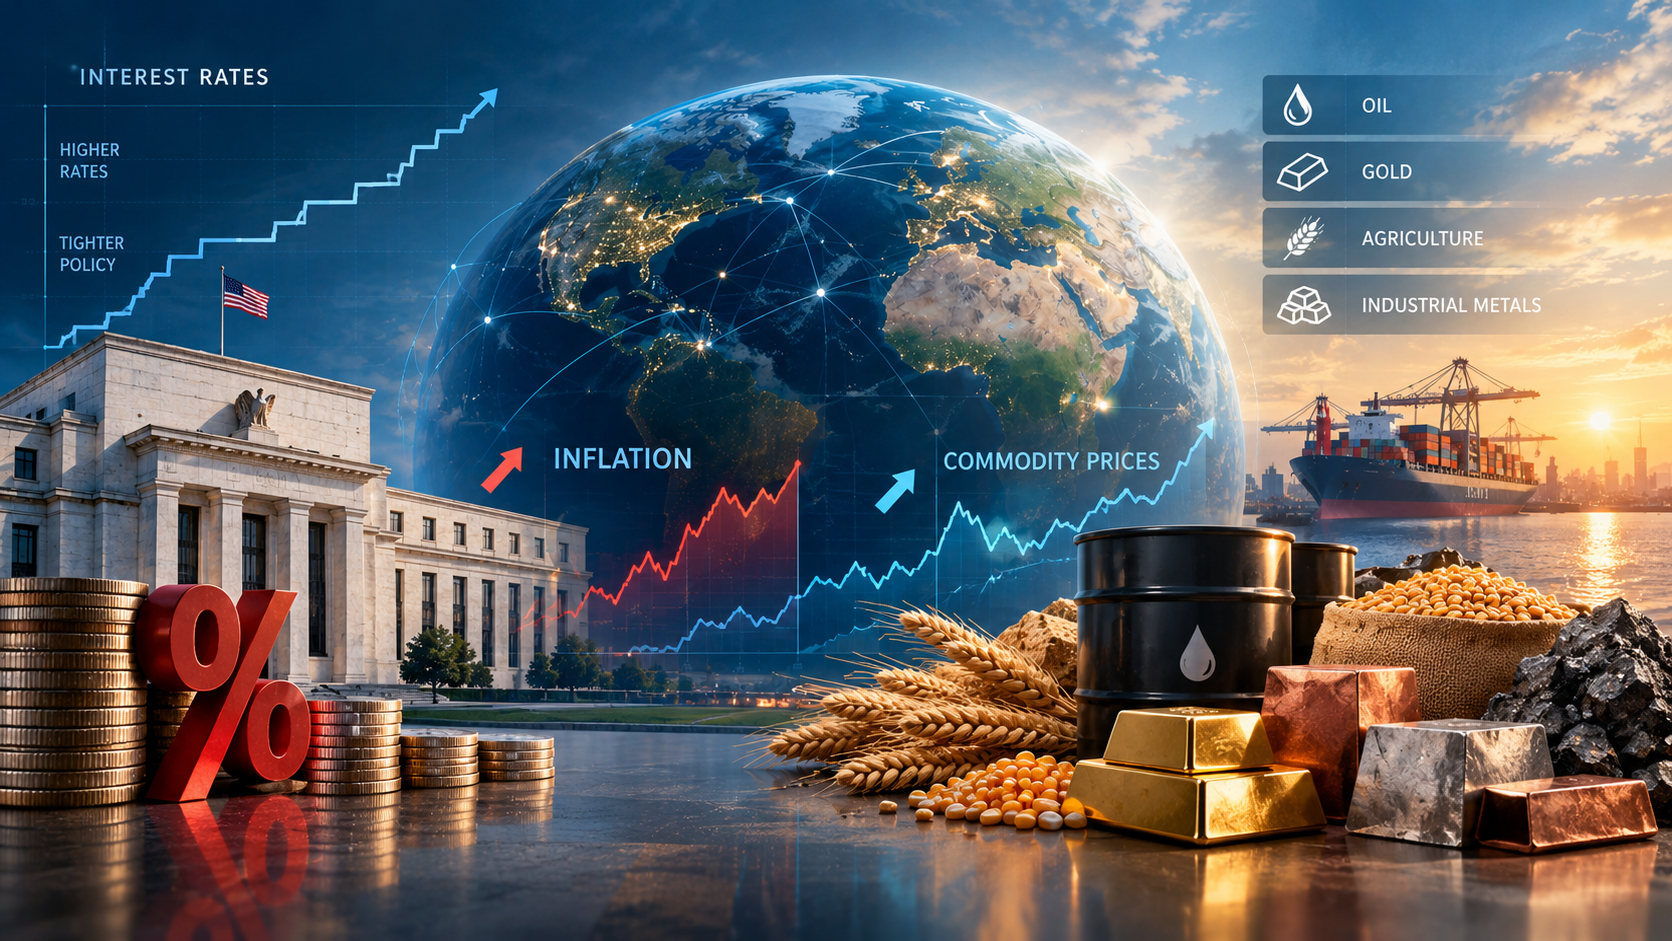
Central banks are now raising rates, not cutting them, as oil tops $100. Here’s where the Fed, ECB, inflation, and crude stand, and what to watch next.
Key Takeaways
- The Federal Reserve raised its target range by 0.25 percentage points on September 16, 2026, to 3.75% to 4.00%. It was the first US hike in several years.
- The European Central Bank has raised rates twice this year, most recently on September 10, bringing its deposit rate to 2.50%.
- US headline inflation was 3.4% year over year in August 2026, with core inflation at 2.4%. The energy component is the main reason headline inflation is above core.
- Brent crude traded above $100 a barrel in early September and was at $100.53 on October 6, after rising more than 30% from early-August lows.
- The main driver is a supply shock tied to the conflict involving Iran, which has disrupted shipping and energy infrastructure. Monetary policy is responding to that shock, not to weak growth.
Search Intent Summary
Readers searching for a global market outlook want to know three things: where interest rates are heading, whether inflation is coming back, and what commodity prices mean for their money. This article covers the current policy settings, the inflation data behind them, and the oil shock driving both.
The Policy Shift: From Cuts to Hikes
Through much of 2025, the Fed was cutting rates. It delivered three consecutive cuts in the second half of that year and then paused. Through the first eight months of 2026, the Fed held at 3.50% to 3.75%, with at least one official dissenting in favor of a hike at the July meeting.
The Fed’s September 15 to 16 meeting changed the picture. The committee raised the target range by 25 basis points, to 3.75% to 4.00%, and the Federal Reserve’s published calendar and statements confirm the meeting schedule. The updated projections point to roughly one more quarter-point increase before year-end, according to secondary analysis of the Fed’s September summary of economic projections. Readers should check the Fed’s own projections table rather than relying on summaries.
Europe moved first. The ECB raised its deposit rate in June, its first hike since September 2023, and again on September 10, to 2.50%. Its main refinancing rate is now 2.65%, and the marginal lending rate is 2.90%. The ECB said it is not committing to a fixed path and will decide meeting by meeting.
The message from both central banks is consistent. Inflation has moved above target because of energy, and the risk is that it becomes entrenched. Cutting rates into an energy shock would be the opposite of what policymakers want to do.
The Inflation Picture
US consumer prices rose 3.4% over the year to August 2026, unchanged from July. The peak this year was 3.8% in April. Monthly headline CPI rose 0.4% in August, with energy up 2.1%.
Core inflation, which excludes food and energy, eased to 2.4% year over year, the lowest reading since March 2021. Core CPI rose 0.3% in August alone, above the 0.2% consensus, which is why markets read the report as hawkish. Real average hourly earnings fell 0.3% over the year, meaning wages are losing ground to prices.
The eurozone shows a similar pattern. Euro-area inflation reached 3.3% in August, its highest since 2023, with energy the main driver. Excluding energy, inflation was about 2.2%. The ECB’s own projections put headline inflation averaging 3.0% in 2026, falling toward 2.5% in 2027 and 2.1% in 2028.
That split matters. When energy drives inflation and core stays contained, central banks face a dilemma. Hiking rates does little to lower oil prices, but it can slow growth and tighten financial conditions.
The Oil Shock
Brent crude is the single biggest variable in this outlook. Brent rose above $100 on September 9, touched $106.60 on September 10 during a 5% one-day jump, and was trading at $100.53 on October 6. Reporting from Khaleej Times attributed the spike to the biggest wave of attacks on shipping since the conflict began, along with the failure of hopes for a lasting ceasefire.
The conflict is now around six months old. The International Energy Agency’s August forecast projected global oil supply falling by about 4.3 million barrels a day in 2026, roughly 4%. OPEC, by contrast, has cut its forecast for world oil demand growth for a fifth straight month, which shows the market is pricing supply risk more than demand strength.
The supply and demand picture is tight. Analysts quoted in September described a “prolonged new normal” in which disruption risk is persistent rather than occasional, and noted limited spare production capacity. The Strait of Hormuz is the key chokepoint in that analysis.
Bond Markets and the Dollar
Rates have moved beyond the policy decisions themselves. Ten-year US Treasury yields reached their highest level since 2023 in early September, and Germany’s ten-year Bund yield hit its highest since 2011 after the ECB decision. That means borrowing costs are rising for governments and households alike, including mortgages.
For the currency picture, the dollar’s direction depends on how the Fed and ECB diverge. The ECB’s deposit rate now sits about 1.00 to 1.25 percentage points below the US range, a gap that generally favors the dollar. If the ECB hikes further than the Fed, that gap narrows. Watch the rate differential, not just the level of rates.
Scenarios for the Next Six Months
Rather than a single forecast, consider three paths. These are analytical scenarios, not predictions.
Base case: elevated energy, gradual hikes. Oil stays above $90 with periodic spikes, inflation hovers around 3%, and the Fed and ECB make one or two more moves before pausing. Bond yields stay high, and rate-sensitive sectors such as housing remain under pressure.
Escalation: oil moves higher and sticks. A sustained disruption pushes Brent well above $100, headline inflation rises again, and central banks face a choice between tightening further and accepting above-target inflation. This is the scenario that most threatens growth.
De-escalation: a durable ceasefire. Oil falls back, headline inflation eases through the rest of the year, and markets start pricing rate cuts again. Earlier in 2026, the Fed’s own projections showed cuts were possible, and a credible ceasefire could revive that path.
The swing factor is the conflict, not the data. Monthly inflation prints matter, but energy prices can overwhelm any single report.
Practical Strategy: What to Watch
For investors, the immediate indicators are the monthly CPI release, weekly oil inventory data, and any shipping disruption news from the Strait of Hormuz. Watch the 10-year Treasury yield as a gauge of financing costs across the economy.
For households and businesses, the practical takeaways are straightforward. Fixed-rate borrowing costs have risen and may stay high. Energy budgets need a buffer. Variable-rate debt is more exposed to further hikes than fixed-rate debt.
For policy watchers, the ECB’s next scheduled decision falls on October 29, and the Fed’s next meeting date is listed on its calendar. Each decision will reflect the most recent inflation and energy data.
This article offers general market context and is not investment advice. Consider speaking with a licensed financial adviser before making decisions based on these trends.
Future Outlook
The regime has changed. Two years ago, the debate was about how fast central banks would cut. Today it is about how far they will hike, and whether energy inflation spreads into wages and services. Core inflation is currently contained, which gives policymakers room to wait. That room shrinks if oil stays above $100 for months.
Frequently Asked Questions
Why are central banks raising rates instead of cutting them?
Inflation is above target in both the US and eurozone, and energy prices are the main driver. Raising rates is intended to keep higher energy costs from spreading into wages and prices across the economy. Both central banks have said decisions will depend on incoming data.
Is inflation falling?
Headline US inflation has eased from a 3.8% peak in April to 3.4% in August, and core inflation is at its lowest level since 2021. However, headline inflation is still well above the Fed’s 2% target, and eurozone inflation rose in August. Whether the trend continues depends largely on energy prices.
How high is oil right now?
Brent traded at $100.53 on October 6, 2026. Oil prices move daily, so check a current quote before relying on any figure. Prices have been volatile since the conflict escalated in early September.
Will interest rates fall in 2026?
The Fed’s September projections point to roughly one more increase by year-end rather than cuts. Market expectations change with each data release and each development in the conflict. Check the Fed’s latest statement and projections for the current outlook.
Discover more from The Economy
Subscribe to get the latest posts sent to your email.

Key Takeaways
- Goldman Sachs wins on profit and returns. In the second quarter of 2026 it reported net earnings of $6.63 billion on net revenues of $20.34 billion. By our math, that is roughly 33 cents of profit per revenue dollar.
- Citigroup wins on sheer revenue. Citi booked $24.8 billion of revenue and $5.8 billion of net income in the same quarter. That works out to about 23 cents of profit per revenue dollar.
- They are different kinds of bank. Goldman is a markets, advisory and asset-management house. Citi is a global transaction bank with a wealth arm, a markets desk and a U.S. consumer business.
- Returns separate the two. Goldman’s return on tangible common equity was 21.3% in the first quarter, while Citi was running at about 13% in the second quarter and still guiding to 10% to 11% for the full year.
- “Leads” depends on the yardstick. Profitability points to Goldman. Global payments plumbing, balance-sheet breadth and turnaround upside point to Citi.
Ask ten bankers which of these two firms leads global finance and you will get ten answers, usually shaped by which floor they work on. A trader at Goldman and a treasury specialist at Citi are, in practice, living in different industries that happen to share a zip code.
So let’s settle it with a scoreboard instead of a debate. This guide compares the two banks using their own filings for the quarter ended June 30, 2026, then adds the context raw numbers can’t carry: strategy, capital return and the unfinished business sitting inside Citi’s turnaround.
One caution before the table. Per-share figures are not comparable across the two firms. Goldman’s $20.98 earnings per share and Citi’s $3.15 reflect very different share prices and share counts, not a seven-fold gap in quality. Compare margins, growth and returns instead.
The Q2 2026 Scorecard
| Metric (Q2 2026) | Goldman Sachs | Citigroup |
|---|---|---|
| Revenue | $20.34B (up 39% year over year) | $24.8B (up 14%) |
| Net income | $6.63B | $5.8B (up 45%) |
| Earnings per share | $20.98 | $3.15 (vs. $1.96 a year ago) |
| Profit per revenue dollar (our calculation) | About 33 cents | About 23 cents |
| Latest return on tangible common equity cited | 21.3% (Q1 2026) | 13% (Q2 2026) |
| Headline capital return | Quarterly dividend raised to $5.00 per share | $30B buyback commitment; dividend increase of about 12% |
Sources: Goldman Sachs Q2 2026 earnings release, Citigroup’s Q2 2026 Form 10-Q and Citi’s Q2 earnings-call highlights. The Goldman return figure comes from the first quarter, the latest in our sources, so treat the ROTCE gap as directional rather than a perfect like-for-like comparison.
How Goldman Sachs Makes Its Money
Goldman’s second quarter was loud. Net revenues rose 39% from a year earlier and 18% from the first quarter. The filing credits the jump primarily to Global Banking & Markets, which produced $15.52 billion, up 53% year over year.
The second engine, Asset & Wealth Management, added $4.60 billion, up 20%. Across the first half of 2026, Goldman generated $37.57 billion of net revenues and $12.26 billion of net earnings.
What does that mix tell you?
- Trading and advisory income is cyclical. It tends to swell when volatility is high and clients are repositioning, which describes much of 2026 so far.
- Asset and wealth management is steadier. Management fees and client inflows give Goldman a base that doesn’t depend on any single week of market chaos.
- The model is capital-light relative to a deposit-funded bank. That is part of why profit per revenue dollar looks so strong, and part of why earnings can swing harder than Citi’s.
The board also lifted the quarterly dividend to $5.00 per share for the third quarter. That is the kind of move a firm makes when it feels good about its earnings power, though dividends are never guaranteed.
How Citigroup Makes Its Money
Citi is built differently. It reports five interconnected businesses (Services, Markets, Banking, Wealth and U.S. Personal Banking) plus a set of legacy franchises being wound down or sold.
In the second quarter, net interest income reached $17.1 billion, up 13%, while non-interest revenue was $7.6 billion, up 18%. One detail stands out: Markets non-interest revenue was $3.0 billion against $3.2 billion a year earlier, so the growth did not come from the trading floor. It came from deposits, fees and the transaction-banking machinery underneath.
That machinery is Services, Citi’s treasury, trade and securities-services franchise. CEO Jane Fraser said it delivered its highest quarterly revenue ever and a return above 30%, per the earnings-call recap.
Think of Services as the plumbing of cross-border commerce. When a multinational moves cash between 90 countries, Citi often sits in the middle. That position is slow to build, hard to replicate and surprisingly sticky.
Profitability and Returns: The Gap That Matters
Return on tangible common equity (ROTCE) measures how much profit a bank earns on the shareholder capital that isn’t tied up in goodwill and intangibles. Analysts lean on it because it translates “how big is the bank” into “how well does the bank use its capital.”
Here is how the two stack up against peers, using first-quarter 2026 figures from Banking Dive:
- JPMorgan: 23%
- Goldman Sachs: 21.3%
- Bank of America: 16%
- Wells Fargo: 14.5%
- Citigroup: 13.1%
Citi is improving fast, with second-quarter net income up 45%, but it is still catching up to the pack. Goldman sits near the top of the table.
Citi’s Unfinished Business
If Goldman’s story is “keep executing,” Citi’s story is “finish the rebuild.” Four items matter.
1. A long runway of return targets
Citi still guides to 10% to 11% ROTCE for 2026. At its May investor day it set a path of 11% to 13% for 2027 and 2028, then 14% to 15% across 2029 to 2031, according to Reuters. Some investors wanted a bolder near-term number, and RBC analysts called the near-term target underwhelming. Management keeps describing 2026 as a waypoint, not a destination.
2. The Banamex exit
Citi has now sold 49% of Banamex, its Mexican consumer franchise. It does not expect further sales in 2026, plans to deconsolidate early in 2027, and will pursue an IPO when markets allow.
3. Capital return
The $30 billion buyback commitment and the planned dividend increase signal confidence, and they shrink the share count, which helps per-share math over time.
4. The transformation program
Fraser said a large body of work passed internal-audit validation during the quarter. For a bank that has spent years under regulatory pressure to fix its controls, that is quiet but meaningful progress.
Which Bank Leads? Seven Lenses
| Lens | Edge | Why |
|---|---|---|
| Profitability and returns | Goldman | Higher profit per revenue dollar and a much higher ROTCE |
| Revenue scale (Q2 2026) | Citi | $24.8B versus $20.34B |
| Cross-border transaction banking | Citi | Services is a record-setting, 30%-plus-return franchise |
| Advisory and capital-markets brand | Goldman | Global Banking & Markets revenue up 53% |
| Earnings stability | Citi, narrowly | Deposit and fee income is less tied to deal and trading cycles |
| Turnaround upside | Citi | More room to close the returns gap if targets are hit |
| Earnings momentum (net income growth) | Goldman | Revenue up 39% year over year in Q2 |
If you force a single verdict, Goldman “leads” on the metric Wall Street weighs most, which is returns on capital. Citi “leads” on the breadth of its global footprint. Neither answer is wrong. They just answer different questions.
What to Watch Next
If you follow bank stocks, three things deserve a spot on your calendar. This is general information, not investment advice.
- Third-quarter earnings. Both banks typically report in mid-October, so check each firm’s investor-relations calendar for exact dates.
- Citi’s ROTCE path. The gap between roughly 13% today and the 14% to 15% medium-term target is the whole equity story.
- Goldman’s trading durability. A quarter of revenue up 39% sets a high bar for the next one.
Asked & Answered
Is Goldman Sachs more profitable than Citigroup?
On the latest quarterly numbers, yes. Goldman earned $6.63 billion on $20.34 billion of revenue, while Citi earned $5.8 billion on $24.8 billion. Goldman converts more of each revenue dollar into profit.
What is ROTCE, and why do analysts care so much?
ROTCE is return on tangible common equity. It shows how efficiently a bank turns shareholder capital into profit, excluding goodwill and intangibles. It is the cleanest single yardstick for comparing banks of different sizes.
Are Goldman and Citi direct competitors?
Partly. They overlap in investment banking and markets trading. Beyond that, Citi is also a global payments, custody, wealth and credit-card business, while Goldman is far more focused on markets, advisory and asset management.
Does the Banamex sale matter for investors?
It does. Selling Banamex releases capital, simplifies the company and clears a long-running distraction. Deconsolidation is expected early in 2027, with an IPO to follow when conditions are right.
When do Goldman and Citi report next?
Both normally publish third-quarter results in mid-October. Confirm the exact dates on each company’s investor-relations page before you plan around them.
Discover more from The Economy
Subscribe to get the latest posts sent to your email.

Kai Cenat turned a month of non-stop livestreaming into the biggest subscriber haul in Twitch history, and the business model underneath it is stranger and more lucrative than it looks.
Key Takeaways
- First to 1 million. On September 28, 2025, Cenat became the first Twitch streamer to pass one million active subscribers, during his third “Mafiathon” subathon (Influencer Marketing Hub).
- Record trajectory. His Mafiathon 2 in November 2024 hit roughly 728,000 subscribers, topping the previous record of 326,250 held by VTuber Ironmouse (Yahoo Tech).
- Scale of attention. Mafiathon 3 tallied 82.5 million hours watched and a peak above one million concurrent viewers (Influencer Marketing Hub).
- Revenue engine. Subscriptions are only one layer; sponsorships, celebrity-driven reach, and brand deals multiply the value of each record.
| Event | Date | Subscribers | Notes |
|---|---|---|---|
| Mafiathon 1 | 2023 | ~306,600 | Overtook Ludwig’s record (Wikipedia) |
| Mafiathon 2 | Nov 2024 | ~728,000 | Beat Ironmouse; ~50M unique viewers reported (Yahoo Tech) |
| Mafiathon 3 | Sept 2025 | 1,000,000+ | First streamer past 1M; 82.5M hours watched |
How a Subathon Makes Money
A subathon is a livestream marathon where each new subscription adds time to the clock. The mechanism is simple and powerful:
- Viewers subscribe (a Tier 1 sub costs $4.99 a month).
- Each sub extends the stream, giving fans a stake in the outcome.
- Gift subs spread the effect, letting communities pool money to push the number higher.
- Celebrity guests drive news cycles, pulling in casual viewers who may subscribe once.
Cenat’s 2024 event featured guests such as Snoop Dogg, Kevin Hart, Serena Williams, Lizzo, and SZA, per People of Color in Tech, which also reported the stream was staffed to continue while he slept.
The Revenue Math
Platform splits vary, but Twitch has been reported to keep between 30% and 50% of subscription fees (Yahoo Tech). Using that range, here is an illustrative (not reported) calculation for one month of one million Tier 1 subscriptions:
| Step | Amount |
|---|---|
| Gross at $4.99 × 1,000,000 | ~$4.99 million |
| Streamer share at 50% | ~$2.5 million |
| Streamer share at 70% | ~$3.5 million |
Reality differs: many subscriptions are discounted, gifted in bundles, or on other tiers, and the figure excludes sponsorships and other income. For Mafiathon 2, Yahoo Tech reported an estimated $3.6 million in subscription revenue, a model-based estimate rather than a disclosed number.
Why the Model Works
Attention as an asset
Cenat is the most-followed Twitch streamer, with about 21 million followers, according to Wikipedia. He began streaming on Twitch in February 2021 after moving from YouTube.
Community ownership
Subscribers are not passive; they help set the stream’s length. That participation turns a purchase into an identity.
Event scarcity
Mafiathon happens rarely, so each edition is treated as a cultural moment rather than routine content.
Records as marketing
Every new record generates press coverage that serves as free advertising for the next event.
The Risks Behind the Records
- Concentration risk. One person is the product. Health, burnout, or a platform ban would hit income directly. Cenat was temporarily suspended from Twitch in April 2023 (Wikipedia).
- Platform dependence. Twitch controls the revenue split, rules, and discoverability.
- Subscriber decay. Subathon spikes fade; subscribers often lapse after the event. As of January 6, 2026, Cenat’s channel was listed at about 1.11 million all-time peak subscribers (Wikipedia list), a record, but not a baseline.
- Competition. Streamers such as Jynxzi, IShowSpeed, and others continue to compete for the same audience.
What Marketers and Creators Can Learn
- Design participation, not just content. Let the audience affect the outcome.
- Make events rare and recognizable.
- Use guests as distribution, not just entertainment.
- Diversify income across subscriptions, brand deals, and owned products.
- Treat records as campaigns, with a clear narrative arc.
Frequently Asked Questions
How many subscribers does Kai Cenat have?
He passed 1,000,000 active subscribers on September 28, 2025, the first on Twitch to do so (Influencer Marketing Hub).
How much did Mafiathon make?
Mafiathon 2 was estimated at about $3.6 million in subscription revenue, per Yahoo Tech; official figures were not disclosed.
What is a subathon?
A livestream where each new subscription adds time to the broadcast.
How much does Twitch take from subscriptions?
Reported at 30% to 50%, depending on the streamer’s agreement.
Is Kai Cenat the biggest streamer?
He is described as the most-subscribed and most-followed Twitch streamer as of 2026 (Wikipedia).
Kai Cenat did not just build an audience. He built a machine that converts attention into a countdown clock, and then sold the countdown.
Discover more from The Economy
Subscribe to get the latest posts sent to your email.

US–China AI Export Controls in 2026: Chips, Testing Rules and Corporate Risk

World Trade in 2026: Tariffs, Supply Chains and the Cost of Fragmentation

Global Economy Outlook 2026–27: What to Watch Ahead of the IMF October Report

Strait of Hormuz in 2026: Why Shipping Risks Matter for Oil, Insurance and Food Prices

US–China Critical Minerals Competition in 2026: Who Controls the Supply Chain?

Oil and Diesel Prices in October 2026: How Supply Shocks Can Reach Inflation

AI Chip Demand in 2026: What TSMC, Nvidia and Data-Center Spending Reveal

Q3 2026 Earnings Season: The Bank, AI and Consumer Signals That Really Matter

Treasury Yields in 2026: Why Higher Bond Rates Matter for Stocks, Mortgages and Savings

KOSPI 2026: Why South Korean Stocks Turned Volatile and What AI Investors Should Watch

IREN Stock in 2026: AI Cloud Growth, Bitcoin Transition and the Risks Investors Miss

Stock Market Crash in 2026? Warning Signs, Scenarios and a Calm Investor Checklist

Peso Mexicano vs Dólar Estadounidense: A Practical USD/MXN Guide for October 2026

Is the Stock Market Open on Columbus Day 2026? NYSE, Nasdaq and Bonds Explained

China Stocks Today: Are Big Economies in Asia Nearing a Market Bottom?

World’s Largest Economies: Ranking the Top Global Powers

Global Pension Systems Ranked: The World’s Best and Worst Retirement Frameworks

Elon Musk’s Next Moves: Disrupting the 2026 Global Economy

Crude Oil & Petroleum Market Analysis: OPEC+ Decisions and Price Forecasts

Pakistan Economy 2026: Inside the SBP’s Balancing Act

GasBuddy Market Insights: How Crude Price Shifts Impact Local Fuel Cost Averages

Global Equity Market Divergence: US Tech vs. European Dividend Stocks vs. Asian Growth

IMF & World Bank Global Economic Outlook: Growth Forecasts Across Europe and Asia

Silver Price Today: Why the Xi-Trump AI Standoff Is Fueling a Safe-Haven Rally

Bitcoin Price Forecast 2026–2027: Will the 4-Year Cycle Hold?

The Future of Silicon: Supply Chain Vulnerabilities in the 2026 Tech Sector

Asian Stock Markets 2026: Japan, China, Pakistan & More

Stagflation vs. Soft Landing: How Central Bank Rates Are Reshaping European and Asian Economies
-

 Markets & Finance9 months ago
Top 15 Stocks for Investment in 2026 in PSX: Your Complete Guide to Pakistan’s Best Investment Opportunities
-

 Analysis8 months ago
Johor’s Investment Boom: The Hidden Costs Behind Malaysia’s Most Ambitious Economic Surge
-

 Analysis8 months ago
Top 10 Stocks for Investment in PSX for Quick Returns in 2026
-

 Banks9 months ago
Best Investments in Pakistan 2026: Top 10 Low-Price Shares and Long-Term Picks for the PSX
-

 Analysis8 months ago
Brazil’s Rare Earth Race: US, EU, and China Compete for Critical Minerals as Tensions Rise
-

 Investment9 months ago
Top 10 Mutual Fund Managers in Pakistan for Investment in 2026: A Comprehensive Guide for Optimal Returns
-

 Global Economy10 months ago
15 Most Lucrative Sectors for Investment in Pakistan: A 2025 Data-Driven Analysis
-

 Global Economy10 months ago
Pakistan’s Export Goldmine: 10 Game-Changing Markets Where Pakistani Businesses Are Winning Big in 2025