
Global Finance
Peso Mexicano vs Dólar Estadounidense: A Practical USD/MXN Guide for October 2026

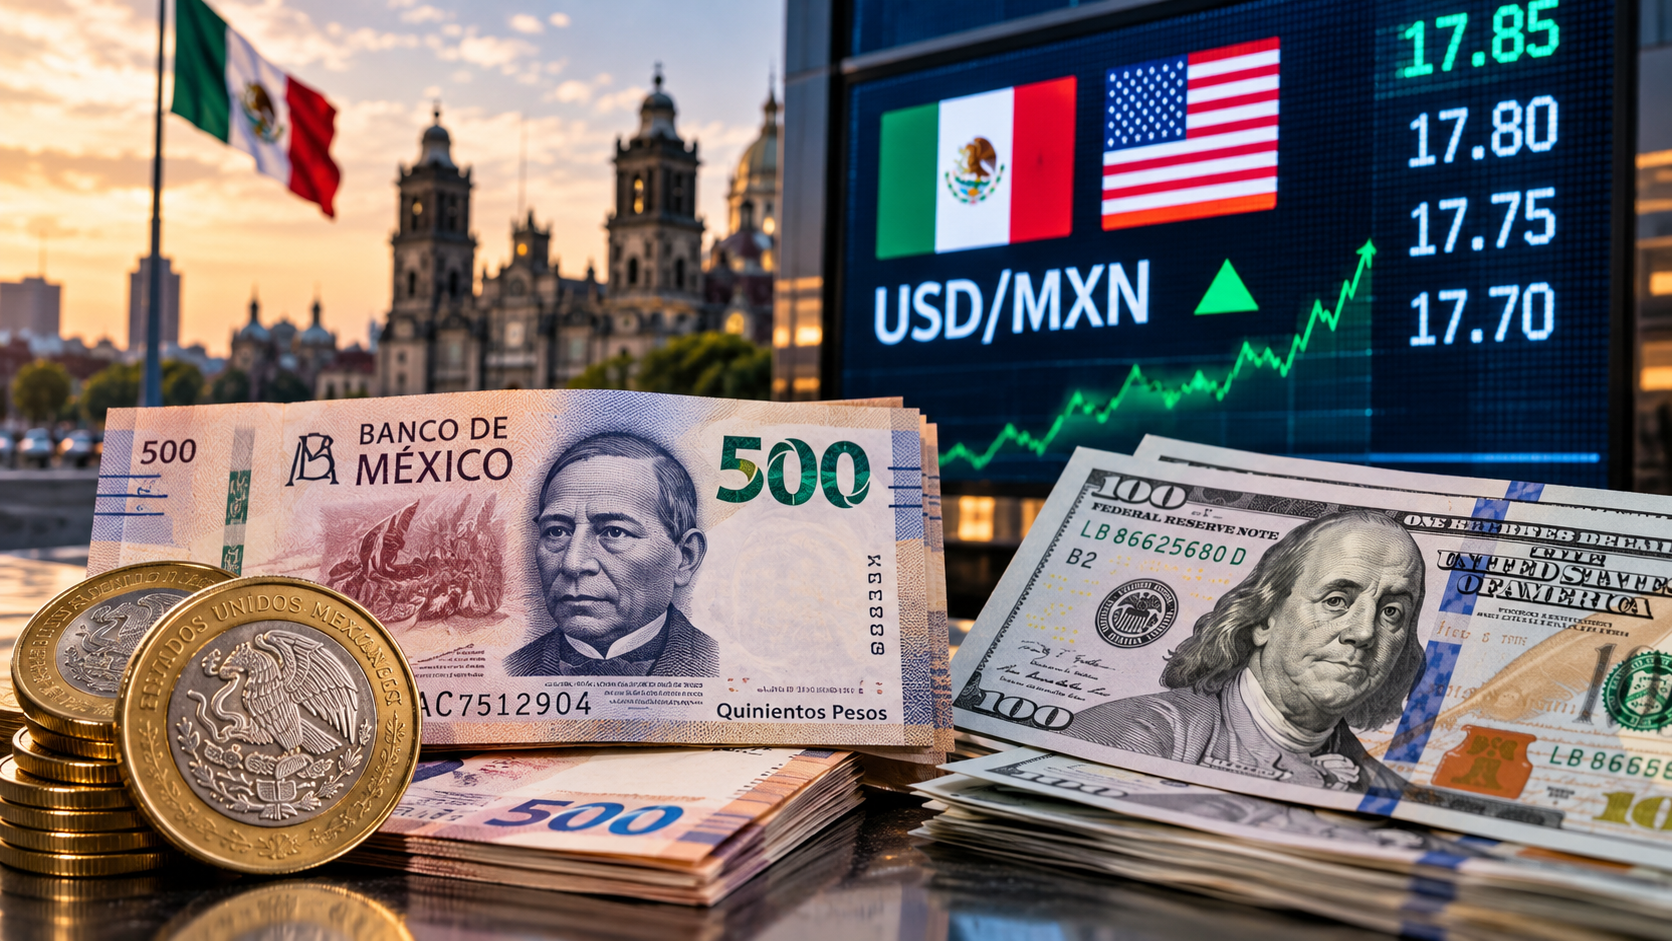
USD/MXN measures pesos per U.S. dollar. Compare the live exchange quote with transfer fees and the actual peso amount delivered, rather than relying on a headline rate. Research cutoff: October 12, 2026; confirm developing facts before publication.
What is happening and why readers are searching
The peso mexicano versus dólar estadounidense question is not just about a currency quote. It is about how many pesos arrive after an American sends money, what a Mexican importer pays in dollars and how a trader interprets movements in USD/MXN. As of October 12, the U.S. dollar is drawing support from geopolitical risk and expectations surrounding the next American inflation report, although that broad dollar trend cannot alone establish the peso’s intraday direction. Sources: Reuters currency coverage and BLS CPI.
The important context competitors can overlook
USD/MXN measures pesos per U.S. dollar: when the number rises, the dollar strengthens against the peso; when it falls, the peso gains. Mexico’s interest rates, inflation, trade flows, risk appetite and the relative direction of Federal Reserve policy all matter. Remittance services add a second layer: the advertised exchange rate and the transaction fee can change the amount a family receives even if the interbank quote is unchanged. For primary-source checks and current reporting, see Reuters currency coverage and World Trade Organization. The key distinction is separate fx price, bank spread and transfer cost.
A practical way to use this information
For a remittance, request an all-in quote from at least two providers at the same time and compare the final MXN delivered, not the headline “zero-fee” claim. For business invoices, set a clear payment date and decide whether locking a rate is worth the cost. For market commentary, label the observation time and data source; never publish an unverified live USD/MXN price or a one-way prediction as a fact.
The remittance calculation that matters
Suppose a provider quotes 18.00 pesos per dollar and charges a $5 fee on a $500 transaction. If the fee is deducted from the sending amount, the recipient would receive 495 × 18.00 = 8,910 MXN. A competing provider might quote 17.90 with no fee, delivering 8,950 MXN. These are invented teaching rates, not October 2026 exchange quotes. The second provider wins this narrow example even though its quoted exchange rate looks worse.
This is why a reader searching peso mexicano may need more than a Reuters market chart: the consumer question is about the effective rate. State fees, settlement speed and delivered pesos together, and use a current live provider quotation before publishing a recommendation.
What to verify before making a decision
The right next step is to identify the source, timestamp and applicable market or jurisdiction. Check whether a number is a historical observation, official announcement, target, forecast or scenario. If you intend to act financially, legally or commercially, use the relevant provider’s current terms and obtain professional advice where appropriate. The sources cited here establish context; they are not a substitute for live prices, individual eligibility checks or binding agreements.
Reader questions
Does a rising USD/MXN mean a stronger peso?
No. More pesos per dollar indicates a weaker peso relative to the U.S. currency.
Is the mid-market exchange rate what customers receive?
Usually not; providers may add a spread or fee.
How to read USD/MXN without reversing the direction
USD/MXN is conventionally quoted as the number of Mexican pesos required to purchase one U.S. dollar. If the quote rises from a hypothetical 18.00 to 18.50, the dollar has strengthened against the peso: one dollar buys more pesos. If it falls to 17.50, the peso has strengthened because fewer pesos are needed to buy a dollar. The exchange rate can change during the day, so comparisons should specify the timestamp, data provider and whether the quote is a wholesale mid-market price or a consumer rate.
The inverse quote, MXN/USD, tells a different story in presentation but describes the same relationship. A casual reader may see a number move downward and call it a “currency crash,” even though that direction means peso appreciation in the USD/MXN convention. Explaining the quote first prevents misleading conclusions in headlines, charts and transfer decisions. For monetary-policy background, compare official material from Banco de México and the Federal Reserve.
Interest-rate differences are important, not decisive
A higher Mexican policy rate relative to the U.S. rate can make peso-denominated assets attractive to some international investors. The appeal depends on expected exchange-rate moves, transaction costs, risk appetite and access to local instruments, not simply a subtraction of headline interest rates. If investors fear abrupt currency depreciation or escalating global conflict, the apparent interest-rate advantage may be overwhelmed by the exchange-rate loss. Expectations about future central-bank decisions often move the market before either institution changes its benchmark rate.
Mexico’s economic connections to the United States complicate any simple theory. Manufacturing exports, remittances, tourism receipts, foreign investment and import payments create flows into and out of pesos. A slowing U.S. economy could affect Mexican exporters while simultaneously altering expectations for U.S. rates. The peso may therefore respond to employment, trade and geopolitical news in ways that do not align neatly with the daily dollar index. Currency forecasts should acknowledge competing drivers rather than state a one-way outcome as inevitable.
The real cost of sending money to Mexico
A remittance comparison must combine the fee and the provider’s exchange rate. Suppose someone sends $500 when an illustrative mid-market exchange rate is 18.00 pesos per dollar. Before charges, the theoretical value is 9,000 pesos. Provider A offers 17.75 and charges $4; if the fee is deducted from the amount exchanged, the recipient receives 496 × 17.75 = 8,804 pesos. Provider B offers 17.85 with an $8 deducted fee, yielding 492 × 17.85 = 8,782.20 pesos. The provider advertising the better exchange rate does not necessarily deliver the larger amount.
This comparison is hypothetical and ignores any receiving-bank deductions. For genuine comparisons, require a final “recipient gets” figure at the same moment and for the same payment method. Some providers promote the first transfer, then use different rates afterward. Others offer faster delivery at a higher cost. The family receiving the funds should also check whether a mobile-wallet, bank-account or cash-pickup method suits its needs and whether the quoted conversion remains locked until delivery.
A simple scenario map for consumers and companies
Consider three scenarios rather than a single USD/MXN prediction. In a calmer global market, investors might place more weight on Mexican yields and economic fundamentals. During a global risk-off event, a rush toward dollar liquidity may dominate even if Mexican domestic indicators have not materially changed. Under a sharp change in U.S.-Mexico trade expectations, importers and exporters could adjust demand for foreign currency independently of speculative flows. The probability and timing of these scenarios cannot be read directly from a single chart.
An importer paying suppliers in dollars generally benefits from a stronger peso when other variables are unchanged; a Mexican exporter receiving dollars can face the opposite currency translation. A U.S. family sending dollars to Mexico usually receives fewer pesos when the peso strengthens, although improved purchasing power or local inflation trends may change how far those funds go. Each reader must identify which side of the exchange is relevant before deciding whether a move is favorable.
Before exchanging or transferring
Write down the amount, recipient currency, exact provider fee, offered exchange rate, receipt deadline and whether cancellation is allowed. Compare at least two actual all-in quotes, not screenshots taken hours apart. If the funds are needed for rent or medical treatment, certainty of delivery may outweigh a marginal rate improvement. Traders should separately consider position sizing, liquidity and overnight risk; a retail-remittance guide is not a strategy for leveraged currency speculation.
For updated context, consult a current Banxico economic release alongside verified currency-market reporting. An article can explain currency mechanisms for months, but a quoted USD/MXN price without a fresh timestamp can mislead within minutes.
Discover more from The Economy
Subscribe to get the latest posts sent to your email.


Markets & Finance
Stock Market Crash in 2026? Warning Signs, Scenarios and a Calm Investor Checklist
A stock market crash is a scenario to prepare for, not an event that can be declared merely because a few technology stocks fall. Reuters reported on October 12 that the S&P 500’s 2026 advance was relatively narrow, with more than four in ten constituents down for the year even as the benchmark had gained. That is a market-breadth warning worth analyzing, but it does not by itself prove that a crash is imminent. Sources: Reuters market breadth and Reuters bond market analysis.
The important context competitors can overlook
Watch the relationship among corporate earnings, long-term Treasury yields, credit conditions and the durability of AI spending. Higher yields can pressure expensive growth shares by raising discount rates, yet resilient earnings can offset part of that effect. It is important to distinguish a routine pullback, an index correction and a systemic crisis. None is the same as an unavoidable recession, and exact timing forecasts are notoriously unreliable. For primary-source checks and current reporting, see Reuters market breadth and Investor.gov. The key distinction is turn fear-driven headline into evidence-led risk analysis.
A correction, a bear market and a crash describe different price events. No single indicator can reliably predict a market collapse; portfolio resilience is more actionable. Research cutoff: October 12, 2026; confirm developing facts before publication.
A practical way to use this information
For a household, start with the financial plan: maintain cash needed soon, review whether holdings are excessively concentrated, check investment fees and avoid leveraged bets on a headline. A retiree drawing income has different exposure to early losses than a worker contributing for decades. Stress-test an illustrative decline, confirm how much would need to be sold, and document rebalancing rules before volatility arrives.
Crash risk or ordinary volatility? A four-part test
| Question | Evidence to gather | Why it matters |
|---|---|---|
| Is the weakness broad? | Number of stocks falling, sector breadth | A few giant companies can hide weaker participation |
| Is financing tightening? | Treasury yields and credit spreads | Borrowing stress can amplify selling |
| Are profits weakening? | Earnings revisions and guidance | Valuation may need to reset if cash flows disappoint |
| Is your plan fragile? | Near-term withdrawals and concentration | Personal exposure differs from market headlines |
The October 12 Reuters breadth report supports asking these questions, not publishing a certain crash date. Always specify what would falsify an alarming thesis.
What to verify before making a decision
The right next step is to identify the source, timestamp and applicable market or jurisdiction. Check whether a number is a historical observation, official announcement, target, forecast or scenario. If you intend to act financially, legally or commercially, use the relevant provider’s current terms and obtain professional advice where appropriate. The sources cited here establish context; they are not a substitute for live prices, individual eligibility checks or binding agreements.
Reader questions
Is there a confirmed market crash today?
The cited October 12 evidence describes market concentration and risk, not a confirmed broad-market crash.
Which signal should investors watch first?
No single metric works; consider breadth, earnings, funding conditions and your own time horizon together.
What would distinguish a correction from a crash?
Market vocabulary matters. A correction is commonly used to describe a broad decline of roughly 10% from a recent peak, while a bear market often refers to a fall of about 20%. “Crash” has no universally binding numerical definition; it often describes an unusually fast and disorderly fall. Those labels summarize price behavior but do not diagnose the economic cause. A 3% decline after a strong rally can feel alarming, especially in speculative stocks, yet it should not automatically be promoted as evidence that the entire market has entered crisis.
A more useful question is how many securities participate in a decline. Indexes weighted by company size can hide weakness beneath headline levels. When a handful of companies account for much of an index’s gains, weakness in smaller constituents may go unnoticed. Still, narrow breadth alone is not a reliable crash clock. It should be assessed together with earnings expectations, credit conditions, unemployment trends and funding-market stress. For real-time broad-market reporting, prefer clearly time-stamped sources such as Reuters.
Four risks investors can measure instead of guessing
Valuation risk: expensive shares can be vulnerable when projected growth disappoints or discount rates rise. Compare the valuation measure with realistic earnings scenarios rather than treating one ratio as a verdict. Concentration risk: calculate how much of a portfolio depends on a few stocks, industries or factors. Two funds can appear diversified while holding many of the same underlying companies. Liquidity risk: an investment may be difficult to sell near a quoted price during stress. Leverage risk: borrowed money and margin calls can turn an ordinary setback into a forced sale.
These risks interact. A portfolio concentrated in highly valued growth companies, financed partly with leverage, may be more fragile than a broadly diversified portfolio even if both posted similar returns last year. Conversely, a company with strong cash generation does not become risk-free merely because its balance sheet is healthy. Markets can reprice excellent businesses when required returns change. Good analysis distinguishes possible loss mechanisms from unsupported claims that a specific collapse is certain.
A stress test that does not require forecasting the market
Assume a household has $40,000 invested, needs $8,000 for tuition within nine months and can tolerate a temporary paper loss of $5,000. If a 20% market decline cut the account to $32,000, selling $8,000 for tuition would lock in a portion of the loss and leave less capital to recover. The important weakness is not the prediction of a 20% decline; it is using a volatile portfolio to fund a near-term unavoidable expense. A dedicated cash reserve can reduce that timing risk, though cash also has inflation and opportunity costs.
For longer-term savers, test the impact of several hypothetical market drops against current asset allocation and future contributions. Ask whether the household could maintain essential spending and avoid forced selling. This is more constructive than changing a retirement strategy in reaction to an intraday headline. It is also useful to review emergency liquidity, high-interest debt and insurance arrangements before increasing exposure to volatile investments.
Why an economic slowdown is not the same as a stock crash
GDP data, employment, consumer spending and corporate earnings influence markets, but share prices reflect expectations about the future. Stocks can fall ahead of a recession, rise while the economy is still weak or remain volatile without a recession occurring. Monetary policy can affect both discount rates and borrowing costs; its influence is important but not mechanically predictable. Financial news should not confuse a large move in Treasury yields with a confirmed default, or a disappointing earnings report with proof of an economy-wide breakdown.
Investors should separate observations from hypotheses: “credit spreads widened” is measurable; “credit spreads guarantee a crash next month” is speculative. Charts become more trustworthy when they show units, beginning and ending dates, and data sources. A scary percentage without a reference period may exaggerate or disguise risk.
Questions to ask before making portfolio changes
- What is the time horizon for this money and what spending does it need to cover?
- How concentrated is the portfolio in equities, technology or a single employer?
- Is there borrowing, margin exposure or a short-term cash obligation?
- Did the market move because of confirmed data, policy news or unverified speculation?
- Would a proposed trade still make sense if the market recovered tomorrow?
A clear checklist cannot eliminate losses. It can, however, keep a stressful search for “stock market crash” from turning into a decision based on a sensational headline alone.
Discover more from The Economy
Subscribe to get the latest posts sent to your email.
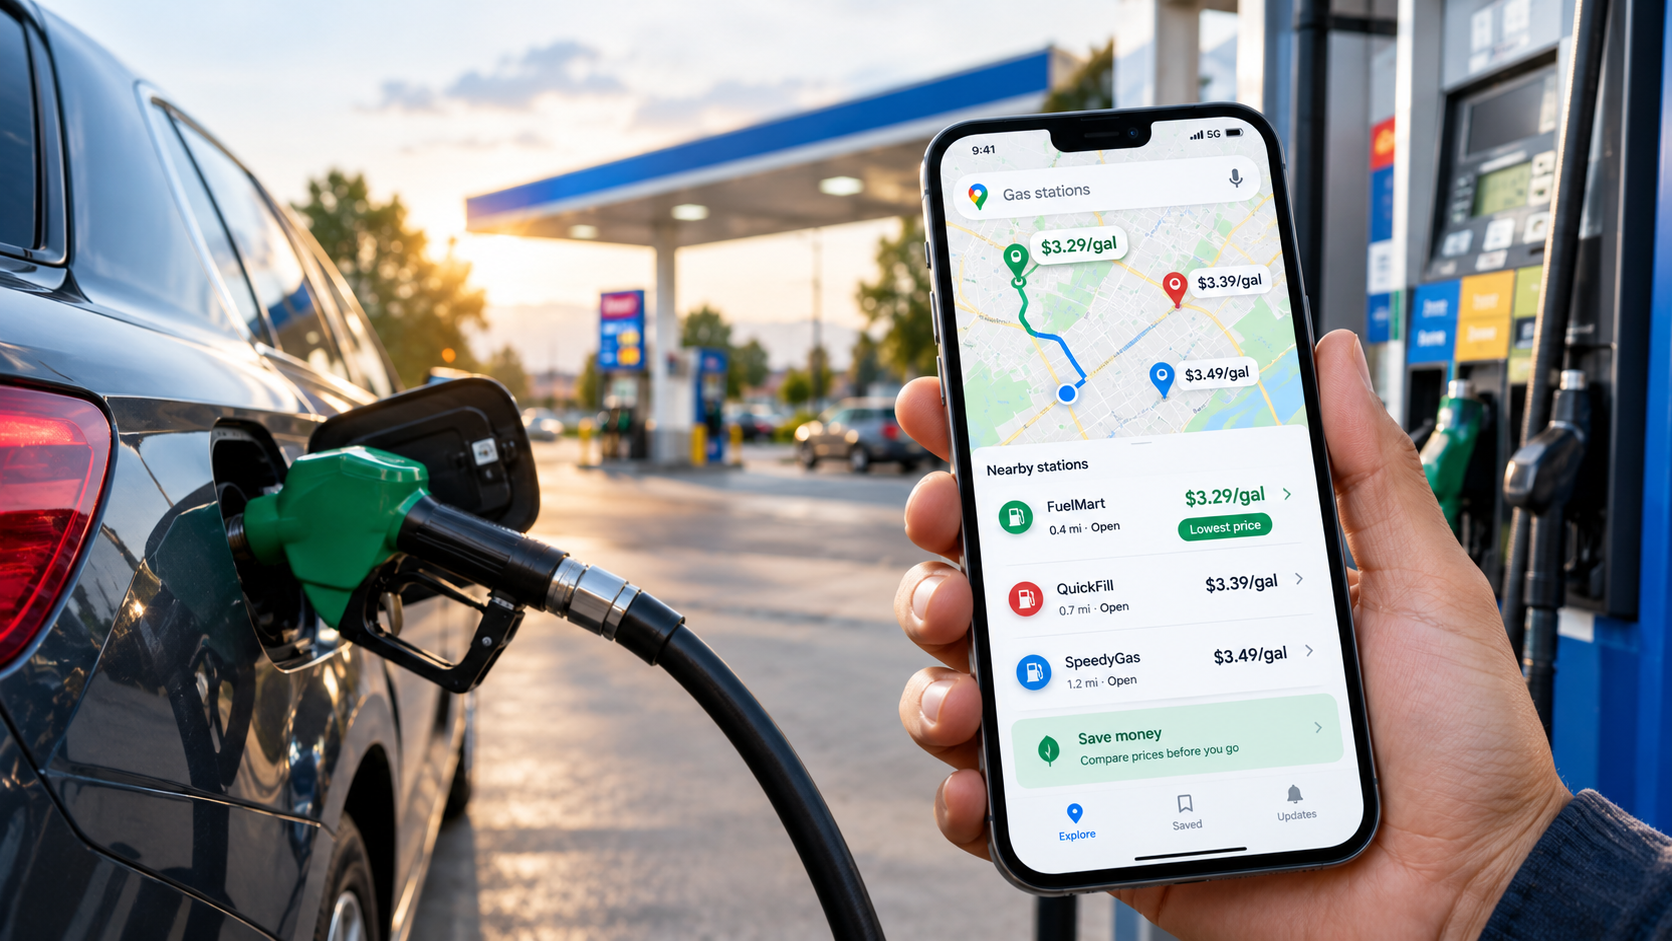
Google Maps shows gas prices at nearby stations, but its data isn’t truly real-time. Here’s how to use the feature, check accuracy, and cut fuel costs.
Key Takeaways
- Google Maps lists gas prices for nearby stations on Android, iOS, and desktop. Tap the gas option, or search “gas” in the search bar.
- Prices come from Google, not from drivers. Users cannot edit them, so accuracy depends on how quickly stations’ prices reach Google.
- Google says its fuel data is updated every 24 hours, so it cannot show the price at a pump at this moment.
- The US national average was $4.41 a gallon on October 1, 2026, according to AAA, up from $3.16 a year earlier. Savings matter more now than they did a year ago.
- Combine the map with AAA’s price tracker and the eco-friendly route setting to find cheaper fill-ups and trips.
Search Intent Summary
People searching this topic want to find the cheapest gas nearby and to know whether the prices they see are trustworthy. This guide shows how the feature works, where its data comes from, and how to use it alongside other sources.
A Note on “Real-Time” Fuel Prices
The phrase “real-time” overstates what Google Maps offers. Google’s Maps prices are shown by Google and are not user-editable. A reviewer testing the feature in 2025 found that major brands such as BP, Shell, and Speedway matched GasBuddy and the stations’ own prices, but some stations updated slowly, especially for grades other than regular, and some stations showed no prices at all.
A Google spokesperson also told a local TV station that the app’s data is updated every 24 hours. Prices can therefore lag behind what a station posts on its sign, and a price shown in the morning may be out of date by afternoon. Treat the map as a comparison tool for finding the cheaper area, then confirm the price at the pump.
How to Find Gas Prices on Your Phone
On Android and iOS, open Google Maps and tap the gas tile under the search bar. The app will show stations near you. Tap a station to see its details, including the listed price.
To look farther away, move the map to a new area and tap “Search this area.” Not every station displays a price, so you may need to scroll through the list. Tapping “View list” lets you compare several stations at once, which is faster than checking pins one by one.
If you already know which station you want, search for its name and tap its listing. The price appears in the station’s details, and you can see how far it is from your location.
How to Find Gas Prices on Desktop
On desktop, search for “gas” or “gas stations near me.” The station icons appear on the map, but prices are not always displayed next to the pins. Click a station to open its information panel, where the price is shown.
Desktop is useful for planning. If you are leaving for a trip, search the destination town or your route’s stops before you leave, so you can decide where to fill up.
Comparing Prices Without Getting Fooled
A cheap-looking price can still cost you more if the station is out of your way. Before choosing a station, check three things.
Distance matters. A five-cent saving on a station two miles away may not be worth the detour. Work out the difference on your tank size: a $0.20 gap on a 15-gallon fill-up is $3.00, which may or may not cover the extra driving.
Grade matters. Some stations show prices for regular only. Premium or diesel prices may be missing or slower to update.
Timing matters. Prices often change through the day, and stations may raise prices after a wholesale increase. Check the map in the morning, then confirm at the pump.
Cross-Check With Trusted Sources
For a reliable benchmark, check the AAA gas price tracker, which publishes daily national and state averages. On October 1, 2026, AAA reported a national average of $4.41 for regular unleaded, down about 7 cents from the previous week. September’s monthly average of $4.33 was the highest September figure on record. AAA attributed the easing to crude oil prices dipping back into the $90 range.
The Energy Information Administration publishes weekly retail gasoline prices, which are useful for tracking longer trends. A station’s price is best confirmed at the station itself, but these sources tell you whether the price you are seeing is high or low for your area.
Crowd-sourced apps such as GasBuddy can add station-level detail, but their data is user-submitted, so compare it against Google Maps and the station’s sign.
Use the Eco Route to Cut Fuel Use
Fuel costs depend on how much you burn, not just what you pay per gallon. Google Maps offers an eco-friendly route option that favors more fuel-efficient driving. The eco option is on by default for many users, so check that it is still enabled before you plan a trip.
Google has said that a fuel-efficient route typically adds one to two minutes to a trip and can save five to ten percent on gas. The savings depend on traffic, road type, and the vehicle, so treat the figure as an estimate.
A simple example shows the scale. Suppose a 300-mile trip in a car that gets 25 miles per gallon. That uses 12 gallons, or about $53 at $4.41 a gallon. A 5 to 10 percent saving is roughly $2.65 to $5.30. Those are hypothetical numbers, but they show that a short detour and a route change can add up across a year of driving.
Practical Strategy for Saving on Gas
Start with the map to find the cheapest station in your area. Confirm the price with the station’s sign before filling up, since the map can lag behind changes.
Compare prices in clusters rather than single stations. If several stations near a highway interchange charge less than the rest, that is a stronger signal than one outlier.
Use the eco route on longer trips, and avoid detours that cost more in fuel than they save at the pump. For a regular commute, the cheapest station on your route is often the best choice.
Keep an eye on the AAA and EIA averages. If your local price is well above the national average, you may be able to save by filling up at a station in a different city or zone.
Future Outlook
Gas prices are tied to crude oil, and crude is tied to the conflict affecting shipping routes in the Middle East. Prices have risen sharply this year, and they have also eased at times. The most useful habit is checking prices regularly rather than waiting for a spike to appear, since station prices can move quickly in both directions.
Frequently Asked Questions
Is Google Maps gas price data real-time?
No. Google says its fuel data is updated every 24 hours, and some stations’ prices update more slowly than others. Use the map to compare nearby options, then confirm the price at the station.
Why do some gas stations not show prices on Google Maps?
Not every station displays a price. Stations may not share prices with Google, or the data may be missing for certain fuel grades. Check the station directly or use a second source.
Can I edit a gas station’s price on Google Maps?
No. Prices on Google Maps are controlled by Google and cannot be edited by users. If a price looks wrong, the station’s posted price at the pump is the most reliable source.
Does the eco route really save gas?
Google says an eco route can save five to ten percent on fuel with a small extra travel time. Actual savings depend on traffic, road conditions, and your vehicle. It is a useful default, but it is not a guarantee.
Discover more from The Economy
Subscribe to get the latest posts sent to your email.
Fintech & Global Finance
Global Market Outlook: Navigating Interest Rates, Inflation, and Commodity Spikes

Central banks are now raising rates, not cutting them, as oil tops $100. Here’s where the Fed, ECB, inflation, and crude stand, and what to watch next.
Key Takeaways
- The Federal Reserve raised its target range by 0.25 percentage points on September 16, 2026, to 3.75% to 4.00%. It was the first US hike in several years.
- The European Central Bank has raised rates twice this year, most recently on September 10, bringing its deposit rate to 2.50%.
- US headline inflation was 3.4% year over year in August 2026, with core inflation at 2.4%. The energy component is the main reason headline inflation is above core.
- Brent crude traded above $100 a barrel in early September and was at $100.53 on October 6, after rising more than 30% from early-August lows.
- The main driver is a supply shock tied to the conflict involving Iran, which has disrupted shipping and energy infrastructure. Monetary policy is responding to that shock, not to weak growth.
Search Intent Summary
Readers searching for a global market outlook want to know three things: where interest rates are heading, whether inflation is coming back, and what commodity prices mean for their money. This article covers the current policy settings, the inflation data behind them, and the oil shock driving both.
The Policy Shift: From Cuts to Hikes
Through much of 2025, the Fed was cutting rates. It delivered three consecutive cuts in the second half of that year and then paused. Through the first eight months of 2026, the Fed held at 3.50% to 3.75%, with at least one official dissenting in favor of a hike at the July meeting.
The Fed’s September 15 to 16 meeting changed the picture. The committee raised the target range by 25 basis points, to 3.75% to 4.00%, and the Federal Reserve’s published calendar and statements confirm the meeting schedule. The updated projections point to roughly one more quarter-point increase before year-end, according to secondary analysis of the Fed’s September summary of economic projections. Readers should check the Fed’s own projections table rather than relying on summaries.
Europe moved first. The ECB raised its deposit rate in June, its first hike since September 2023, and again on September 10, to 2.50%. Its main refinancing rate is now 2.65%, and the marginal lending rate is 2.90%. The ECB said it is not committing to a fixed path and will decide meeting by meeting.
The message from both central banks is consistent. Inflation has moved above target because of energy, and the risk is that it becomes entrenched. Cutting rates into an energy shock would be the opposite of what policymakers want to do.
The Inflation Picture
US consumer prices rose 3.4% over the year to August 2026, unchanged from July. The peak this year was 3.8% in April. Monthly headline CPI rose 0.4% in August, with energy up 2.1%.
Core inflation, which excludes food and energy, eased to 2.4% year over year, the lowest reading since March 2021. Core CPI rose 0.3% in August alone, above the 0.2% consensus, which is why markets read the report as hawkish. Real average hourly earnings fell 0.3% over the year, meaning wages are losing ground to prices.
The eurozone shows a similar pattern. Euro-area inflation reached 3.3% in August, its highest since 2023, with energy the main driver. Excluding energy, inflation was about 2.2%. The ECB’s own projections put headline inflation averaging 3.0% in 2026, falling toward 2.5% in 2027 and 2.1% in 2028.
That split matters. When energy drives inflation and core stays contained, central banks face a dilemma. Hiking rates does little to lower oil prices, but it can slow growth and tighten financial conditions.
The Oil Shock
Brent crude is the single biggest variable in this outlook. Brent rose above $100 on September 9, touched $106.60 on September 10 during a 5% one-day jump, and was trading at $100.53 on October 6. Reporting from Khaleej Times attributed the spike to the biggest wave of attacks on shipping since the conflict began, along with the failure of hopes for a lasting ceasefire.
The conflict is now around six months old. The International Energy Agency’s August forecast projected global oil supply falling by about 4.3 million barrels a day in 2026, roughly 4%. OPEC, by contrast, has cut its forecast for world oil demand growth for a fifth straight month, which shows the market is pricing supply risk more than demand strength.
The supply and demand picture is tight. Analysts quoted in September described a “prolonged new normal” in which disruption risk is persistent rather than occasional, and noted limited spare production capacity. The Strait of Hormuz is the key chokepoint in that analysis.
Bond Markets and the Dollar
Rates have moved beyond the policy decisions themselves. Ten-year US Treasury yields reached their highest level since 2023 in early September, and Germany’s ten-year Bund yield hit its highest since 2011 after the ECB decision. That means borrowing costs are rising for governments and households alike, including mortgages.
For the currency picture, the dollar’s direction depends on how the Fed and ECB diverge. The ECB’s deposit rate now sits about 1.00 to 1.25 percentage points below the US range, a gap that generally favors the dollar. If the ECB hikes further than the Fed, that gap narrows. Watch the rate differential, not just the level of rates.
Scenarios for the Next Six Months
Rather than a single forecast, consider three paths. These are analytical scenarios, not predictions.
Base case: elevated energy, gradual hikes. Oil stays above $90 with periodic spikes, inflation hovers around 3%, and the Fed and ECB make one or two more moves before pausing. Bond yields stay high, and rate-sensitive sectors such as housing remain under pressure.
Escalation: oil moves higher and sticks. A sustained disruption pushes Brent well above $100, headline inflation rises again, and central banks face a choice between tightening further and accepting above-target inflation. This is the scenario that most threatens growth.
De-escalation: a durable ceasefire. Oil falls back, headline inflation eases through the rest of the year, and markets start pricing rate cuts again. Earlier in 2026, the Fed’s own projections showed cuts were possible, and a credible ceasefire could revive that path.
The swing factor is the conflict, not the data. Monthly inflation prints matter, but energy prices can overwhelm any single report.
Practical Strategy: What to Watch
For investors, the immediate indicators are the monthly CPI release, weekly oil inventory data, and any shipping disruption news from the Strait of Hormuz. Watch the 10-year Treasury yield as a gauge of financing costs across the economy.
For households and businesses, the practical takeaways are straightforward. Fixed-rate borrowing costs have risen and may stay high. Energy budgets need a buffer. Variable-rate debt is more exposed to further hikes than fixed-rate debt.
For policy watchers, the ECB’s next scheduled decision falls on October 29, and the Fed’s next meeting date is listed on its calendar. Each decision will reflect the most recent inflation and energy data.
This article offers general market context and is not investment advice. Consider speaking with a licensed financial adviser before making decisions based on these trends.
Future Outlook
The regime has changed. Two years ago, the debate was about how fast central banks would cut. Today it is about how far they will hike, and whether energy inflation spreads into wages and services. Core inflation is currently contained, which gives policymakers room to wait. That room shrinks if oil stays above $100 for months.
Frequently Asked Questions
Why are central banks raising rates instead of cutting them?
Inflation is above target in both the US and eurozone, and energy prices are the main driver. Raising rates is intended to keep higher energy costs from spreading into wages and prices across the economy. Both central banks have said decisions will depend on incoming data.
Is inflation falling?
Headline US inflation has eased from a 3.8% peak in April to 3.4% in August, and core inflation is at its lowest level since 2021. However, headline inflation is still well above the Fed’s 2% target, and eurozone inflation rose in August. Whether the trend continues depends largely on energy prices.
How high is oil right now?
Brent traded at $100.53 on October 6, 2026. Oil prices move daily, so check a current quote before relying on any figure. Prices have been volatile since the conflict escalated in early September.
Will interest rates fall in 2026?
The Fed’s September projections point to roughly one more increase by year-end rather than cuts. Market expectations change with each data release and each development in the conflict. Check the Fed’s latest statement and projections for the current outlook.
Discover more from The Economy
Subscribe to get the latest posts sent to your email.

Stock Market Crash in 2026? Warning Signs, Scenarios and a Calm Investor Checklist

Peso Mexicano vs Dólar Estadounidense: A Practical USD/MXN Guide for October 2026

Is the Stock Market Open on Columbus Day 2026? NYSE, Nasdaq and Bonds Explained

Concert Ticket Prices in 2026: Dynamic Pricing, Fees and How to Buy Safely

High-Yield Savings Accounts in 2026: How to Compare APY Without Chasing a Headline

EU-China Trade Deal 2026: How Beijing and Brussels Avoided a Trade War—and Who Wins

Social Security 2027 COLA Announcement: Date, Formula and What Retirees Should Check

China’s AI Microdrama Boom: How Beijing Is Reshaping Global Media

Q3 2026 Earnings Preview: Can Record Profit Expectations Keep Wall Street’s Rally Alive?

Russia Diesel Deal 2026: Oil Prices and Inflation Risks

Fed Rates 2026: Treasury Yields, Bonds and SGOV Explained

S&P 500 Market Breadth 2026: Weak Rally or Rotation?

The AI Capex Boom: Data Centers Reshaping Growth

Palantir Stock in 2026: Extraordinary AI Growth

PSX Forecast 2026: KSE-100, IMF Reviews & Geopolitics

Middle East War Economics 2026: Oil Prices & Energy Markets

China Stocks Today: Are Big Economies in Asia Nearing a Market Bottom?

Crypto Daily Outlook: Bitcoin, Altcoins, and the Future of Decentralized Finance

Global Pension Systems Ranked: The World’s Best and Worst Retirement Frameworks

World’s Largest Economies: Ranking the Top Global Powers

Elon Musk’s Next Moves: Disrupting the 2026 Global Economy

Pakistan Economy 2026: Inside the SBP’s Balancing Act

GasBuddy Market Insights: How Crude Price Shifts Impact Local Fuel Cost Averages

World Bank & IMF Reports 2026: Why the “3% Growth” Consensus Is Actually a Debate

Global Equity Market Divergence: US Tech vs. European Dividend Stocks vs. Asian Growth

IMF & World Bank Global Economic Outlook: Growth Forecasts Across Europe and Asia

Crude Oil & Petroleum Market Analysis: OPEC+ Decisions and Price Forecasts

Silver Price Today: Why the Xi-Trump AI Standoff Is Fueling a Safe-Haven Rally
-

 Markets & Finance9 months ago
Top 15 Stocks for Investment in 2026 in PSX: Your Complete Guide to Pakistan’s Best Investment Opportunities
-

 Analysis8 months ago
Johor’s Investment Boom: The Hidden Costs Behind Malaysia’s Most Ambitious Economic Surge
-

 Analysis8 months ago
Top 10 Stocks for Investment in PSX for Quick Returns in 2026
-

 Banks9 months ago
Best Investments in Pakistan 2026: Top 10 Low-Price Shares and Long-Term Picks for the PSX
-

 Analysis8 months ago
Brazil’s Rare Earth Race: US, EU, and China Compete for Critical Minerals as Tensions Rise
-

 Investment9 months ago
Top 10 Mutual Fund Managers in Pakistan for Investment in 2026: A Comprehensive Guide for Optimal Returns
-

 Global Economy10 months ago
15 Most Lucrative Sectors for Investment in Pakistan: A 2025 Data-Driven Analysis
-

 Global Economy10 months ago
Pakistan’s Export Goldmine: 10 Game-Changing Markets Where Pakistani Businesses Are Winning Big in 2025