
Economic Reforms
Pakistan Economy FY2027: IMF Reform, Debt and Recovery Outlook


Pakistan’s recovery is meaningful but conditional. The October IMF staff agreement is evidence of program progress, not proof that every disbursement has been approved or that structural weaknesses have been solved. This feature explains the mechanisms, risks and practical decisions that matter through 2027, with particular attention to Pakistan’s different exposure to energy prices, external financing, global trade and AI investment.
At a glance
- World output is forecast to rise, but opportunities and costs are uneven across countries.
- Global inflation forecasts do not predict household prices in Pakistan.
- The AI capital expenditure cycle lifts trade in electronics but may not translate into productivity gains everywhere.
- Pakistan’s IMF staff-level agreement is a milestone, not final Board approval.
- Stronger exports, competitive energy, fiscal credibility and skills are essential to durable growth.
The verified starting point: what the numbers actually say
The IMF October 2026 World Economic Outlook projects global growth of 3.1% in calendar 2026 and 3.4% in calendar 2027, alongside global headline inflation of 4.7% and 4.1%, respectively. Its statistical cutoff is 1 October 2026. The WTO October 2026 trade outlook projects merchandise trade volume growth of 3.9% in 2026 and 4.1% in 2027, versus commercial-services trade volume growth of 3.3% and 6.4%. These are forecasts from different statistical systems, not interchangeable growth measures.
For Pakistan, the IMF Pakistan October 7 staff-level agreement estimated FY2026 growth of 3.6%, September headline inflation of approximately 10.3%, and gross reserves near $21.5 billion at end-September. The fourth EFF review and third RSF review had reached staff-level agreement only, pending IMF Executive Board approval as of the release. Pakistan’s fiscal years run July–June; IMF global growth figures refer to calendar years.
| Indicator | 2026 | 2027 | Important distinction |
|---|---|---|---|
| IMF world GDP growth | 3.1% | 3.4% | Calendar-year projection |
| IMF world headline inflation | 4.7% | 4.1% | Global estimate, not Pakistan CPI |
| WTO goods trade volume growth | 3.9% | 4.1% | Real volume, not nominal trade value |
| WTO commercial services volume growth | 3.3% | 6.4% | Conditional rebound, not guaranteed |
The World Bank June 2026 Global Economic Prospects provides an earlier comparison framework, but its publication date and methodology differ from the October IMF and WTO releases. A thoughtful analysis should compare like with like and should never treat projections as realized outcomes. For a Pakistan-focused story, the crucial question is how global conditions enter domestic economic life.
Why this story matters now
The WTO October 2026 executive summary says AI-enabling goods accounted for 47% of year-on-year growth in the value of world merchandise trade during the first half of 2026. That does not mean 47% of all merchandise trade was AI-related. It identifies a contribution to growth, and in nominal value terms. The same source notes that AI-enabling goods trade rose 67% year-on-year in that period. These figures show how a narrow technology cycle can make global trade appear stronger even as other sectors struggle.
Meanwhile the Reuters October 2026 IMF annual meetings reports persistent concern about global financial risks, geopolitical disruptions and the uneven sharing of AI gains. The Reuters October 2026 Asian growth describes a region where technology investment supports some exporters while energy costs and higher yields challenge others. Pakistan is therefore exposed simultaneously to a potential technology opportunity and to more conventional fuel, financing and trade vulnerabilities.
What the October IMF staff agreement says
For what the october imf staff agreement says, An IMF staff-level agreement and formal Executive Board approval are separate milestones. Treating them as interchangeable can overstate the certainty of disbursements. Investors should follow the documented review process and the conditions for continued progress.
This matters for economic decision-making because firms and households cannot adjust instantaneously when conditions shift. Prices, contracts, worker skills and financial obligations move on different schedules. Analysts should identify the timetable, who bears the immediate cost, and who may capture the longer-term benefit.
A credible implementation plan requires named institutions, measurable indicators and regular public reporting. The point is not to promise an effortless transition; it is to make policy options concrete enough to compare their benefits and trade-offs.
Pakistan-specific decision test. For what the october imf staff agreement says, ask four questions: (1) Which import cost, export opportunity, credit channel or productivity constraint is affected? (2) Which groups face the first-round effects? (3) What could policymakers or firms change within six months? (4) Which published indicator would demonstrate improvement rather than merely announce activity?
What to monitor: (i) official monthly or quarterly data; (ii) movements in export receipts and import bills; (iii) price changes versus changes in physical volumes; (iv) borrowing and working-capital costs; and (v) job quality and household purchasing power. A single monthly reading can be noisy. Comparing several releases helps distinguish a trend from a short-lived disturbance.
The difference between staff and Board decisions
For the difference between staff and board decisions, Fiscal adjustment is durable only if it improves the state’s capacity to collect revenue fairly and deliver services efficiently. Repeatedly increasing taxes on the narrow formal base can undermine compliance while leaving structural leakages untouched.
This matters for economic decision-making because firms and households cannot adjust instantaneously when conditions shift. Prices, contracts, worker skills and financial obligations move on different schedules. Analysts should identify the timetable, who bears the immediate cost, and who may capture the longer-term benefit.
A credible implementation plan requires named institutions, measurable indicators and regular public reporting. The point is not to promise an effortless transition; it is to make policy options concrete enough to compare their benefits and trade-offs.
Pakistan-specific decision test. For the difference between staff and board decisions, ask four questions: (1) Which import cost, export opportunity, credit channel or productivity constraint is affected? (2) Which groups face the first-round effects? (3) What could policymakers or firms change within six months? (4) Which published indicator would demonstrate improvement rather than merely announce activity?
What to monitor: (i) official monthly or quarterly data; (ii) movements in export receipts and import bills; (iii) price changes versus changes in physical volumes; (iv) borrowing and working-capital costs; and (v) job quality and household purchasing power. A single monthly reading can be noisy. Comparing several releases helps distinguish a trend from a short-lived disturbance.
Understanding fiscal-year growth correctly
For understanding fiscal-year growth correctly, Macroeconomic stabilization also needs a growth engine. Without export productivity, improved energy management and credible private-investment conditions, recovery remains vulnerable to the next external financing squeeze.
This matters for economic decision-making because firms and households cannot adjust instantaneously when conditions shift. Prices, contracts, worker skills and financial obligations move on different schedules. Analysts should identify the timetable, who bears the immediate cost, and who may capture the longer-term benefit.
A credible implementation plan requires named institutions, measurable indicators and regular public reporting. The point is not to promise an effortless transition; it is to make policy options concrete enough to compare their benefits and trade-offs.
Pakistan-specific decision test. For understanding fiscal-year growth correctly, ask four questions: (1) Which import cost, export opportunity, credit channel or productivity constraint is affected? (2) Which groups face the first-round effects? (3) What could policymakers or firms change within six months? (4) Which published indicator would demonstrate improvement rather than merely announce activity?
What to monitor: (i) official monthly or quarterly data; (ii) movements in export receipts and import bills; (iii) price changes versus changes in physical volumes; (iv) borrowing and working-capital costs; and (v) job quality and household purchasing power. A single monthly reading can be noisy. Comparing several releases helps distinguish a trend from a short-lived disturbance.
Public enterprises and energy losses
For public enterprises and energy losses, An IMF staff-level agreement and formal Executive Board approval are separate milestones. Treating them as interchangeable can overstate the certainty of disbursements. Investors should follow the documented review process and the conditions for continued progress.
This matters for economic decision-making because firms and households cannot adjust instantaneously when conditions shift. Prices, contracts, worker skills and financial obligations move on different schedules. Analysts should identify the timetable, who bears the immediate cost, and who may capture the longer-term benefit.
A credible implementation plan requires named institutions, measurable indicators and regular public reporting. The point is not to promise an effortless transition; it is to make policy options concrete enough to compare their benefits and trade-offs.
Pakistan-specific decision test. For public enterprises and energy losses, ask four questions: (1) Which import cost, export opportunity, credit channel or productivity constraint is affected? (2) Which groups face the first-round effects? (3) What could policymakers or firms change within six months? (4) Which published indicator would demonstrate improvement rather than merely announce activity?
What to monitor: (i) official monthly or quarterly data; (ii) movements in export receipts and import bills; (iii) price changes versus changes in physical volumes; (iv) borrowing and working-capital costs; and (v) job quality and household purchasing power. A single monthly reading can be noisy. Comparing several releases helps distinguish a trend from a short-lived disturbance.
A scorecard for sustainable recovery
For a scorecard for sustainable recovery, Fiscal adjustment is durable only if it improves the state’s capacity to collect revenue fairly and deliver services efficiently. Repeatedly increasing taxes on the narrow formal base can undermine compliance while leaving structural leakages untouched.
This matters for economic decision-making because firms and households cannot adjust instantaneously when conditions shift. Prices, contracts, worker skills and financial obligations move on different schedules. Analysts should identify the timetable, who bears the immediate cost, and who may capture the longer-term benefit.
A credible implementation plan requires named institutions, measurable indicators and regular public reporting. The point is not to promise an effortless transition; it is to make policy options concrete enough to compare their benefits and trade-offs.
Pakistan-specific decision test. For a scorecard for sustainable recovery, ask four questions: (1) Which import cost, export opportunity, credit channel or productivity constraint is affected? (2) Which groups face the first-round effects? (3) What could policymakers or firms change within six months? (4) Which published indicator would demonstrate improvement rather than merely announce activity?
What to monitor: (i) official monthly or quarterly data; (ii) movements in export receipts and import bills; (iii) price changes versus changes in physical volumes; (iv) borrowing and working-capital costs; and (v) job quality and household purchasing power. A single monthly reading can be noisy. Comparing several releases helps distinguish a trend from a short-lived disturbance.
Policy options: three alternative paths, not numerical forecasts
| Scenario | Assumptions | Implications for Pakistan | Early warning or confirmation |
|---|---|---|---|
| More favorable | Energy costs stabilize; export markets remain open; AI use generates measurable efficiency | Space for investment, steadier purchasing power and stronger services exports | Export orders, real income and private investment improve together |
| Central case | Global growth follows the broad institutional outlook; commodity and funding pressures fluctuate | Gradual recovery with uneven gains across sectors | Stable external balances without a broad productivity surge |
| Adverse | Energy disruptions persist; financing costs rise; AI investment is repriced | Imports become more costly, credit tighter and fiscal choices harder | Reserves, inflation expectations and financing costs weaken at once |
These are qualitative editorial scenarios, not probabilities assigned by an econometric model. Their value lies in clarifying which evidence would require an updated judgment. The IMF October 2026 World Economic Outlook explicitly emphasizes downside risks involving conflict, trade tension, debt and reassessment of AI expectations.
A practical action agenda
For policymakers, the first responsibility is to protect hard-won macroeconomic stability while removing barriers to productivity. Regulatory predictability, tax administration, targeted social protection and transparent energy decisions are more useful than shifting incentives that are impossible for businesses to plan around. The IMF Pakistan 2026 country report identifies revenue mobilization, reform of state enterprises, energy-sector viability and improvements in human capital as linked policy priorities.
For exporters, resilience means identifying where demand is growing, investing in reliable delivery and obtaining credible certifications. Export strategies should track volumes, domestic value added and customer retention; gross receipts alone do not disclose profitability. For small businesses, the practical priority is to map exposure to fuel, electricity, imports and foreign-exchange requirements and to stress-test cash flows before making expansion commitments.
For households, risk management begins with an affordable budget, attention to debt servicing and a realistic distinction between nominal wage gains and purchasing power. For workers, portable skills and credible training can expand options across changing industries. None of this makes external shocks harmless; it simply offers concrete ways to be less exposed.
How this analysis differs from generic global coverage
Major international reporting is indispensable for establishing what happened. The Reuters October 2026 WTO briefing emphasizes the boost from AI to merchandise trade and the pressure of geopolitical disruption. Institutional releases provide detailed projections. This article goes a step further by asking how those macroeconomic signals might translate into local import costs, export competitiveness, employment, household budgets and reform choices. It is an interpretation of attributed evidence, not a claim of exclusive interviews or original field reporting.
The difference is particularly relevant for Pakistan because a global technology boom may coincide with higher costs for countries that import fuel but do not manufacture the equipment in highest demand. No serious strategy should assume that a worldwide headline rate automatically delivers the same benefits locally.
Frequently asked questions
What is the IMF’s global growth forecast for 2027?
The IMF’s October 2026 World Economic Outlook projects 3.4% global GDP growth in 2027, following 3.1% in 2026. These are calendar-year forecasts and may be revised as new data becomes available. See the IMF October 2026 World Economic Outlook.
Is global inflation expected to fall in 2027?
Yes, the October IMF forecast projects global headline inflation easing from 4.7% in 2026 to 4.1% in 2027. That describes the world aggregate and does not imply that prices in Pakistan will fall in absolute terms.
Is Pakistan’s latest IMF financing already approved?
The 7 October 2026 IMF release announced staff-level agreement for the fourth EFF and third RSF reviews, subject to Executive Board approval. The release should not be described as a completed Board decision. See the IMF Pakistan October 7 staff-level agreement.
Will AI investment create jobs in Pakistan?
It could create demand for implementation, software services and specialist support, while also changing tasks in existing occupations. The result depends on skills, investment, electricity reliability and competitive access to customers. No credible source guarantees a particular employment gain.
Does the WTO predict rapid growth in all kinds of trade?
No. Its October outlook differentiates merchandise volume growth from commercial-services volume growth and notes uneven performance by sector and region. Read the WTO October 2026 executive summary.
What should Pakistani companies monitor through 2027?
Export order books, input costs, electricity reliability, financing terms, exchange-rate conditions and customer demand are more operationally useful than a single global growth figure. Businesses should compare these against their own cash flows and margins.
Conclusion: the decisive issue is transmission, not the headline
Pakistan’s recovery is meaningful but conditional. The October IMF staff agreement is evidence of program progress, not proof that every disbursement has been approved or that structural weaknesses have been solved. The balance of risks is mixed: advanced technology can expand world production and trade, but it does not neutralize an energy shock or a financing squeeze. For Pakistan, policy credibility, internationally competitive exports and productivity-enhancing investment will determine how much of a fragile global expansion becomes better living standards at home.
Discover more from The Economy
Subscribe to get the latest posts sent to your email.


The global economic outlook in 2026 is best understood as a contest between forces that support production and forces that squeeze purchasing power. Investment can remain strong while families struggle with essential bills. Employment can look resilient while finding a better-paid job becomes harder. A growing economy does not automatically produce a comfortable household budget.
The International Monetary Fund’s July 2026 outlook summary describes uneven growth shaped by war-related headwinds and a technology investment upswing. More recently, Reuters reported UNCTAD’s forecast of 2.6% global growth in 2026, down from 2.9% in 2025. Those are forecasts from different institutions and publication dates, not interchangeable measurements.
The useful question is therefore broader than whether the world avoids recession. It is whether growth becomes more widely shared, financing becomes more affordable, and price pressures ease without a substantial loss of jobs.
Why global growth forecasts can disagree
Economic forecasts differ because their assumptions, information cutoffs and aggregation methods differ. One institution may place more weight on purchasing-power comparisons between countries, while another uses market exchange rates. A forecast incorporating a recent energy disruption can also look materially weaker than one completed months earlier.
Readers should compare the institution, publication date, forecast period and methodology before interpreting two numbers as a disagreement about the same thing. A revision is often evidence that circumstances changed, rather than proof that forecasting has no value.
The IMF’s October 2026 World Economic Outlook page was marked as forthcoming for 13 October when this article was researched. Its final forecasts should not be presented as already released on 10 October. Until publication, earlier estimates need their original dates attached.
The first pressure point: energy
Energy affects far more than petrol stations. Fuel prices influence freight, farming, aviation and industrial production. Electricity costs influence everything from supermarkets to data centres. Businesses may absorb some increases through lower margins, but persistent cost pressure can eventually reach customers.
The US Energy Information Administration’s October Short-Term Energy Outlook forecasts an average Brent price of $105 per barrel in the fourth quarter of 2026. That is a forecast average, not a live oil quotation. The agency links its outlook to constrained Middle Eastern flows and continuing uncertainty over physical supply.
The economic effect depends on duration. A brief spike can disrupt cash flow without changing long-term investment. A sustained increase can alter household spending, government subsidy costs and the economics of entire industries. Energy-importing countries face a different balance of risks from major exporters.
Inflation is a rate, while affordability is a level
A frequent source of confusion is the difference between slower inflation and lower prices. If a shopping basket rises from 100 to 110 and then to 113, inflation has slowed sharply in the second period. The basket nevertheless costs more than before.
That arithmetic helps explain why positive inflation headlines do not always improve public sentiment. Families compare current bills with remembered prices and their own incomes. They do not experience a national average directly. Renters, commuters, pensioners and parents can face very different spending pressures.
Wage growth matters, but its timing matters too. A pay increase received after several years of rising expenses may repair only part of the damage. Households can also carry debt accumulated during the squeeze. An improvement in monthly income therefore does not immediately restore savings or financial confidence.
Interest rates transmit the pressure unevenly
Central banks face a difficult distinction between temporary price shocks and inflation that spreads through the economy. Higher borrowing costs cannot create oil or repair a shipping route. They can, however, restrain demand and influence inflation expectations.
The consequences depend on how debt is structured. A household with a long-term fixed mortgage is less immediately exposed than one refinancing this year. A business with substantial cash reserves can react differently from a company dependent on short-term borrowing.
This creates a delayed adjustment. Some borrowers feel higher rates quickly; others only encounter them when existing contracts expire. Economic activity may therefore appear resilient before refinancing pressure becomes visible. For readers assessing the outlook, debt maturity schedules can be as revealing as headline policy-rate announcements.
AI investment supports demand before its full payoff arrives
Technology spending can lift economic activity through construction, equipment purchases, software development and specialist employment. Those effects occur before businesses demonstrate sustained productivity gains from the technology itself.
This distinction is especially relevant to artificial intelligence. Building computing infrastructure is an investment cycle. Producing more useful output with the same resources is a productivity improvement. The two can reinforce each other, but they are not identical.
McKinsey’s 2026 AI survey illustrates the gap: 80% of respondents reported better individual productivity, while 37% attributed some enterprise-level earnings impact to AI. These are survey responses, not a national productivity measurement. They support a cautious interpretation: adoption can advance faster than measurable financial returns.
Public debt changes the policy room available
When borrowing costs rise, governments with substantial refinancing needs face more difficult choices. Additional interest expenditure can compete with transport, education, health and other public services. Raising taxes or reducing spending may improve fiscal arithmetic while weakening demand in the short term.
Debt sustainability cannot be judged by one ratio alone. The currency of borrowing, maturity profile, investor base, growth prospects and institutional credibility all matter. A government borrowing mainly in its own currency has different vulnerabilities from one heavily dependent on foreign-currency debt.
For emerging markets, exchange-rate depreciation can magnify external repayment costs. It can also make imported fuel and machinery more expensive. The combination of energy exposure and foreign-currency financing deserves particular attention because two external pressures can arrive together rather than independently.
Three scenarios to watch
The following scenarios are analytical illustrations, not numerical forecasts. Their purpose is to connect observable developments with possible consequences.
In an improving scenario, energy supply becomes more reliable, price pressures moderate and business investment broadens beyond a narrow technology cluster. Household purchasing power recovers gradually, allowing consumption to strengthen without a renewed inflation surge.
In a prolonged squeeze, growth continues but essential costs remain elevated. Companies protect margins through restrained hiring and selective price increases. Consumers reduce discretionary spending, producing a divided economy in which strong sectors coexist with financially stretched households.
In a downside scenario, supply disruption combines with tightening financial conditions. Investment plans are postponed, credit losses rise and weaker demand spreads across borders. The important warning would be deterioration across several indicators, rather than a single alarming market session.
What households and businesses can monitor
Households gain more from tracking their own spending basket than from reacting to every national headline. Compare essential bills with take-home income, identify debts approaching a reset, and separate recurring expenses from unusual purchases. These observations make the economic outlook relevant to actual decisions.
Businesses can track order volumes, payment delays, customer cancellations and input costs alongside revenue. Nominal sales growth may simply reflect higher prices. A company that sells fewer units at higher prices is in a different position from one gaining customers and expanding output.
For both groups, the most useful signals are persistent changes. Several months of improving real income, healthier order books or easier financing are more informative than one strong report. Revisions should also be watched: an initially positive estimate can change as better information becomes available.
How to read the next major release
When a new forecast arrives, start with what changed. Was growth revised because demand strengthened, energy assumptions shifted or historical data were updated? Then examine the distribution across countries and the balance of risks. A stable global average can conceal substantial regional deterioration.
Check whether the report describes its central scenario as conditional on events that remain unresolved. Assumptions about trade, conflict and financing are part of the forecast, not background decoration. If those assumptions fail, the headline number may lose relevance quickly.
The strongest reading of the 2026 outlook is neither automatic optimism nor permanent crisis. Growth, affordability and financial resilience are separate tests. A durable improvement requires progress on all three, and readers should judge future releases by whether they show that progress reaching beyond aggregate statistics.
Discover more from The Economy
Subscribe to get the latest posts sent to your email.
Industory
Beyond Hanoi & HCMC: How Northern Industrial Clusters Are Driving Vietnam’s 10% Growth Surge
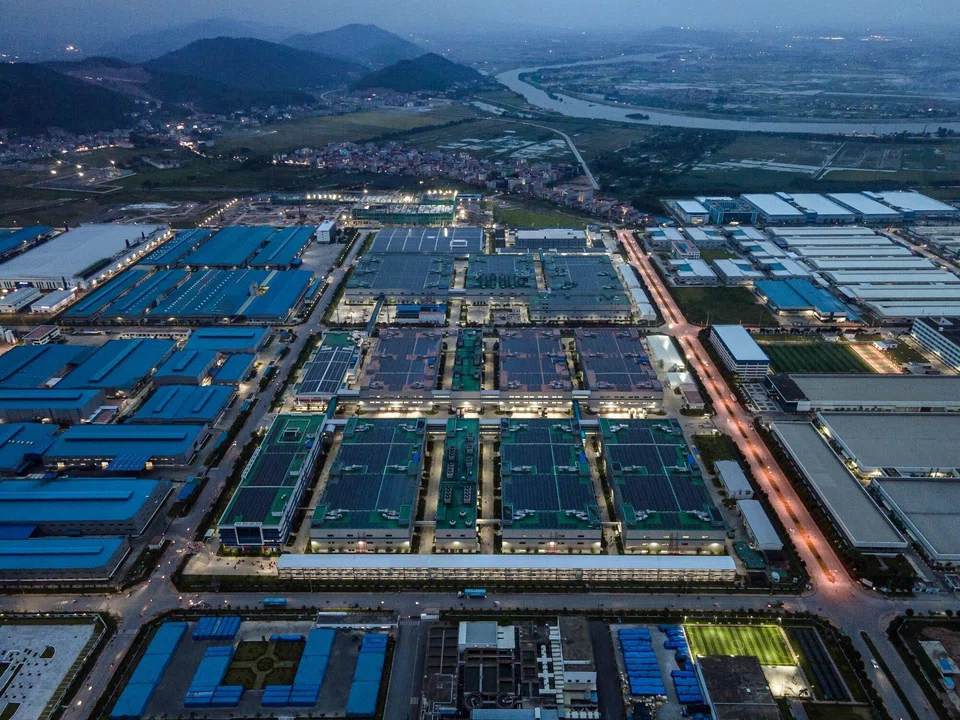
Vietnam’s economy is undergoing a structural transformation. While Tier-1 metropolitan hubs like Hanoi and Ho Chi Minh City maintain steady growth, a cluster of high-tech northern industrial provinces is driving the national economy toward a 10% annual GDP target.
According to official economic data tracked by the General Statistics Office of Vietnam, national real GDP expanded by 9.95% YoY in Q3, pushing cumulative nine-month growth to 9.01%. This momentum is fueled by a global electronics capital expenditure cycle, rising tech trade surpluses, and record-setting foreign direct investment (FDI).
1. The Northern Growth Phenomenon: Regional Divergence
Out of Vietnam’s 34 provinces and municipality-level cities, 12 recorded double-digit Gross Regional Domestic Product (GRDP) growth over the first nine months of the year—seven of which are located in Northern Vietnam.
While Hanoi (+8.85% GRDP) and Ho Chi Minh City (+9.06% GRDP) were weighed down by service-heavy transitions and real estate recalibrations, northern manufacturing hubs surged ahead:
- Quảng Ninh: 12.88% GRDP growth, driven by renewable energy manufacturing, industrial park expansion, and deep-water port logistics.
- Hải Phòng: >12.00% GRDP growth, supported by $3.1 billion in incoming FDI and industrial output expansion of 15.5% YoY.
- Bắc Ninh & Thái Nguyên: Benefited from high-capacity consumer electronics, semiconductor packaging, and mobile device manufacturing cycles.
Data compiled by the World Bank and the Asian Development Bank underscores that northern provinces are benefiting from their structural alignment with global technology capex.
| Region / Economic Hub | Q1–Q3 GRDP Growth Rate | Primary Industrial Drivers | Major Global Investors |
| Quảng Ninh | 12.88% | Port Logistics, High-Tech Manufacturing, Green Energy | Jinko Solar, Foxconn |
| Hải Phòng | >12.00% | Automotive, Electronics, Seaport & Logistics | LG Group, VinFast, Pegatron |
| Bắc Ninh | >11.50% | Consumer Electronics, Semiconductor Assembly | Samsung Electronics, Amkor Technology |
| Thái Nguyên | >10.80% | Mobile Hardware & Electronic Components | Samsung, Hansol Electronics |
| Hanoi (Tier-1 City) | 8.85% | Finance, Services, Software, Retail | Canon, Honda, Domestic Services |
| Ho Chi Minh City (Tier-1) | 9.06% | Financial Services, Commerce, Light Industry | Intel, Nidec, Logistics |
2. Structural Catalysts: Why Northern Vietnam Leads Tech Manufacturing
A. Seamless Cross-Border Logistics with Southern China
Northern industrial corridors (Hanoi–Hải Phòng–Quảng Ninh) share direct highway links to the border gates of Lạng Sơn and Móng Cái. This direct connection to China’s industrial powerhouse in Shenzhen and the Pearl River Delta enables same-day transport of critical raw components, silicon wafers, and sub-assemblies, a logistical advantage that southern or central provinces cannot replicate.
B. Multi-Modal Transport & Free Trade Zones
Hải Phòng stands out as the only northern locality offering direct access across all five primary transport modes: sea, road, rail, inland waterways, and air. The development of the Hải Phòng Free Trade Zone and the expansion of the Lạch Huyện Deep-Water Seaport allow mother vessels to bypass feeder ports and sail directly to North American and European markets, drastically lowering freight costs and transit times.
C. The Tech FDI Wave: Electronics & Semiconductors
According to global FDI metrics published by Investment Monitor, approved foreign direct investment into Vietnam surged 76.4% YoY to surpass $50.3 billion, with disbursed FDI reaching $21 billion.
The surge in trade performance is highlighted by specific high-tech export categories:
- Computers, Electronics & Components: Surged 59.6% YoY to $123.7 billion.
- Phones, Smart Devices & Components: Rose 18.8% YoY to $51.8 billion.
Together, these two categories generated approximately 40% of total national exports and nearly two-thirds of the total year-on-year increase in merchandise trade.
3. Key Operational Challenges & Strategic Outlook
Despite high growth rates, northern industrial hubs face structural bottlenecks that require ongoing management:
- Power Grid Resilience & Clean Energy Transitions: High-density semiconductor packaging and electronics assembly require uninterrupted, clean power. Ongoing investments in high-voltage transmission lines connecting central energy projects to northern industrial parks are critical to prevent seasonal grid strain.
- Skilled Engineering Talent Shortages: The rapid shift from manual assembly to advanced testing, packaging, and high-precision component production requires rapid upskilling of local engineers and technicians.
- Supply Chain Deepening: To maximize local value addition, Vietnam’s industrial policy focuses on nurturing local Tier-2 and Tier-3 suppliers to integrate into global supply chains dominated by foreign OEMs.
Market consensus data aggregated by Trading Economics and institutional research confirms that as global technology manufacturers continue diversifying under China+1 strategies, Northern Vietnam’s industrial cluster remains a primary beneficiary of foreign direct investment in Southeast Asia.
Discover more from The Economy
Subscribe to get the latest posts sent to your email.
Bitcoin’s four-year cycle has been one of the most-watched patterns in crypto. It links price peaks and crashes to the supply event known as the halving.
So far, 2026 has looked a lot like the pattern. Here is where the price stands, what the cycle predicts and what analysts expect.
Key Takeaways
- Where we are: Bitcoin traded near $77,566 on September 16, 2026. CoinDCX
- The peak: Bitcoin peaked at $126,000 in October 2025 and had fallen roughly 50% by August. Mudrex
- Cycle theory: If history repeats, a bottom would land in late 2026.
- Analysts have cut targets: Major banks have lowered their 2026 forecasts.
- Key level: The 200-day moving average is the line technical traders are watching.
What Is the Bitcoin Four-Year Cycle?
Bitcoin’s supply issuance halves about every four years. Historically, price peaks followed each halving by roughly a year, then a deep drawdown followed.
Past cycles support this. The 2017 rally and the 2021 high both followed halvings. Each peak was followed by a long decline.
Bitcoin’s decline this cycle, about 54%, is milder than the 75% to 90% peak-to-trough crashes of 2014, 2018 and 2022. Some analysts read that as evidence of a maturing asset. CoinGecko
Bitcoin Price Today and Key Levels
| Level | Meaning |
|---|---|
| $126,000 | October 2025 all-time high |
| About $64,000 | Early August 2026 trading level |
| $73,077 | 200-day EMA, a key pivot |
| $80,000–$82,000 | Resistance zone traders watch |
The 50-day average recently crossed above the 200-day, a “golden cross” for the first time this year. Technical signals are mixed, and such patterns often fail. Treat them as one input, not a prediction. CoinDCX
One analysis says a sustained break below the 200-day EMA at $73,077 would invalidate the recent breakout. CoinDCX
Bitcoin Price Forecast for 2026: What Analysts Say
Forecasts have moved lower this year. Citi cut its target twice, from $143,000 to $82,000, and Standard Chartered cut from $150,000 to $100,000. Bernstein cut once, from $200,000 to $150,000. CoinGecko
If the four-year pattern holds, a market bottom could arrive between October and December 2026, with a possible range of $50,000 to $55,000. That range lines up with the 200-week moving average. Mudrex
Prices have already moved above that level, so the cycle bottom may have come earlier and higher than the pattern suggested. Nobody knows.
Prediction markets turned bearish in July, putting under 20% odds on $90,000 by year-end. Sentiment has improved since, but expectations remain cautious. CoinGecko
Bitcoin Price Forecast 2027
Long-range forecasts are speculative. Scenarios help frame the range.
| Scenario | Rough Outcome | What Would Need to Happen |
|---|---|---|
| Cycle holds | Slow recovery in 2027 | Bottom confirmed, gradual accumulation |
| Cycle breaks bullish | New highs sooner | Strong institutional inflows |
| Deeper bear | Retest of lower support | Macro shock or weak demand |
These are frameworks, not predictions. Anyone quoting a precise 2027 price is guessing.
What Could Break the Cycle
The cycle is a pattern, not a law. Four forces could change it.
- ETFs and institutions. Large regulated funds bring different buyers than earlier cycles.
- Interest rates. Central bank policy affects appetite for risk assets.
- Regulation. Clearer rules could attract capital, and tighter ones could deter it.
- Macro shocks. Energy prices and geopolitical events can hit all risk assets.
How Investors Can Approach the Market
- Use dollar-cost averaging. Spreading purchases reduces timing risk.
- Size positions carefully. Only invest money you can afford to see drop 50% or more.
- Know your holding route. Direct coins and spot ETFs carry different costs and risks.
- Watch the 200-day level and macro news.
- Keep records for taxes.
This article is general information, not financial advice.
What This Means for the Global Market in 2027
Most forecasts fixate on a single price. Here is what matters more.
Liquidity decides the next leg. Bitcoin has tracked global liquidity and risk appetite. Watch central bank policy.
Institutional adoption is the wild card. If ETFs and brokerages keep bringing in long-term holders, volatility may narrow.
The next halving is in 2028. Some analysts already anchor forecasts to it. The cycle may shift in timing if it continues at all.
Correlation with tech stocks. Bitcoin’s moves have followed large AI-linked stocks at times, so the two markets can turn together.
Frequently Asked Questions
What is the Bitcoin price prediction for 2026?
Forecasts vary widely, and major banks have cut their targets. Prices traded near $77,000 in mid-September.
Will Bitcoin hit a new high in 2027?
Nobody can say. If the four-year cycle holds, a new high is more likely later than in 2027.
Is the Bitcoin four-year cycle still valid?
It has matched 2026 so far, with a drop from an October 2025 peak. The decline has been milder than in past cycles.
When will Bitcoin bottom?
The cycle suggests late 2026, but bottoms are only clear in hindsight. Watch the 200-day and 200-week averages.
Discover more from The Economy
Subscribe to get the latest posts sent to your email.

How Global Interest Rates Affect Savings, Loans and Investments

How to Invest During High Inflation: A Global Guide

Best Global Stocks to Watch in 2026: Four Sectors to Research

Pakistan’s 2027 Growth Strategy: Exports, AI, Energy and Jobs

Pakistan Economy FY2027: IMF Reform, Debt and Recovery Outlook

Global Interest Rates 2027: Risks for Pakistan’s Rupee and Debt

Energy Shock 2026–2027: Oil, Gas and Pakistan’s Economy

World Trade 2027: Tariffs, Supply Chains and Pakistan Exports

AI Investment Boom 2026–2027: Can Pakistan Capture the Upside?

Global Economy 2026–2027: What Slower Growth Means for Pakistan

Why Global Inflation Is Rising Again in 2026, and What It Means for Pakistan

Raast Pakistan 2026: Digital Payments, Fintech

Pakistan Real Estate Tax 2026: What Buyers, Sellers and Investors Must Check

SME Finance Pakistan 2026: Why Small Businesses Still Struggle for Credit

Crude Oil & Petroleum Market Analysis: OPEC+ Decisions and Price Forecasts

World’s Largest Economies: Ranking the Top Global Powers

Pakistan Economy 2026: Inside the SBP’s Balancing Act

Asian Stock Markets 2026: Japan, China, Pakistan & More

Silver Price Today: Why the Xi-Trump AI Standoff Is Fueling a Safe-Haven Rally

Oil Prices 2026: Inside the Hormuz Crisis That Won’t End

SpaceX IPO 2026: History’s Biggest Stock Debut?

Algorithmic Dogfights: Why the U.S. and China Must Establish Rules of Engagement for Autonomous Air Power

Top US Convenience Store Chains: Store Counts, EV Charging, and Sales Trends

Who Is Shivon Zilis? The Neuralink Executive at the Center of the Musk–OpenAI Trial

Business Insurance: What Coverage You Actually Need and What It Costs in 2026

Global Economic Outlook 2026: 7 Forces Reshaping Markets, Trade and Business

Corporate America Faces a New Debt Test as US Borrowing Costs Surge

Is AI a Stock Bubble in 2026? What the Data Shows
-

 Markets & Finance10 months ago
Top 15 Stocks for Investment in 2026 in PSX: Your Complete Guide to Pakistan’s Best Investment Opportunities
-

 Analysis8 months ago
Johor’s Investment Boom: The Hidden Costs Behind Malaysia’s Most Ambitious Economic Surge
-

 Analysis8 months ago
Top 10 Stocks for Investment in PSX for Quick Returns in 2026
-

 Banks9 months ago
Best Investments in Pakistan 2026: Top 10 Low-Price Shares and Long-Term Picks for the PSX
-

 Analysis9 months ago
Brazil’s Rare Earth Race: US, EU, and China Compete for Critical Minerals as Tensions Rise
-

 Investment9 months ago
Top 10 Mutual Fund Managers in Pakistan for Investment in 2026: A Comprehensive Guide for Optimal Returns
-

 Global Economy10 months ago
15 Most Lucrative Sectors for Investment in Pakistan: A 2025 Data-Driven Analysis
-

 Global Economy10 months ago
Pakistan’s Export Goldmine: 10 Game-Changing Markets Where Pakistani Businesses Are Winning Big in 2025