
US Economy
US-Iran War Economic Impact 2026: Hormuz Shock, Stagflation Risk, and the Global Recession Threat
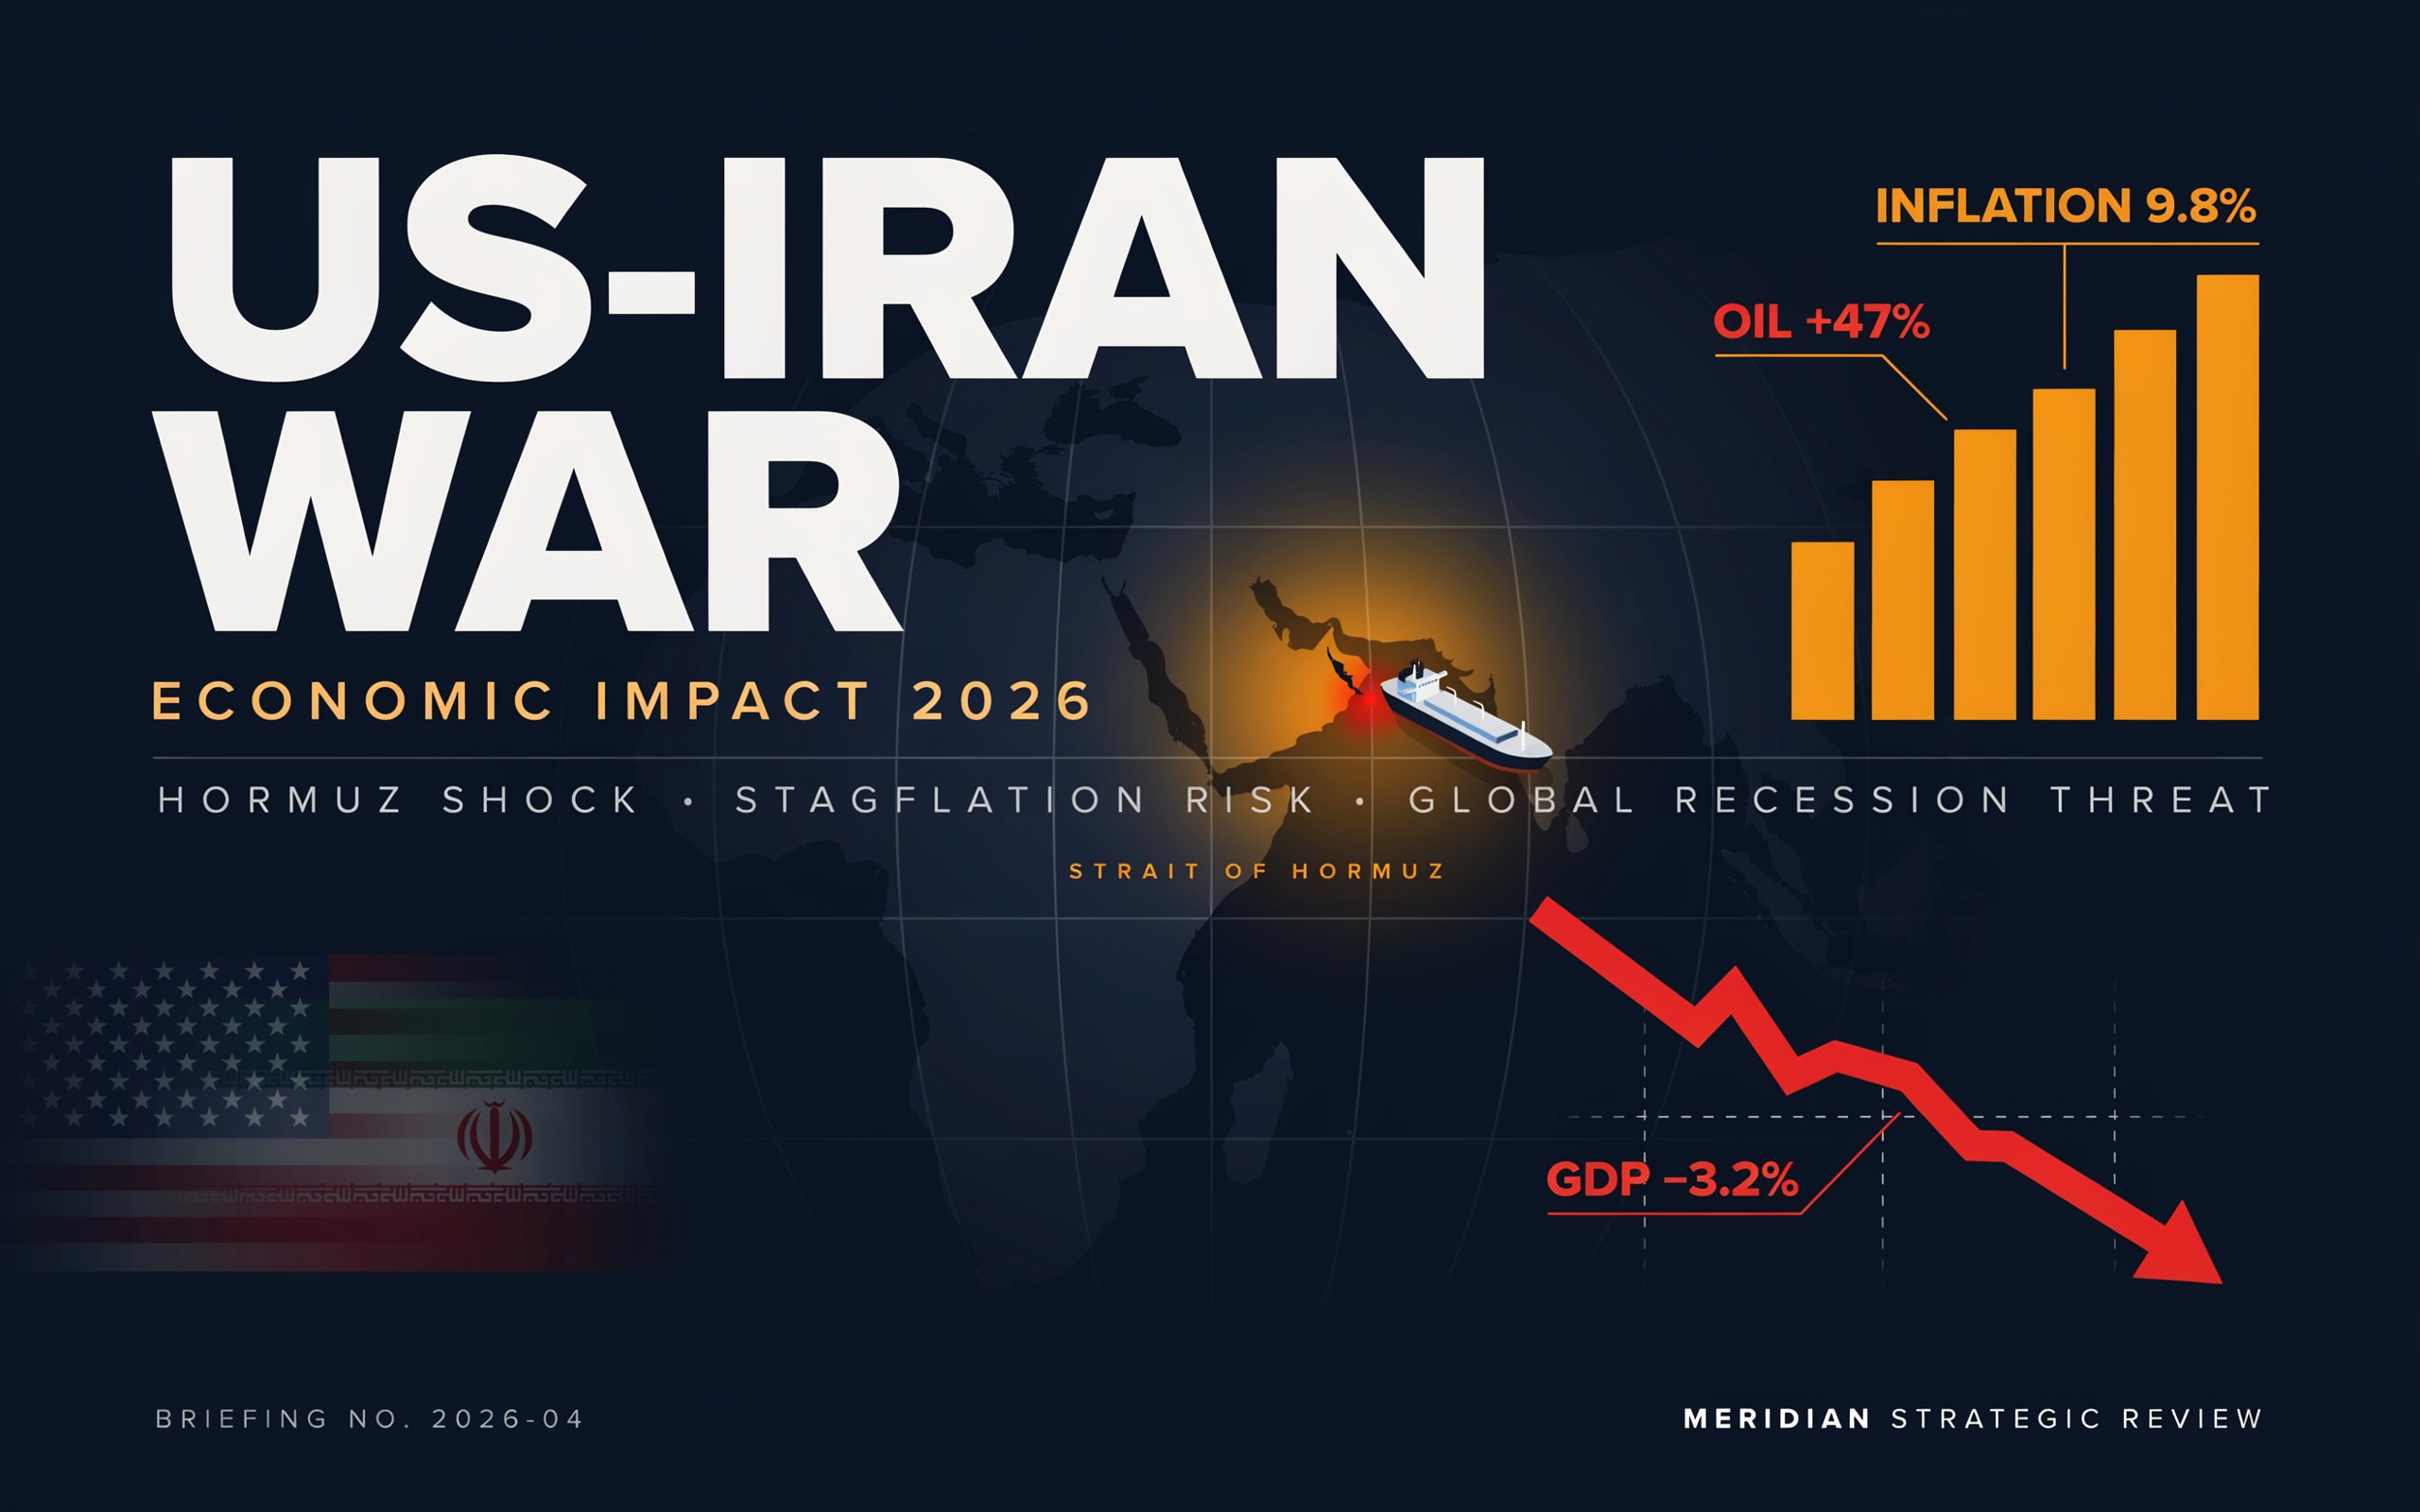
The US-Israel war on Iran closed the Strait of Hormuz to 20% of world oil trade. The IMF warns of global recession. Europe faces stagflation. Asia scrambles for alternatives. Here is the full economic map.US and Israeli forces launched strikes on Iran. Within days, the Strait of Hormuz — the narrow maritime chokepoint through which roughly 20% of the world’s oil and LNG passes — was effectively closed to commercial tanker traffic. The International Energy Agency characterised the resulting supply disruption as the largest in the history of the global oil market. The comparison to the 1970s oil crisis was not hyperbole. It was the framework within which global policymakers, central bankers, and finance ministries began operating.
The consequences cascaded across every dimension of the global economy — trade, inflation, currency markets, sovereign debt, and monetary policy — with a speed that caught financial markets unprepared.
The Energy Shock: Prices, Shortages, and the LNG Emergency
Brent crude rose more than 50% from its pre-war level within two months of the conflict’s outbreak, briefly touching $101.89 per barrel by late March. US diesel prices — a real-economy barometer — surged from $3.75 to $5.37 per gallon within weeks, imposing immediate cost pressures on agriculture, logistics, and construction. The national US average gasoline price crossed $3.98, up a dollar in under a month.

But the LNG shock proved equally severe. On March 18, Iran struck Qatar’s Ras Laffan Industrial City, causing a 17% reduction in Qatar’s LNG production capacity — damage that engineers estimated would require three to five years to repair. Asian LNG spot prices rose more than 140% in the aftermath. In 2024, about 84% of the crude oil and 83% of the LNG passing through the Strait was bound for Asia — with China, India, Japan, and South Korea accounting for nearly 70% of those shipments.
The IMF’s Three Scenarios
The IMF cut its 2026 global growth forecast to 3.1% — down 0.2 percentage points from January — but stressed that even this lower number assumes the most optimistic scenario: a short-lived conflict with oil averaging $82 a barrel across the year. The IMF’s own oil price assumption had been $62 at the start of 2026. With prices hovering near $100, the Fund’s intermediate scenario projects global growth falling to 2.5%. In its worst-case scenario — supply disruptions extending into 2027 — global growth falls to approximately 2%, which the IMF characterised as a “close call for a global recession.” Growth has only fallen below 2% four times since 1980.
The regional devastation in the Middle East and Central Asia is more acute: the IMF projects growth for the region at just 1.9% for 2026, a two-percentage-point downgrade, with several economies — Iran, Qatar, Iraq, Kuwait, and Bahrain — projected to contract outright.
Europe on the Brink of Stagflation
The European economic position is among the most precarious. The ECB postponed planned rate cuts on March 19, raising its 2026 inflation forecast while cutting GDP growth projections. Oxford University’s economics department modelled the UK and the Eurozone as at risk of contraction. The Ifo Institute assessed Germany and the Netherlands as carrying high recession risk. The OECD flagged the UK as the worst-hit major economy globally.
Chemical and steel manufacturers in the UK and EU imposed production surcharges of up to 30% to offset surging electricity and feedstock costs, with warnings of permanent deindustrialisation in some energy-intensive sectors if the disruption persisted through the summer refill season.
Asia: Scrambling for Alternative Supply
The strategic exposure of Asia-Pacific economies was acute. As of February 2026, 94.2% of Japan’s crude oil imports came from the Middle East. Japan released 80 million barrels from strategic reserves — equivalent to 15 days of domestic demand — from mid-March. Indonesia, an oil producer but importer of a third of its supply, activated emergency rationing measures. Pakistan, Bangladesh, and Vietnam were identified among the worst-hit economies in the developing world. Bangladesh faced recession-like conditions.
Myanmar restricted private vehicle use to alternate days. Nepal’s state oil corporation announced it would fill only half of consumers’ empty cylinders to lengthen petroleum stockpiles.
The Recession Debate: Euphoria or Denial?
Perhaps the most striking market development was the decoupling between equity performance and the underlying economic reality. The S&P 500 touched a new all-time intraday high of 7,230.12 on May 1, 2026 — despite an oil price that had risen more than 50% since February 28. Energy Aspects founder Amrita Sen described markets as displaying “extremely misplaced euphoria,” warning of “sleepwalking into potentially a pretty big recession.”
Goldman Sachs raised its US recession probability over the next twelve months to 30%. EY-Parthenon placed it at 40%. Their shared concern: that rising energy costs function as a sustained tax on consumer spending — which accounts for roughly two-thirds of US output — while simultaneously eroding corporate margins and dampening business investment.
The global economy in mid-2026 was navigating the rare and uncomfortable territory between geopolitical catastrophe and market complacency. The peace agreement signed between the US and Iran in late June offers a fragile off-ramp. But the structural lessons — about energy security, geopolitical risk pricing, and the fragility of global supply chains — will outlast the ceasefire by decades.
Discover more from The Economy
Subscribe to get the latest posts sent to your email.


Having lost its most powerful tariff tool in the Supreme Court, the Trump administration has found a new one — and it comes with a moral argument attached.
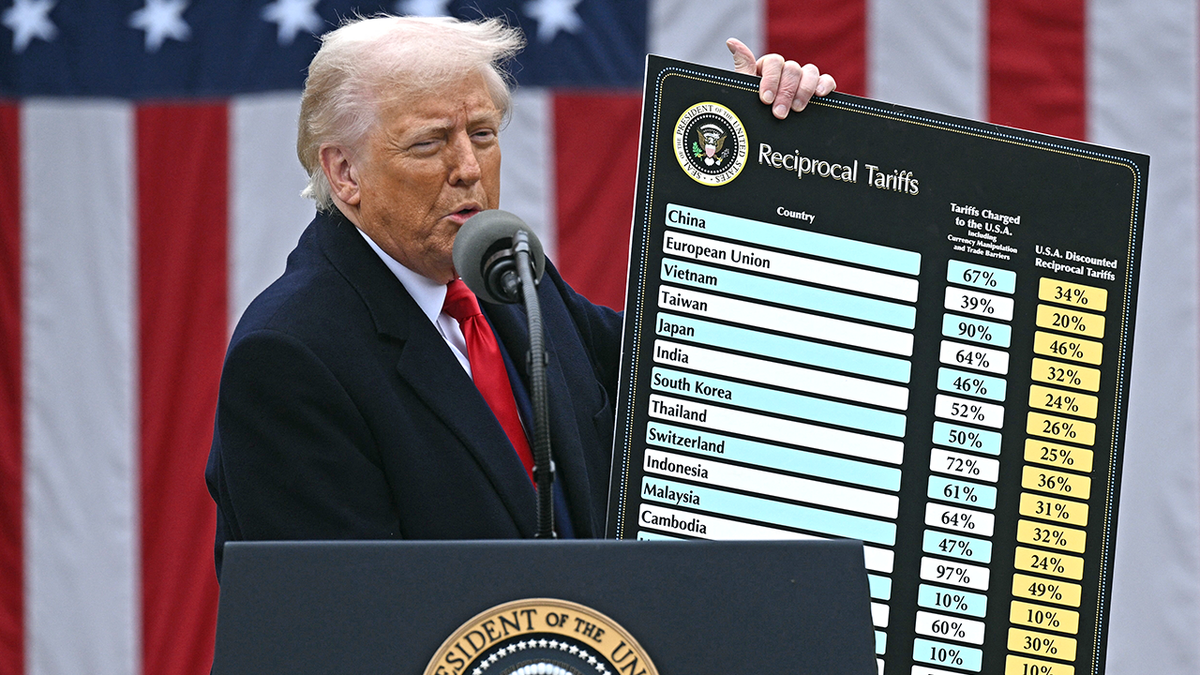
On June 2, 2026, the Office of the United States Trade Representative concluded 60 simultaneous Section 301 investigations, finding that each of the targeted economies had failed to impose or effectively enforce a prohibition on the importation of goods produced with forced labour. The proposed remedy: additional tariffs of 10% to 12.5% on all imports from those economies, covering 99.4% of total US imports by origin. The scope is unprecedented. It sweeps in China, the European Union, Japan, India, Vietnam, Australia, South Korea, and 52 other trading partners in a single action.
The Legal Architecture Post-Supreme Court
The context matters. In February 2026, the US Supreme Court struck down most of President Trump’s “Liberation Day” emergency tariffs, ruling that they exceeded the executive’s authority under the International Emergency Economic Powers Act (IEEPA). That decision dismantled the headline tariff architecture the administration had built over 2025. Rather than abandon the strategy, the Trump administration pivoted to legal frameworks with stronger statutory grounding. Section 301 of the Trade Act of 1974 authorises the president to impose levies to counter foreign trade practices that are “unreasonable or discriminatory and burden or restrict U.S. commerce” — a standard that the USTR has now applied to forced labour enforcement failures.
The investigations were formally initiated on March 12, 2026, with public hearings drawing testimony from nearly 60 witnesses and 500 written comments over April and May. The USTR’s findings drew a direct causal link between inadequate forced labour enforcement and competitive harm to US companies and workers.
The Rate Architecture
The proposed tariff structure creates two tiers. Economies that have adopted full or partial forced labour import prohibitions — notably Canada, Mexico, and a handful of others — would face 10% additional duties. The remaining 45 economies, including China, India, Japan, Vietnam, Australia, and New Zealand, would face 12.5% additional duties. A separate textile mechanism would allow a capped volume of apparel and textile imports from certain economies at a reduced rate. Electronics and AI-related products are widely expected to carry significant exemptions, according to the Economist Intelligence Unit.
The public comment period closes July 6, 2026, with hearings beginning July 7. The duties are not yet in effect — but for companies sourcing from any of the 60 targeted economies, the window to map exposure and file comments is rapidly closing.
Trading Partners Push Back
Responses from affected governments were swift and uniformly dismissive of the USTR’s reasoning. Beijing‘s commerce ministry spokesperson stated flatly that “there is no so-called forced labor in China,” and that Washington and Beijing should “meet each other halfway.” China’s foreign ministry called the accusations politically motivated.
The European Union is in a particularly complex position. Brussels signed a broad bilateral trade agreement with Washington in 2025, which the European Parliament ratified. The proposed new tariffs — which the EU called “unjustified” — would come on top of the existing 15% tariff framework from that deal. The USTR’s own report acknowledged that the EU’s anti-forced-labour regulation only entered into force in December 2027 and lacks certain enforcement elements — giving the administration its statutory foothold. The chair of the European Parliament’s trade committee described the determination as “utterly absurd” given the 2024 EU forced labour import ban law.
France‘s government questioned whether the investigation reflected genuine concerns, with officials suggesting a tariff measure was “sought first, and only then is a suitable legal justification found.”
The Supply Chain Reality for Multinationals
For global supply chain managers, the practical implications are immediate regardless of the final duty levels. The Clark Hill law firm’s trade practice advised clients to map exposure against the 60 targeted economies by HTS code, model the 10% and 12.5% rate scenarios, and test exclusion eligibility before assuming coverage — noting that even partial exposure in electronics supply chains could run to billions in added costs at scale.
Nick Marro of the Economist Intelligence Unit told CNBC that he expects the Trump administration to “unleash further investigations and tariff announcements in preparation for renewed rounds of trade talks,” characterising the Section 301 action as part of a broader pattern of building leverage ahead of bilateral negotiations. The July 24 expiration of the separate 10% baseline tariff imposed under Section 122 adds another inflection point to the calendar.
For the global trading system, the implication is clear: the US high-tariff era is not over; it has simply found a new statutory vehicle.
Discover more from The Economy
Subscribe to get the latest posts sent to your email.

Federal Reserve Chair Kevin Warsh held rates at 3.5–3.75% on June 17, 2026, but nine officials signalled a 2026 rate hike as inflation hit 4.2%. What the “regime change” means for markets.In his first press conference as Fed chair, Kevin Warsh announced that the Federal Open Market Committee had voted unanimously to keep the benchmark federal funds rate in a range of 3.5% to 3.75% — the fourth consecutive hold. But the accompanying Summary of Economic Projections told a different story: nine of 18 participating officials now favour at least one interest rate increase before the end of 2026, with six pencilling in two separate quarter-point hikes. That is a dramatic reversal from as recently as March, when the base case remained an easing bias.
A Debut Defined by What Was Removed
Warsh has long criticised the Federal Reserve’s communications machinery as cluttered, forward-looking to the point of being counterproductive, and prone to generating market noise rather than policy clarity. His first meeting delivered on that critique in practice.
The policy statement was substantially shortened. References to “additional rate adjustments” were stripped out entirely, removing the easing-leaning language that had guided market pricing through most of 2025 and early 2026. In place of forward guidance, the closing sentence read simply: “The committee will deliver price stability.” Warsh announced task forces in five areas — monetary policy frameworks, communications, data sourcing, productivity, and labour markets — and signalled that even the quarterly dot plot itself was under review.
“When you have one [press conference], you want to make sure you have something important to say,” Warsh told reporters, hinting that he would reduce the frequency of post-meeting media appearances. He also confirmed he had not submitted his own interest rate projections for the dot plot — leaving one dot conspicuously absent from the published chart and keeping his personal baseline ambiguous.
What 4.2% Inflation Means for the Rate Path
The June dot plot was produced against a backdrop in which consumer prices are running at 4.2% annually — the fastest pace since April 2023 — driven in large part by the energy shock associated with the US-Iran conflict that began in late February. The FOMC’s revised economic projections now see PCE inflation at 3.6% by year-end, sharply higher than the 2.7% projected in March, while GDP growth estimates for 2026 were trimmed to 2.2%.
Fox Business reported that Warsh was explicit in his assessment: “Persistently high prices are a burden for the American people, but the recent past need not be prologue.” He offered assurance that the FOMC is “unambiguous and unanimous” in its commitment to delivering price stability — language that reads as a direct rebuke of the prolonged inflation tolerance that defined the post-pandemic era.
The immediate market reaction was sharp. Two-year Treasury yields jumped 16 basis points to 4.21%, their highest level in over a year. The S&P 500 fell 1.21%, the Nasdaq dropped 1.34%, and the US dollar index surged approximately 1% — its best daily performance in almost a year. Gold, which typically performs poorly when rate expectations shift hawkish and the dollar strengthens, fell more than 2%.
The Trump Complication
President Trump had nominated Warsh in part with the expectation that he would press for lower borrowing costs. That assumption has been quietly tested by events. Trump acknowledged higher rates “keeps the country down,” according to CNN, but notably declined to publicly criticise Warsh’s first decision — a restraint that former chair Jerome Powell rarely received. Powell, who remains on the Fed’s Board of Governors and retains a voting seat on the FOMC, is still under a Justice Department inspector general review related to the Fed headquarters renovation.
The gap between political preference and monetary reality is already visible. Citadel Securities had warned of rising September hike risks, citing strong wages, resilient consumer demand, supply chain strains from the Iran conflict, and AI-driven investment crowding out rate-sensitive sectors. The July 28-29 FOMC meeting will be the next scheduled test, and markets are already recalibrating.
What It Means for Borrowers
The practical consequences are already filtering through household balance sheets. With the benchmark rate held at elevated levels and rate cut prospects for 2026 effectively removed from the base case, mortgage rates, credit card rates, and auto loan rates will remain at or near current highs. “On paper nothing changes,” Michael Ryan of MichaelRyanMoney.com told Newsweek. “In real life it signals the Fed is still watching inflation. It doesn’t give relief to borrowers and it doesn’t reward savers.”
The June dot plot’s median projection for rates in 2026 has shifted higher, and the longer-run dot — treated as a guidepost for the neutral rate — signals the committee sees no urgency to ease even into 2027. The Warsh era at the Federal Reserve has opened with a clear message: price stability is the governing priority, and the toolbox for achieving it may yet include rate hikes that as recently as six months ago seemed inconceivable.
Discover more from The Economy
Subscribe to get the latest posts sent to your email.
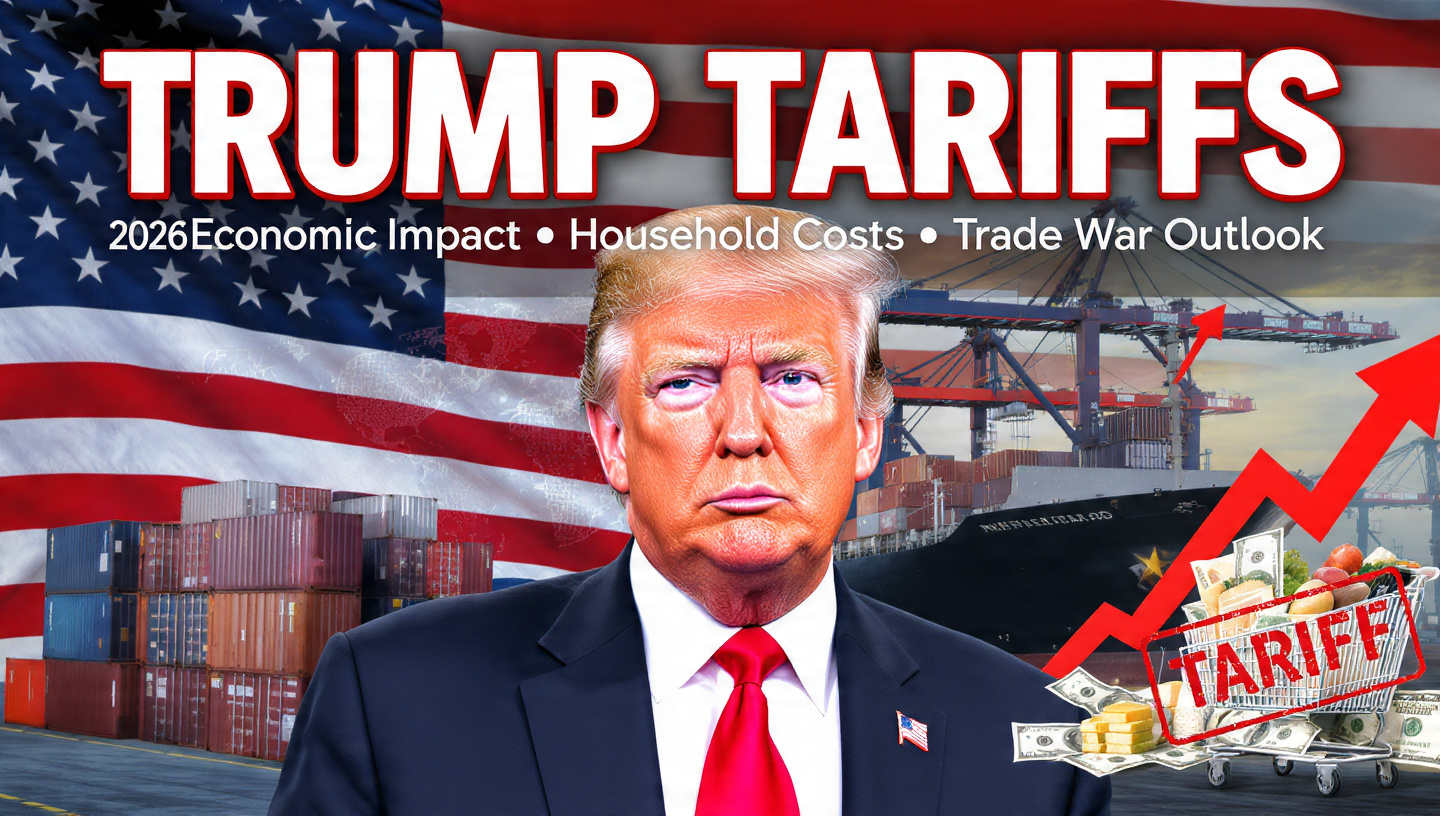
Trump’s 2026 tariffs represent the largest US tax increase as a share of GDP since 1993, costing households $1,500 on average. Here’s how the trade war is reshaping global supply chains, prices, and growth.
The tariff regime assembled by the Trump administration since 2025 now constitutes the largest U.S. tax increase as a share of GDP since 1993—a fact that took more than a year to fully register in household budgets, but whose full weight is being felt with increasing force in the middle months of 2026.
The average American household will pay an estimated $1,500 more in 2026 as a direct consequence of elevated import duties, according to Tax Foundation analysis—up from roughly $1,000 in 2025. The costs are not distributed evenly. Lower-income households, which spend a higher proportion of their income on goods (particularly apparel, electronics, and food), absorb a larger relative burden.
A Legal Architecture Under Pressure
The tariff program has faced serious legal challenges. On February 20, 2026, the Supreme Court ruled that the President cannot use the International Economic Emergency Powers Act—IEEPA—to impose tariffs. The decision stripped the administration of the legal vehicle it had used to impose much of its most aggressive tariff architecture.
But the administration adapted rather than retreated. In the same week as the ruling, President Trump signed an executive order imposing a 10% tariff on all countries under Section 122—a different statutory authority tied to balance-of-payments deficits—covering approximately $1.2 trillion worth of imports. The administration also initiated multiple Section 301 investigations into 60 countries on March 11, examining whether those nations allow imports of products made by forced labor. The list includes the European Union, positioning both parties for a potential renewal of the transatlantic trade conflict that a deal in 2025 had temporarily paused.
On pharmaceuticals, the administration signaled that tariffs on imported drugs could rise toward 200% by mid- to late-2026—a figure that would represent an extraordinary disruption to global pharmaceutical supply chains, though J.P. Morgan analysts noted that inventory builds and domestic manufacturing announcements by large biopharma companies should limit near-term exposure for major producers.
The China Equilibrium
U.S.-China trade relations have settled into an uneasy equilibrium. Following the June 11, 2025 trade deal announcement that left in place 20% fentanyl-related tariffs and 10% reciprocal tariffs for a combined 30%, and a subsequent series of extensions and escalations that included a 100% tariff imposed in November 2025, the two countries entered 2026 with a tense but functional trading relationship.
Chinese exporters responded to U.S. tariffs not by collapsing but by redirecting. China’s semiconductor exports surged 110% year-over-year in May 2026. That strength reflects both genuine demand from AI-related industries globally and a deliberate Chinese strategy of deepening trade relationships with Southeast Asia, the Gulf, and Europe to reduce dependence on U.S. market access.
The economic cost of U.S. tariffs on China, per J.P. Morgan Global Research, was to reduce Chinese GDP growth by roughly 0.6 percentage points through the combined effect of export drag and weaker domestic investment. But China’s export machine proved more resilient than many forecasters expected, partly because third countries absorbed Chinese goods that could not reach the U.S. market directly.
Inflation Is the Tariff’s Most Persistent Legacy
The clearest economic consequence of the tariff regime is its contribution to inflation. Businesses faced with import tariffs have three choices: absorb the cost and compress margins; pass it to consumers in higher prices; or reshore production in the U.S. at significantly higher labor costs. All three options carry economic costs, and in practice most companies have pursued a combination.
Atlanta Fed President Raphael Bostic noted in research published late 2025 that U.S. firms expected tariffs to account for 40% of their total unit cost growth in 2025 and 2026. That contribution to inflation is structural rather than transitory—unlike oil prices, which can fall as conflict dynamics ease, tariff-driven cost increases remain embedded in supply chain economics until the tariffs themselves are removed or the supply chains are restructured.
The Council on Foreign Relations analysis of tariff-Treasury interactions found that tariff uncertainty—independent of the tariffs themselves—was raising the risk premium in U.S. Treasury markets: “An eventual court ruling against the administration’s reliance on IEEPA could significantly alter the implementation path,” J.P. Morgan’s Nora Szentivanyi noted, adding that even without IEEPA, alternative statutory pathways would keep elevated tariffs in place.
Where the Trade War Goes Next
The Section 301 investigations launched in March against 60 countries—including EU members—signal that the tariff posture is not an emergency measure being wound down but a permanent feature of U.S. trade policy. Many market participants expect that Treasury will need to increase issuance of longer-term bonds starting in Q4 2026 partly to ensure liquidity along the yield curve—with tariff revenue being one of the contested variables in fiscal planning.
For U.S. businesses, the clearest strategic message from the tariff regime’s staying power is that supply chain localization is no longer a nice-to-have contingency plan. It is a competitive necessity in an environment where trade routes can change with a single executive order and where the legal found
Discover more from The Economy
Subscribe to get the latest posts sent to your email.

Global Economic Outlook June 2026: Trade Fragmentation Bites

SpaceX IPO 2026: Inside the $2 Trillion Valuation That Remade Wall Street

Kevin Warsh’s Regime Change: The Federal Reserve in the Age of War, Inflation, and Political Pressure

Private Credit Crisis 2026: $3 Trillion Shadow Market Faces Its Biggest Test

US-Iran War Economic Impact 2026: Hormuz Shock, Stagflation Risk, and the Global Recession Threat

China Economy 2026: Semiconductor Surge, Weak Consumption, and the Rebalancing Trap

GENIUS Act 2026: The New Global Payments Architecture

Agentic AI Banking 2026: Autonomous Agents in Trading, Compliance, and Credit — Risks and Opportunities

IMF Global Growth Forecast 2026: War, Tariffs, and AI Uncertainty Shatter the Recovery

US-China Semiconductor War 2026: Bifurcation, Tungsten Shock, and the Race for AI Chips

Salt Is the New Oil: Critical Minerals, the 2026 Investment Playbook

AI Infrastructure Debt Bubble 2026: $570 Billion in Global Debt Issuance Raises Systemic Risk Alarm

Argentina Economy 2026: Milei’s Fiscal Surplus, Inflation Drop to 29%, and What Comes Next

Global Economic Growth 2026: World Bank Cuts Forecast to 2.5%

PwC China Partner Payouts Cut Amid Evergrande Audit Fraud

Broadcom Market Value Loss: Revenue Forecast Disappoints

Investors Pile Into Bullish Dollar Bets as ‘US Exceptionalism’ Trade Returns

Here’s How Much It’ll Cost You to Be Part of SpaceX’s Record-Breaking $75 Billion IPO

Nasdaq Tumbles 4% as Chip and Memory Stocks Sink: A $1.2 Trillion Wipeout

How to Fix Pakistan’s Debt Economy: A Structural Blueprint

Smash Capital Leads $200M Funding for Allen Control Systems

Democrats Draw a Red Line Around Military AI — And the Pentagon Is Already Pushing Back

New Investment Super-Cycle: AI, Green Energy & Re-Shoring

Grinding the Already Ground: Pakistan’s Inflation Crisis

Xponential Fitness Franchise Lawsuit: The $3.97M Judgment

Middle East Conflict Oil Prices: The $4 Surge Explained

The End of the Chatbot: Why OpenAI is Tearing Up Its Most Successful Product

Musk’s SpaceX Lines Up Retail Investors for Record IPO Allocation
-

 Markets & Finance6 months ago
Top 15 Stocks for Investment in 2026 in PSX: Your Complete Guide to Pakistan’s Best Investment Opportunities
-

 Analysis4 months ago
Top 10 Stocks for Investment in PSX for Quick Returns in 2026
-

 Analysis5 months ago
Brazil’s Rare Earth Race: US, EU, and China Compete for Critical Minerals as Tensions Rise
-

 Analysis4 months ago
Johor’s Investment Boom: The Hidden Costs Behind Malaysia’s Most Ambitious Economic Surge
-

 Banks5 months ago
Best Investments in Pakistan 2026: Top 10 Low-Price Shares and Long-Term Picks for the PSX
-

 Investment6 months ago
Top 10 Mutual Fund Managers in Pakistan for Investment in 2026: A Comprehensive Guide for Optimal Returns
-

 Global Economy6 months ago
15 Most Lucrative Sectors for Investment in Pakistan: A 2025 Data-Driven Analysis
-

 Global Economy6 months ago
Pakistan’s Export Goldmine: 10 Game-Changing Markets Where Pakistani Businesses Are Winning Big in 2025