
Analysis
The Giant Stirs Again: How Falcon Heavy’s Return and the ViaSat-3 Constellation Signal a New Chapter in the Satellite Broadband Wars

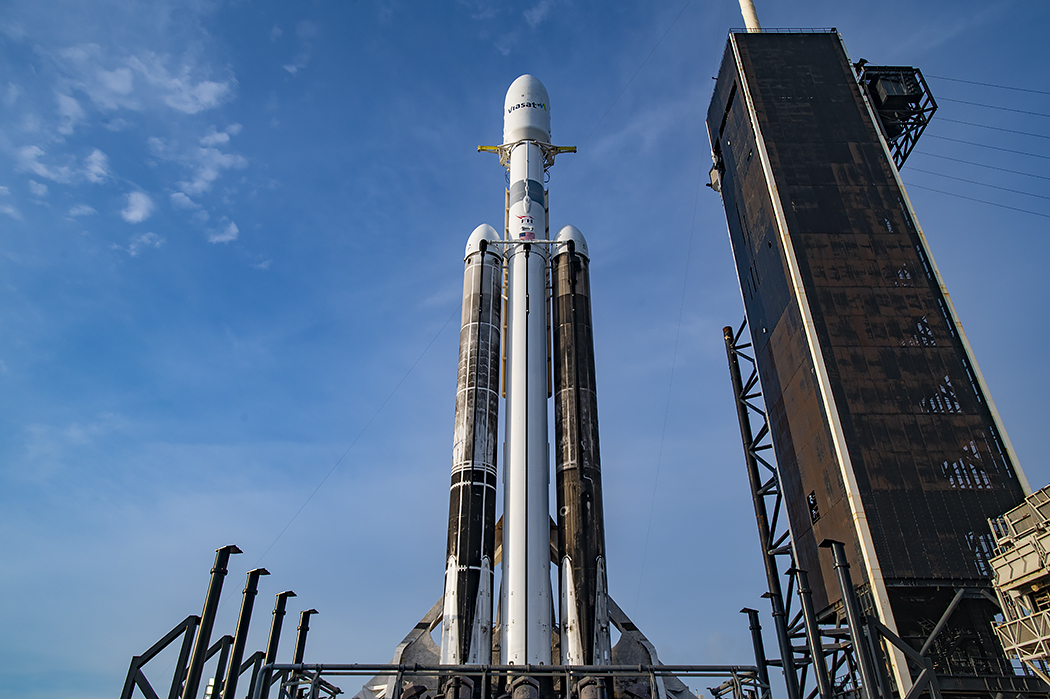
SpaceX’s Falcon Heavy returns to flight on April 27, 2026, launching the ViaSat-3 F3 Asia-Pacific satellite from LC-39A. Only its 12th mission in history, this rare flight completes Viasat’s global broadband constellation and reshapes the GEO vs. LEO satellite broadband competition. Here’s what it means for the new space economy.
At 10:21 a.m. Eastern Time on Monday, April 27, 2026, the most powerful operational commercial rocket on Earth — and one of its rarest fliers — ignites its twenty-seven Merlin engines simultaneously at Kennedy Space Center’s storied Launch Complex 39A. The ground shakes the way the ground is supposed to shake near a rocket: not from a single source, but from a column of fire wide enough to seem geological, to seem geological. Falcon Heavy’s triple-core frame, generating more than 5.1 million pounds of thrust, clears the tower in a wall of sound. Then, minutes later, comes the signature spectacle — two side boosters separating and wheeling back toward Cape Canaveral in precise, mirror-image arcs, landing on Landing Zone 2 and Landing Zone 40 with the kind of choreography that still, somehow, feels impossible. The central core flies on, burns everything it has left, and falls into the Atlantic. Its sacrifice is the price of orbiting a six-metric-ton satellite to geostationary transfer orbit.
This is Falcon Heavy’s twelfth flight in its eight-year operational life. Twelve. The number is almost deliberately understated for a vehicle of this capability. And that rarity — the extended eighteen-month hiatus since its previous mission, NASA’s Europa Clipper in October 2024 — is itself a story worth telling, because it reveals as much about where the commercial space economy is heading as the launch it frames.
A Rocket Reserved for Giants
Understanding why Falcon Heavy flies so seldom requires understanding what it is and what it isn’t. Falcon Heavy is not SpaceX’s everyday workhorse; that role belongs to Falcon 9, which has become perhaps the most routinely astonishing piece of engineering in contemporary aviation history, completing an extraordinary 165 launches in 2025 alone. Falcon Heavy is something else: a vehicle summoned for missions too massive, too energetic, or too classified for a standard Falcon 9 to handle. It is the draft horse you bring out when the load demands it and put back in the barn when ordinary work resumes.
At a listed price of approximately $97 million per launch in its reusable configuration — and roughly $150 million in fully expendable form — Falcon Heavy is already a relative bargain compared to the now-retired Delta IV Heavy, which cost ULA customers between $350 and $400 million per flight. But the market for truly heavy payloads simply isn’t large enough to sustain monthly cadence, and SpaceX has never pretended otherwise. The vehicle was designed for a specific tier of mission: very large commercial communications satellites, deep-space science flagships too heavy for a single Falcon 9, and high-orbit national security payloads demanding maximum throw weight. When those missions come, Falcon Heavy flies. When they don’t, it waits.
What brings it back today is the final satellite of Viasat’s ambitious ViaSat-3 program: the ViaSat-3 F3 spacecraft, destined for the Asia-Pacific region, built by Boeing, and configured with a Ka-band payload designed to add more than one terabit per second of broadband capacity to Viasat’s global network. At approximately 6.6 metric tons, ViaSat-3 F3 is too heavy for a Falcon 9 to lift to the transfer orbit Viasat needs — particularly one favorable enough for the satellite’s electric propulsion to complete the journey to geostationary orbit on a reasonable timeline. As confirmed by Viasat’s own leadership, Falcon Heavy’s superior performance means the spacecraft can be delivered to an orbit just below geostationary apogee with only about three degrees of inclination — cutting weeks off the months-long electric orbit-raising process compared to what an Atlas V delivery required for ViaSat-3 F2.
The Mission in Detail: Engineering a Global Network
The technical architecture of this mission rewards attention, because it illustrates exactly why some satellite programs still require the big rocket rather than the commercially expedient one.
ViaSat-3 F3 will be deployed to geosynchronous transfer orbit — an elliptical orbit with a perigee in the low tens of thousands of kilometers and an apogee near geostationary altitude — approximately five hours after liftoff from LC-39A. From there, the spacecraft’s all-electric propulsion system takes over, gradually raising and circularizing the orbit over the course of roughly two months until ViaSat-3 F3 arrives at its reserved slot at 158.55 degrees East longitude, directly above the Pacific Ocean at geostationary altitude of 35,786 kilometers. Once in position, Viasat expects rigorous bus and payload testing before a commercial service entry expected by late summer 2026.
The satellite itself is a remarkable piece of engineering: a fully flexible Ka-band broadband spacecraft designed to direct its capacity dynamically, rather than assigning fixed amounts of spectrum and power to fixed geographic beams as earlier generations of GEO satellites did. In the words of Viasat’s vice president of space systems, Dave Abrahamian, the constellation’s hallmarks are “a huge amount of absolute capacity, but also the flexibility to put it wherever you need it, whenever you need it.” Traditional satellites — including Viasat’s own earlier generations — operate more like fixed highway lanes: once built, the bandwidth goes where the beams point, regardless of where demand actually flows on any given day. ViaSat-3 F3 is architected to be more like a managed network, allocating spectrum and power dynamically in response to real-time demand.
This flexibility matters enormously for the commercial aviation market, which constitutes one of Viasat’s primary revenue streams. Airline routes shift seasonally and commercially. Demand spikes during peak travel periods and across high-traffic corridors. A satellite that can concentrate capacity over the North Pacific during the morning push and redistribute it over Southeast Asian leisure routes in the afternoon represents a fundamentally different commercial proposition than one locked into static beam patterns.
For the booster side of the mission, SpaceX will fly side boosters B1072 and B1075 back to Cape Canaveral Space Force Station, landing at LZ-2 and the recently commissioned LZ-40 respectively. B1075 carries a flight heritage that includes SDA orbital transport missions, multiple Starlink deployments, and an international synthetic aperture radar spacecraft. Their recovery is not merely theater — it is the economic logic underlying SpaceX’s cost model, allowing the amortized cost of booster manufacturing to be spread across multiple flights. The central core, carrying nothing but a nearly empty propellant load by the time it has done its work, will be expended — a trade-off SpaceX has consistently made on GTO missions demanding maximum performance from the vehicle’s core stage.
Completing the Constellation: What ViaSat-3 F3 Means for Viasat
The ViaSat-3 program has not had an easy journey. When ViaSat-3 F1 arrived in orbit in May 2023, engineers discovered an antenna deployment anomaly that severely constrained the satellite’s throughput — reducing it to an estimated 5 to 10 percent of its intended capacity. For a company that had bet heavily on this generation of satellites to compete against the rising LEO constellations, the setback was consequential. Customers noticed. Starlink, with its terrestrially-derived latency characteristics and rapidly growing coverage, captured aviation connectivity contracts that Viasat had hoped to retain.
The setback also complicated Viasat’s financial position at a moment when the company was simultaneously integrating its transformative 2023 acquisition of Inmarsat — a deal that expanded the company’s maritime and government connectivity business dramatically but also loaded the balance sheet. ViaSat-3 F2, the second spacecraft in the constellation targeting the Americas and EMEA regions, flew on a ULA Atlas V and has been progressing through in-orbit testing, with its reflector deployment now completing after challenges posed by the spring eclipse season. As Viasat’s latest confirmation notes, F2’s final deployments are expected to complete over the coming weeks — meaning the company is, finally, beginning to see its multi-year, multi-billion-dollar satellite program deliver on its intended architecture.
ViaSat-3 F3 completing the constellation closes a strategic gap that has left Viasat without full global high-throughput coverage since the program began. The Asia-Pacific region — home to some of the world’s busiest aviation corridors, fastest-growing maritime trade routes, and largest underserved broadband markets — has been waiting for this capacity. As Abrahamian told Spaceflight Now, “We have a number of airline customers in the APAC region that are really anxious to get this capacity online so they can start serving their customers better.” When F3 enters service, the ViaSat-3 constellation will represent a genuinely global, high-capacity, dynamically flexible broadband network — something no single competitor can claim across every orbit regime.
The Broadband Wars: GEO Renaissance or Rearguard Action?
Here is where the analysis must become honest about the headwinds rather than merely celebrating the engineering achievement.
Viasat’s strategic context is brutal. Starlink has grown to more than two million subscribers, and its low-Earth orbit architecture delivers latency characteristics — typically below 40 milliseconds — that geostationary satellites, orbiting at altitudes 60 times higher, cannot physically replicate. The laws of physics impose a minimum round-trip delay of roughly 550 milliseconds on GEO communications; for most broadband applications this is acceptable, but for latency-sensitive traffic including video conferencing, interactive gaming, and real-time financial transactions, it represents a structural disadvantage no amount of throughput can fully compensate.
Amazon’s Project Kuiper presents a different competitive threat: well-capitalized, backed by Amazon Web Services infrastructure, and designed from the outset for the enterprise and consumer markets where Viasat has historically been strongest. Kuiper has struggled with deployment pace — the program had launched only 78 satellites by mid-2025, far behind the FCC’s schedule — but Amazon’s financial resources and strategic motivation to protect its cloud business by owning connectivity infrastructure represent a long-term competitive pressure that will not diminish.
And yet. It would be a mistake to write GEO satellites out of the connectivity story, for several reasons that the ViaSat-3 program crystallizes.
First, coverage economics. A single geostationary satellite at 35,786 kilometers altitude covers roughly one-third of the Earth’s surface. A LEO constellation providing equivalent global coverage requires hundreds to thousands of individual spacecraft, each with a design life measured in years rather than decades. The capital efficiency of GEO for serving large geographic areas — particularly over oceans and sparsely populated territories where ground infrastructure is limited — remains compelling. ViaSat-3 F3’s coverage of the Asia-Pacific region, from a single orbital position, encompasses an area that would require a significant fraction of a LEO constellation to replicate.
Second, the defense and government market. Viasat has historically derived substantial and growing revenue from U.S. and allied government customers who value the satellite’s dedicated capacity, security architecture, and the ability to integrate with existing military communication networks. ViaSat-3 F3 explicitly introduces “new forms of resilience for US and international government customers,” per Viasat’s official launch confirmation. The national security satellite broadband market values characteristics — including resistance to jamming, controlled access, and sovereign oversight — that a commercially operated LEO megaconstellation does not automatically provide.
Third, the multi-orbit future. The most sophisticated satellite operators today are not choosing between GEO and LEO. They are building hybrid architectures that leverage the throughput and geographic efficiency of GEO alongside the latency characteristics of LEO, using intelligent ground terminals and network management to route traffic dynamically. Viasat’s own NexusWave service integrates its GEO capacity with OneWeb’s LEO network for maritime customers. The ViaSat-3 constellation, as it reaches full operational capability, becomes a cornerstone of this hybrid strategy rather than a standalone product competing head-to-head against Starlink on latency.
The Economics of Reusability and the Launch Market’s Quiet Monopoly
Step back from the satellite payload for a moment and consider the launch vehicle. Falcon Heavy’s twelfth flight in eight years is, by any conventional measure, an extremely low flight rate for a rocket of this capability. Yet SpaceX has maintained a 100 percent mission success rate across all twelve flights, and the booster recovery on dual RTLS missions has become so routine that it barely registers as remarkable. This combination — extreme reliability at very low cadence — reflects a deliberate commercial strategy that deserves scrutiny.
There is, in practical terms, no alternative to Falcon Heavy in the current market for very large GEO satellites requiring maximum performance to orbit. ULA’s Delta IV Heavy was retired in 2024. Ariane 6, which was originally scheduled to launch ViaSat-3 F3 before development delays and the post-Ukraine reshuffling of launch manifest assignments moved the spacecraft to Falcon Heavy, offers an alternative for European and international customers — but it has struggled to achieve reliable launch cadence and its payload capacity to GTO falls below Falcon Heavy’s peak performance in expendable or partial-recovery configurations. Blue Origin’s New Glenn is operational but has experienced anomalies in early missions, limiting customer confidence. ULA’s Vulcan Centaur serves the national security market but does not offer the throw weight that Falcon Heavy provides.
This effectively means SpaceX holds a de facto monopoly on western heavy-lift launch services for the largest GEO satellites. That is not a comfortable position for an industry that values competitive tension to discipline pricing and incentivize innovation. Viasat, to its credit, originally sought Ariane 6 specifically to maintain European launch options and reduce dependence on SpaceX. The inability of European industry to deliver that alternative on schedule — a consequence of years of chronic underinvestment in European launch infrastructure and the disruption caused by Russia’s elimination from commercial launch markets after 2022 — left Viasat with no practical choice but to return to SpaceX.
The concentration of launch capability matters for industrial policy reasons as much as commercial ones. NASA’s decision to launch Europa Clipper on Falcon Heavy, saving an estimated $2 billion compared to the Space Launch System, was fiscally prudent but also highlighted how completely the U.S. government’s civil launch needs have become dependent on a single private company. When that company is also developing Starlink — a direct commercial competitor to satellite operators like Viasat — the dependency creates tensions that regulators and policymakers are only beginning to grapple with seriously.
Critical Perspectives: Concentration, Fragility, and the Starship Shadow
Any honest assessment of today’s launch must acknowledge the risks embedded in the picture it presents.
Market concentration is the most obvious concern. SpaceX’s dominance of the launch market — executing approximately half of all orbital launches worldwide in recent years, including virtually all U.S. commercial and government heavy lift — is without precedent in the space age. The company’s technical excellence is not in question. But technical excellence is not a sufficient safeguard against the risks that concentration creates: single points of failure in supply chain, the potential for pricing power to increase as competition diminishes, and the strategic complications that arise when a launch provider’s commercial interests are entangled with those of its customers. The European Space Agency and its member states have been reckoning with these consequences since Ariane 6 fell behind schedule; the U.S. government has been slower to act.
The ViaSat-3 F1 lesson is also worth carrying forward. A single antenna deployment anomaly on a satellite that cost hundreds of millions of dollars and several years to build reduced its throughput to a fraction of its designed capacity. For programs predicated on multi-terabit capacity, this kind of single-point failure can be financially devastating. The space insurance market absorbs some of this risk, but it cannot absorb the strategic cost of arriving at the GEO broadband market years late and at a fraction of expected capacity. The resilience of the ViaSat-3 program — its ability to absorb the F1 setback and continue toward F3 launch — reflects the financial depth that came with the Inmarsat acquisition. Smaller satellite operators would not survive an equivalent anomaly.
The Starship era represents a more fundamental disruption lurking behind today’s Falcon Heavy mission. SpaceX’s next-generation launch vehicle, still in flight testing, promises to carry payloads to low Earth orbit measured not in tens of metric tons but in hundreds — in a fully reusable configuration. When Starship reaches operational status, it will not merely compete with Falcon Heavy; it will displace it for most missions, while simultaneously enabling satellite constellation architectures of a scale and cost structure that will make today’s GEO programs look like the previous generation of space infrastructure — necessary, valuable, and eventually superseded.
The timing of ViaSat-3 F3 thus acquires a particular resonance. This spacecraft will likely remain in commercial operation for fifteen years or longer. By the time it retires from service in the early 2040s, the satellite broadband market will look almost unrecognizable compared to what we see today. The operators that survive will be those who have built the most flexible, multi-orbit, software-defined network architectures — and who have done so without betting so heavily on a single generation of hardware that they cannot pivot when the next generation arrives.
The Geopolitics of Coverage: Who Gets Connected, and Who Decides
Zoom out one more level, and the ViaSat-3 F3 launch carries implications that extend beyond corporate strategy into international relations and development economics.
The Asia-Pacific region is the world’s most economically dynamic. It is also the region with some of the most pronounced disparities in connectivity. The aviation market — Viasat’s primary immediate revenue target in the region — connects the affluent and the mobile. But the underlying capacity infrastructure that ViaSat-3 F3 provides will also serve maritime vessels, island communities, remote enterprise sites, and eventually, through service expansion, populations in some of the world’s most connectivity-starved areas.
This is not altruism on Viasat’s part; it is market expansion. But the geopolitical dimension is real. When U.S.-headquartered satellite operators extend high-throughput, high-reliability broadband coverage across the South China Sea, the Pacific Islands, and the maritime corridors of Southeast Asia, they are making infrastructure decisions that have strategic implications. The race between American and Chinese satellite operators for coverage of the Indo-Pacific region is not merely commercial — it is a contest over which country’s technical standards, legal frameworks, and network architectures become the default infrastructure for an economically and militarily critical region.
China’s own ambitions in this domain are serious and well-funded. China Satellite Network Group, the state-owned entity overseeing the Guowang LEO constellation, has filed for orbital slots that would place it in direct competition with Starlink and other western operators for limited spectrum resources. The completion of Viasat’s GEO coverage over the Asia-Pacific, combined with ongoing LEO buildout by U.S. operators, represents a concrete broadening of American-aligned connectivity infrastructure across a region where that presence matters.
Conclusion: The Weight of a Rare Launch
Eighteen months of quiet, and then: twenty-seven engines, 5.1 million pounds of thrust, a spectacular double booster landing, and a six-ton spacecraft on its way to geostationary orbit above the Pacific. There is something fitting about the rarity of Falcon Heavy’s flight pace. Each launch carries more weight — literal and figurative — than the routine. Each one lands in a market landscape that has shifted since the last, and must be interpreted against that shifting context.
Today’s mission completes what Viasat set out to build. Whether that completion arrives soon enough, at sufficient capacity, and at competitive enough terms to hold meaningful market share against the LEO operators is the question that will determine the company’s next decade. The honest answer is: probably, in some segments; probably not, in others. The in-flight connectivity and government markets will sustain meaningful GEO operators for the foreseeable future. The mass consumer broadband market — where Starlink and eventually Kuiper will compete on price and latency — is likely beyond recovery for GEO-only strategies.
But the more durable insight from watching Falcon Heavy lift off today is about the infrastructure of ambition. The rocket that launched a Tesla Roadster toward Mars for a demo flight in 2018 has, in twelve missions, launched classified military satellites, a spacecraft headed for Jupiter, weather observation platforms critical for hurricane forecasting, and now the final piece of the first commercially deployed global multi-terabit broadband constellation. It has done so at a fraction of what its predecessors cost, with a booster recovery system that turns what used to be expensive expendable stages into reusable assets.
That is the story the launch market keeps telling, in different configurations and with different payloads: that the economics of access to space have been permanently disrupted, that the disruption is still accelerating, and that the satellites we put up today will operate in a world the launch industry of a decade ago could not have anticipated. ViaSat-3 F3 will look down from 35,786 kilometers at a world connected in ways its designers planned for, and ways they did not. That is, perhaps, the most precise definition of infrastructure worth building.
Discover more from The Economy
Subscribe to get the latest posts sent to your email.



Navigating Mortgage and Loan Refinancing in a High-Yield Environment
Global public debt crossing critical thresholds has kept central bank policies volatile, resulting in fluctuating US Treasury yields throughout 2026. For homeowners and commercial property holders burdened by previous high-interest borrowing cycles, finding optimal refinance windows has become a high-stakes financial puzzle. Stalled disinflation and stubborn employment numbers mean rate cuts are incremental, requiring borrowers to act with precision.
Timing your mortgage or commercial loan refinance in this environment requires a deep understanding of yield curve movements and lender risk appetites.
Decoding 2026 Refinance Dynamics
The 10-Year Treasury Yield Benchmark
Mortgage rates continue to track closely with the 10-year US Treasury yield. When macroeconomic anxiety spikes debt issuance, yields rise, tightening consumer borrowing capacity. Savvy borrowers monitor weekly Treasury auctions to lock in rates during brief dip windows.
Hybrid ARMs and Alternative Structures
With fixed rates remaining elevated, 7/1 and 10/1 adjustable-rate mortgages (ARMs) have surged in popularity. These products offer lower initial monthly payments, giving borrowers breathing room until central bank easing cycles fully materialize.
| Loan Product | Current Rate Range | Best For | Key Risk Factor |
| 30-Year Fixed Mortgage | 6.2% – 6.8% | Long-term predictability | Higher initial monthly outlay |
| 7/1 Hybrid ARM | 5.5% – 5.9% | Short-term ownership / flipping | Rate reset risk after year 7 |
| Commercial Refinance | 7.0% – 8.2% | Corporate asset restructuring | Strict DSCR lender covenants |
Actionable Steps for Successful Refinancing
To maximize your chances of securing favorable refinance terms in a volatile market, follow a disciplined preparation strategy.
Boost Your Credit Score Immediately: Lenders in 2026 are applying stringent credit tiering; a 20-point increase can drop your APR by a crucial quarter-point.
Shop Regional Credit Unions: Smaller financial institutions often offer portfolio loans with more flexible underwriting than major national banks.
Calculate the Break-Even Point: Ensure your total closing costs are recouped through monthly savings within 24 months of closing.
“Market Strategist View: Refinancing in 2026 is an exercise in opportunistic timing. Borrowers must maintain immaculate financial profiles ready to strike the moment Treasury yields dip.”
Mastering the complexities of today’s debt environment ensures you can successfully lower your debt service costs and protect your long-term financial stability.
Discover more from The Economy
Subscribe to get the latest posts sent to your email.

The days of pulling generic auto insurance quotes based purely on your zip code and age are officially over. In 2026, insurance comparison engines are powered entirely by generative AI and real-time telematics. These platforms digest thousands of live data points—ranging from your driving smoothness via connected vehicle sensors to real-time traffic congestion patterns—to generate hyper-personalized premiums instantly.
For consumers, this evolution represents both a massive opportunity for savings and a hidden trap for penalty pricing. Understanding how AI algorithms evaluate risk is essential for anyone looking to lower their monthly auto insurance premiums.
How AI Comparison Engines Evaluate Your Risk Profile
Behavioral Telematics and Connected Cars
Modern cars stream performance data directly to insurance aggregators. Generative AI models analyze braking sharpness, acceleration curves, cornering G-forces, and phone distraction metrics. Drivers who maintain smooth, defensive habits are rewarded with dynamic rate cuts of up to 40% compared to traditional rating tiers.
Predictive Traffic and Weather Modeling
AI tools now cross-reference your daily commute route with predictive weather and accident probability models. If your standard parking location or driving corridor has a statistically higher incidence of uninsured motorist claims, your quotes will reflect that hyper-local risk assessment.
| Comparison Factor | Traditional Rating Model | 2026 Generative AI Model | Impact on Premium |
| Mileage & Usage | Annual estimated odometer reading | GPS tracking & live trip duration | High (up to 35% savings) |
| Driving Behavior | MVR driving record & accidents | Real-time braking, speed, & G-force | Critical (determines tier) |
| Vehicle Tech | Make, model, and safety rating | ADAS calibration & repair cost data | Moderate |
Strategies to Lower Your AI-Driven Insurance Quote
To outsmart the algorithm and secure the lowest possible premium in 2026, drivers must proactively manage their digital footprint on insurance platforms.
Opt-In for Telematics Trial Periods: Many insurers offer immediate 15% discounts just for installing their driving app; let it track safe habits for 30 days to lock in permanent savings.
Scrub Unverified Public Records: Ensure your motor vehicle report is free of clerical errors that AI risk models misinterpret as reckless behavior.
Compare AI Aggregators: Use platforms that integrate multi-carrier API feeds rather than single-brand comparison sites to find the best risk-adjusted rate.
“Industry Note: AI-driven pricing rewards transparency and precision. Drivers who actively manage their telematics data consistently out-save those relying on legacy quote calculators.”
Embracing AI comparison tools allows savvy policyholders to customize coverage limits precisely to their driving habits, eliminating wasted premium spend while ensuring robust protection.
Discover more from The Economy
Subscribe to get the latest posts sent to your email.

Despite decades of bans and strict handling mandates, asbestos remains a silent killer across legacy manufacturing plants, shipyards, and modern green-energy infrastructure retrofits. In 2026, regulatory changes by the EPA and tightened occupational health standards have triggered a fresh wave of mesothelioma litigation. Manufacturers attempting to fast-track industrial transitions are encountering catastrophic oversight, exposing workers to legacy toxins and opening corporate parent companies to unprecedented liability.
Navigating a mesothelioma claim in 2026 requires understanding how modern industrial supply chains intersect with historical exposure. Trusts established decades ago are being audited under stricter transparency laws, altering payout ratios and accelerating fast-track settlements for terminally ill plaintiffs.
Modern Industrial Exposure Hotspots
Green Retrofitting and Renewable Energy Infrastructure
A primary source of 2026 asbestos exposure occurs during the decommissioning and retrofitting of older industrial facilities for renewable energy production. Workers insulating electrical grids, modernizing HVAC systems, or upgrading manufacturing floors frequently disturb encapsulated asbestos materials that were improperly documented or ignored during facility audits.
Automotive and Aerospace Supply Chains
With advanced manufacturing booming, workers handling specialized friction materials, gaskets, and heat shields face ongoing risks. Supply chain tracing has become more sophisticated, allowing legal teams to pinpoint exact corporate entities responsible for raw material distribution across multinational borders.
| Industry Sector | Primary Exposure Risk | Legal Venue / Trust | Avg. Claim Value Range |
| Green Energy Retrofit | Disturbed insulation, pipe lagging | Federal Tort / Manufacturer Trust | $1.2M – $3.5M |
| Shipbuilding & Marine | Boiler insulation, structural seals | Asbestos Bankruptcy Trusts | $800K – $2.4M |
| Automotive Manufacturing | Brake components, high-heat gaskets | Third-Party Product Liability | $600K – $1.8M |
Securing Maximum Compensation: Steps for Plaintiffs
Time is of the essence in mesothelioma cases. Plaintiffs and their families must act decisively to secure financial recovery before statutes of limitations expire.
Retain Specialized Counsel: Work exclusively with national mesothelioma law firms possessing deep historical databases of asbestos-containing products.
Audit Employment History: Document every job site, supervisor name, and equipment brand encountered throughout your career.
Expedite Medical Filings: Secure a formal pathological diagnosis quickly to qualify for expedited trust fund distribution and priority trial settings.
“Expert Insight: Modern asbestos litigation is no longer just about historical tracking; it is about holding modern corporations accountable for failing to conduct rigorous environmental safety audits before initiating industrial retrofits.”
By combining meticulous work history reconstruction with aggressive multi-trust filings, victims can secure substantial financial relief to cover specialized immunotherapy and family support.
Discover more from The Economy
Subscribe to get the latest posts sent to your email.

Crypto Daily Outlook: Bitcoin, Altcoins, and the Future of Decentralized Finance

Anthony Scaramucci’s Crypto Prediction: Why MicroStrategy’s Move Is Bitcoin’s “iPhone Moment”

Best Dividend Stocks 2026: European & Asian Blue Chips

World Bank & IMF Reports 2026: Why the “3% Growth” Consensus Is Actually a Debate

Elon Musk’s Boring Company Hits $23B Valuation After UAE-Led $3 Billion Series D

Middle East War Economics 2026: Oil Prices & Energy Markets

PSX Forecast 2026: KSE-100, IMF Reviews & Geopolitics

Asian Markets Outlook 2026: China, Japan & Singapore Stocks

Global Economy 2026: IMF Growth, Inflation & Private Credit

Current Account Deficit (CAD) : Causes and Impact

Balance of Payments (BOP)

The Falkland Islands Dispute: Sovereign Wealth, Offshore Drilling, and Market Impacts

Gross Domestic Product (GDP): Nominal vs. Real

What is Inflation and the Consumer Price Index (CPI)?

State Farm’s $5B Dividend 2026: Who Qualifies & Payout Dates

US-China Relations in Q3 2026: Trade Tariffs and Supply Chain Risks

Gold’s Wild 2026: From a Record $5,600 Peak to a 24% Crash and Back Toward $4,500

Oil Surges as Strait of Hormuz Traffic Collapses Again

The Rocket That Won’t Quit: Inside SpaceX’s Falcon 9 Launch Machine

Bank of England Set to Hold Rates Through Year-End, Reuters Poll Shows

SpaceX Starship Flight 14: First Orbital Attempt & Starlink V3 Launch Explained

The 2026 Crypto Regulatory Shift: What It Means for Institutional Investors

AI Chip Stocks 2026: The Best Semiconductor Investments Beyond Marvell

Retail Earnings Week: What Home Depot, Target & Walmart Reveal

AI-Powered Training: The Next Multi-Billion Dollar Ecosystem in Fitness

Top 30 Stocks for Investment in PSX for Massive ROI in 2026

Tween Back-to-School Trends 2026: What’s Driving the $85B Season

Russia’s Black Sea Oil Exports Fall for a Fifth Straight Week
-

 Markets & Finance8 months ago
Top 15 Stocks for Investment in 2026 in PSX: Your Complete Guide to Pakistan’s Best Investment Opportunities
-

 Analysis7 months ago
Johor’s Investment Boom: The Hidden Costs Behind Malaysia’s Most Ambitious Economic Surge
-

 Analysis7 months ago
Top 10 Stocks for Investment in PSX for Quick Returns in 2026
-

 Analysis7 months ago
Brazil’s Rare Earth Race: US, EU, and China Compete for Critical Minerals as Tensions Rise
-

 Banks8 months ago
Best Investments in Pakistan 2026: Top 10 Low-Price Shares and Long-Term Picks for the PSX
-

 Investment8 months ago
Top 10 Mutual Fund Managers in Pakistan for Investment in 2026: A Comprehensive Guide for Optimal Returns
-

 Global Economy9 months ago
15 Most Lucrative Sectors for Investment in Pakistan: A 2025 Data-Driven Analysis
-

 Global Economy9 months ago
Pakistan’s Export Goldmine: 10 Game-Changing Markets Where Pakistani Businesses Are Winning Big in 2025