
Debt
US Household Debt Hits $18.8 Trillion as Student Loan Defaults Surge

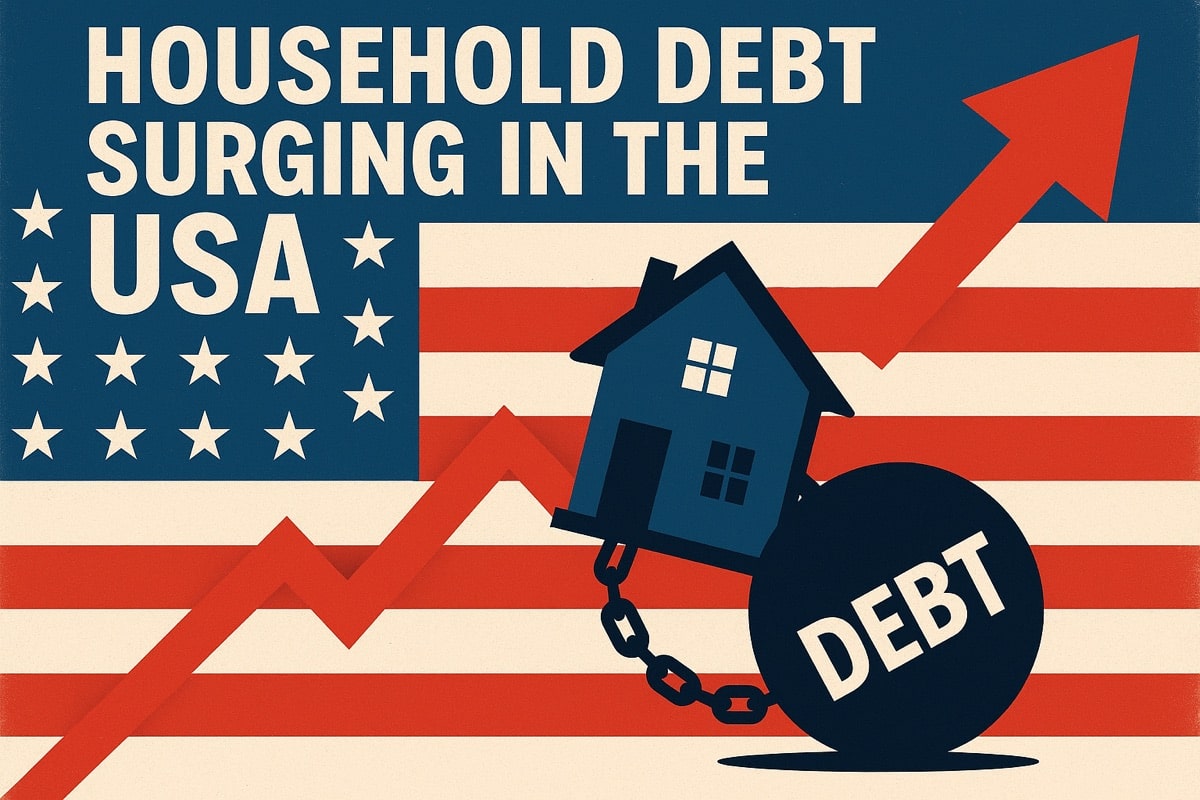
US household debt has risen to $18.8 trillion in Q1 2026 as 2.6 million additional student loan borrowers default and credit card balances stay near record highs. Here’s what the data reveals about the true state of American household finances.
Introduction: Behind the Economic Headlines, a Household Finance Crisis
The macroeconomic headlines of 2026 have been dominated by oil prices, the Iran war, and Federal Reserve drama. But beneath the market volatility and geopolitical maneuvering, a quieter and more personal crisis has been building in American household balance sheets — one that affects tens of millions of families far more directly than the dot plot or the Brent crude price.
The latest data from the Federal Reserve Bank of New York tells a sobering story: total US household debt has risen to $18.8 trillion, credit card balances remain near record levels despite a modest seasonal dip, and student loan defaults are surging at a pace that threatens the financial futures of millions of borrowers who never saw the crisis coming (Experian).
This article provides a comprehensive breakdown of where that debt sits, who is feeling the most pain, and what the numbers mean for the broader US economy.
The $18.8 Trillion Household Debt Mountain
According to the Federal Reserve Bank of New York’s latest Quarterly Report on Household Debt and Credit, total household debt rose slightly to $18.8 trillion in Q1 2026 (Experian). The increase was driven by:
- Mortgage balances — the largest component of household debt, reflecting persistently high home prices and elevated interest rates
- Auto loan balances — rising vehicle prices have pushed loan amounts higher even as transaction volumes moderate
- Home equity balances — homeowners drawing on equity built during the price surge, often to manage cash flow under inflationary pressure
Where Credit Card Debt Fits
Credit card balances showed a modest seasonal decline in Q1, falling $25 billion to $1.25 trillion — a pattern consistent with households paying down holiday spending in the first quarter (Experian). However, context is critical:
- The drop is seasonal, not structural — balances rose sharply through H2 2025 before this Q1 dip
- At $1.25 trillion, credit card balances remain near historic highs
- The credit card delinquency transition rate ticked down modestly from 8.7% to 8.6% annually — but at nearly 9%, this figure represents millions of households struggling to meet minimum payments
The Student Loan Default Surge: 2.6 Million New Defaults in One Quarter
The most alarming data point in the Q1 2026 household debt report involves federal student loans — a market where pandemic-era protections have expired and the consequences are now arriving with force.
According to the New York Fed, approximately 2.6 million additional federal student loan borrowers had their loans transferred to the Department of Education’s Default Resolution Group during Q1 2026 — following approximately 1 million defaults in late 2025 (Experian).
Who Are These Borrowers?
The profile of newly defaulted borrowers reveals a generation caught in a policy gap:
- Average age: nearly 39 years old — not recent graduates, but mid-career adults
- Many were current on their loans before the pandemic payment pause began in 2020 — the pause allowed them to divert loan payments to other needs, but also disrupted the financial habits and budget structures that supported regular repayment
- Average credit score drop: 91 points upon default — a devastating impact that affects their ability to rent housing, obtain car loans, or qualify for future credit (Experian)
In total, the cumulative wave of defaults since late 2025 represents one of the largest simultaneous hits to consumer credit profiles in modern US history.
The Consequences of Defaulting on Federal Student Loans
Defaulting on a federal student loan triggers a cascade of financial consequences that extend far beyond the loan itself:
- Wage garnishment — the federal government can garnish up to 15% of disposable income without a court order
- Tax refund seizure — the government can intercept federal and state tax refunds
- Federal benefit offsets — Social Security payments can be reduced
- Credit score destruction — the 91-point average drop makes housing, transportation, and future education financing significantly more expensive or inaccessible
- Exclusion from federal programs — defaulted borrowers may be ineligible for additional federal student aid or certain government employment
“Defaulting on a federal student loan has serious, long-lasting consequences,” Experian’s analysis notes. “While collections on defaulted loans are currently paused, that pause may not last.” (Experian)
The current pause on collections — a post-pandemic accommodation — provides temporary relief but does not resolve the underlying default status. When collections resume, millions of borrowers will face simultaneous enforcement actions.
The Inflation-Debt Spiral: How Rising Prices Feed the Default Wave
The connection between the current inflation environment and the surge in student loan defaults is not coincidental — it is structural.
At 4.2% CPI (CBS News), every dollar of after-tax income buys less than it did a year ago. For borrowers who were already stretching their budgets to service student debt, the inflationary squeeze — particularly in food (+3.2%), shelter (+3.3%), and especially energy (+28.4%) — created impossible math:
- Fixed loan payments + rising cost of living = insufficient income for both
- The resolution: stop paying the loan
This is not irresponsibility. It is a rational triage of competing financial obligations under conditions of economic stress. But it has catastrophic long-term consequences for the borrowers making this calculation.
What the Debt Data Means for the US Economy
The $18.8 trillion household debt figure matters beyond individual households — it has macroeconomic implications:
Consumer Spending Risk
Consumer spending drives approximately 70% of US GDP. When households are stretched by debt service obligations, spending on discretionary items contracts. The credit delinquency rate near 9% indicates a meaningful share of the population is already at or past the breaking point.
Financial System Stability
While federal student loans (held by the government) do not pose direct systemic banking risk, the broader pattern of consumer credit stress — elevated delinquencies across credit cards, auto loans, and mortgages — increases the probability of consumer-driven economic slowdown.
Fed Policy Complexity
High household debt loads make monetary tightening more dangerous. Every 25-basis-point rate hike increases the variable-rate borrowing costs for millions of households. The Fed must weigh inflation control against the risk of tipping already-stressed borrowers into default or deeper distress.
Practical Guidance: What Borrowers and Households Should Do Now
If You Have Federal Student Loans in or Near Default:
- Contact the Default Resolution Group or your loan servicer immediately — income-driven repayment plans can reduce monthly payments substantially
- Do not ignore notices — passive default leads to collections; active engagement preserves options
- Explore rehabilitation programs — one successful rehabilitation removes a default from your credit report
If You Carry High Credit Card Balances:
- Prioritize the highest-rate balances for accelerated paydown
- Consider balance transfer cards — competitive introductory rates are available even in the current rate environment
- Build an emergency fund to avoid cycling new charges back onto cleared balances
If You Are Managing Rising Mortgage or Auto Costs:
- Review your budget for recurring subscriptions and discretionary categories
- Explore refinancing opportunities — even in a flat rate environment, some borrowers can find marginal improvements
- Consider reaching out to lenders proactively if you anticipate difficulty — most have hardship programs not well-advertised
The Bigger Picture: What $18.8 Trillion in Debt Tells Us
The household debt picture in Q1 2026 is a portrait of an economy under simultaneous pressure from multiple directions: inflation eroding purchasing power, a supply-shock-driven energy price surge, expiring pandemic-era support programs, and a housing market still structurally unaffordable for many.
The $18.8 trillion figure is not in itself a crisis signal — debt can be sustainable at high levels if income and asset values grow proportionally. But the surge in student loan defaults, the near-record credit card balances, and the delinquency rates approaching 9% suggest that a meaningful portion of the household debt load is becoming unsustainable for the borrowers carrying it.
The new housing bill, if signed into law, offers some long-term structural relief. But for the 2.6 million borrowers who defaulted in Q1 2026 alone, that relief comes too late.
Frequently Asked Questions (FAQ)
Q: What is total US household debt in 2026?
Total US household debt reached $18.8 trillion in Q1 2026, according to the New York Federal Reserve Bank’s Quarterly Report on Household Debt and Credit.
Q: How many student loan borrowers defaulted in 2026?
Approximately 2.6 million additional federal student loan borrowers had their loans transferred to the Default Resolution Group in Q1 2026 alone, following approximately 1 million defaults in late 2025.
Q: What happens when you default on a federal student loan?
Consequences include wage garnishment, tax refund seizure, federal benefit offsets, a severe credit score drop (average 91 points), and exclusion from future federal aid programs.
Q: What is the US credit card delinquency rate in 2026?
The annual credit card delinquency transition rate was approximately 8.6% in Q1 2026 — down slightly from 8.7% but still near generationally high levels.
Q: How does inflation affect student loan defaults?
Rising costs of living — particularly energy (+28.4%), food (+3.2%), and shelter (+3.3%) — squeeze household budgets, making it increasingly difficult for borrowers to simultaneously service debt and meet essential expenses. Many borrowers facing this squeeze prioritize essential costs and default on student loans.
Discover more from The Economy
Subscribe to get the latest posts sent to your email.


A disclosure putting Robert Kiyosaki’s real-estate-linked debt at $1.2 billion has renewed scrutiny of the “Rich Dad Poor Dad” author’s leveraged investing philosophy, but the figure needs context: it represents financing tied to roughly 1,500 apartment units, not personal liability, with Kiyosaki’s own equity stake estimated by Vanity Fair at just $30–60 million. The debt story lands alongside Kiyosaki’s continued bullish public calls on silver (targeting $200/oz from a recent level near $85) and Bitcoin, both framed as hedges against what he calls an unsustainable US debt and currency picture.
Kiyosaki’s Balance Sheet vs. Asset Predictions
| Metric | Figure | Context |
|---|---|---|
| Reported total real-estate-linked debt | $1.2 billion | Financing roughly 1,500 apartment units (non-recourse, asset-backed structure) |
| Kiyosaki’s personal equity stake (est.) | $30–60 million | Per Vanity Fair, as relayed by his former wife/business partner Kim Kiyosaki |
| Silver spot price (recent) | ~$85/oz | As of Kiyosaki’s public commentary, mid-2026 |
| Kiyosaki’s long-term silver target | $200/oz | Public statements, 2026 |
| Bitcoin price at time of debt disclosure | ~$77,476 | Early September 2026 |
| Bitcoin 2026 year-to-date low point (July) | -33% YTD | Before August recovery |
| Bitcoin YTD performance after August rebound | -10.91% YTD | Trimmed from -33% low |
| US spot Bitcoin ETF inflows (August 2026) | $3.5 billion | Strongest monthly inflow since July 2025 |
| Kiyosaki’s cited US national debt figure | ~$39 trillion | Public commentary basis for currency-devaluation thesis |
| Kiyosaki’s 2024 Bitcoin prediction ($350,000 by Aug. 25, 2024) | Did not materialize | Disclosed as a prediction, not a guarantee, per his own framing |
Sources: Hokanews and COINOTAG (Sept. 1–2, 2026), CoinCentral and Pluang (May 2026), Yahoo Finance (Nov. 2025, cited for prior-year price-target context).
Deep Dive: Separating the Debt Headline From the Investment Thesis
What the $1.2 Billion Debt Figure Actually Represents
The headline number is attention-grabbing, but the underlying structure matters more than the total. According to reporting that traces back to comments from Kim Kiyosaki — Robert’s former wife and long-time business partner — the $1.2 billion in liabilities sits against a portfolio of approximately 1,500 apartment units, and represents financing secured by those income-generating properties rather than unsecured personal debt. Vanity Fair separately estimated Kiyosaki’s own equity share of the underlying real estate at a considerably smaller $30 million to $60 million.
This distinction is central to understanding Kiyosaki’s own stated investment philosophy, which has for decades drawn a sharp line between what he calls “productive” debt — borrowing secured by cash-flowing assets that can service the loan through rental income — and consumer debt used to finance depreciating purchases. Whether or not one agrees with the framework, the reporting is consistent that the $1.2 billion is not money Kiyosaki personally owes in full, and the properties themselves generate rental income that is structured to service the debt.
The Risk the Structure Doesn’t Eliminate
Asset-backed, non-recourse-style borrowing can preserve liquidity and let an investor retain ownership of underlying properties without needing to sell assets to raise cash — a genuine advantage of the approach in a rising or stable property market. But the structure does not eliminate risk: heavy leverage of this kind exposes the investor to higher financing costs when rates rise and to potential impairment if property performance (occupancy, rents, or valuations) softens. A $1.2 billion debt load against a $30–60 million personal equity stake implies substantial leverage — a structure that amplifies both potential returns and potential losses if the underlying 1,500-unit portfolio’s performance were to deteriorate.
The Silver Thesis: A Decades-Old Position, Not a New Trade
Kiyosaki has repeatedly emphasized that his silver position dates back to 1965, when he began accumulating the metal at age 18, at a time when it traded for pennies per ounce. With spot silver recently trading near $85 an ounce, he has set a long-term target of $200, framing the metal as both a monetary hedge against currency devaluation and a bet on industrial demand. He is not alone in flagging silver as undervalued: multiple market commentators have pointed to depleted CME warehouse inventories and rising industrial consumption (driven substantially by solar panel and electronics manufacturing) as structural supports for higher prices, independent of Kiyosaki’s own commentary.
The Bitcoin Thesis, and a Track Record Worth Weighing Honestly
Kiyosaki has for years ranked among Bitcoin’s most vocal price bulls, and it’s worth being direct about his track record on specific price calls: a June 2024 prediction that Bitcoin would reach $350,000 by August 25 of that year did not materialize, a point he has acknowledged while maintaining that the level would eventually be reached — a framing that treats missed timelines as a delay rather than an invalidation of the underlying thesis. Bitcoin’s own 2026 trading history adds relevant context for anyone weighing his current calls: the asset fell roughly 33% year-to-date by July under tight monetary conditions before a V-shaped August recovery trimmed that loss to roughly 11%, a rebound that coincided with $3.5 billion in US spot Bitcoin ETF inflows for the month — the strongest since July 2025.
The Macro Thesis Tying It Together
Kiyosaki’s public framing consistently returns to the same structural argument: roughly $39 trillion in US national debt, combined with what he describes as ongoing dollar devaluation dating back to 1974 (a reference to the post-Bretton Woods fiat currency era), creates conditions he believes will culminate in a broader economic reckoning. He has also flagged fragility in baby boomer retirement portfolios — heavily concentrated in traditional stocks and bonds — as a systemic vulnerability if his broader crash thesis were to play out. It’s worth noting plainly that this crash-timing call is not new; Kiyosaki has made similar warnings across multiple years, and mainstream forecasters, per available reporting, largely continue to project moderate rather than crisis-level economic conditions, even while acknowledging genuine risks around sovereign debt levels and geopolitical tensions.
Reading Leverage as a Philosophy, Not Just a Number
Perhaps the more durable, transferable lesson from the Kiyosaki debt story — independent of whether his specific silver or Bitcoin price targets prove accurate — is the framework itself: asset-backed leverage against cash-flowing real estate is a genuinely different risk profile than unsecured personal debt, but “different” does not mean “risk-free.” Investors evaluating any leveraged real estate strategy, their own or a public figure’s, should look past the headline debt total to the underlying loan-to-value ratios, income coverage, and personal-versus-asset-level liability structure before drawing conclusions about how exposed the equity holder actually is.
Actionable Takeaways for Investors
- Separate headline debt figures from personal liability exposure in any leveraged real estate story. A $1.2 billion portfolio-level debt figure against a $30–60 million personal equity stake tells you about leverage ratio, not about what the individual investor stands to lose in an absolute-dollar sense.
- Track CME silver inventory levels as an independent check on the undervaluation thesis. This is a verifiable, non-Kiyosaki-specific data point that multiple analysts have cited separately from his commentary.
- Weigh any specific price target against the forecaster’s own disclosed track record. Kiyosaki’s 2024 Bitcoin call that did not materialize by its stated deadline is public, documented context worth factoring into how much weight to place on his current $200 silver target or ongoing Bitcoin bullishness.
- Distinguish asset-backed leverage from consumer debt when evaluating your own portfolio’s risk. The productive-versus-consumer debt framework Kiyosaki popularizes is a genuinely useful mental model, applicable well beyond his specific real estate holdings.
- Monitor Bitcoin ETF flow data as a more immediate sentiment gauge than any single commentator’s price target. The $3.5 billion August 2026 inflow figure is a concrete, trackable data point that offers a more current read on institutional positioning than any individual’s long-term price call.
Frequently Asked Questions
How much debt does Robert Kiyosaki actually have?
Reporting places Kiyosaki’s total real-estate-linked debt at approximately $1.2 billion, financing roughly 1,500 apartment units, but this is asset-backed portfolio debt rather than personal liability — his own equity stake in the underlying properties is estimated at $30 million to $60 million by Vanity Fair.
What is Robert Kiyosaki’s silver price prediction for 2026?
Kiyosaki has set a long-term target of $200 per ounce for silver, up from a recent trading level near $85, framing the metal as both a currency-devaluation hedge and an industrial-demand play, consistent with a position he says he began building in 1965.
Did Robert Kiyosaki’s past Bitcoin price predictions come true?
Not always — a June 2024 prediction that Bitcoin would reach $350,000 by August 25, 2024 did not materialize, a target he has acknowledged missed its timeline while maintaining he believes the price level will eventually be reached.
Why does Robert Kiyosaki think a global economic crash is coming?
Kiyosaki attributes his crash prediction to roughly $39 trillion in US national debt combined with dollar devaluation he traces to 1974, along with what he views as fragile baby boomer retirement portfolios overexposed to traditional financial assets — though mainstream economic forecasters generally project moderate rather than crisis-level growth.
Discover more from The Economy
Subscribe to get the latest posts sent to your email.
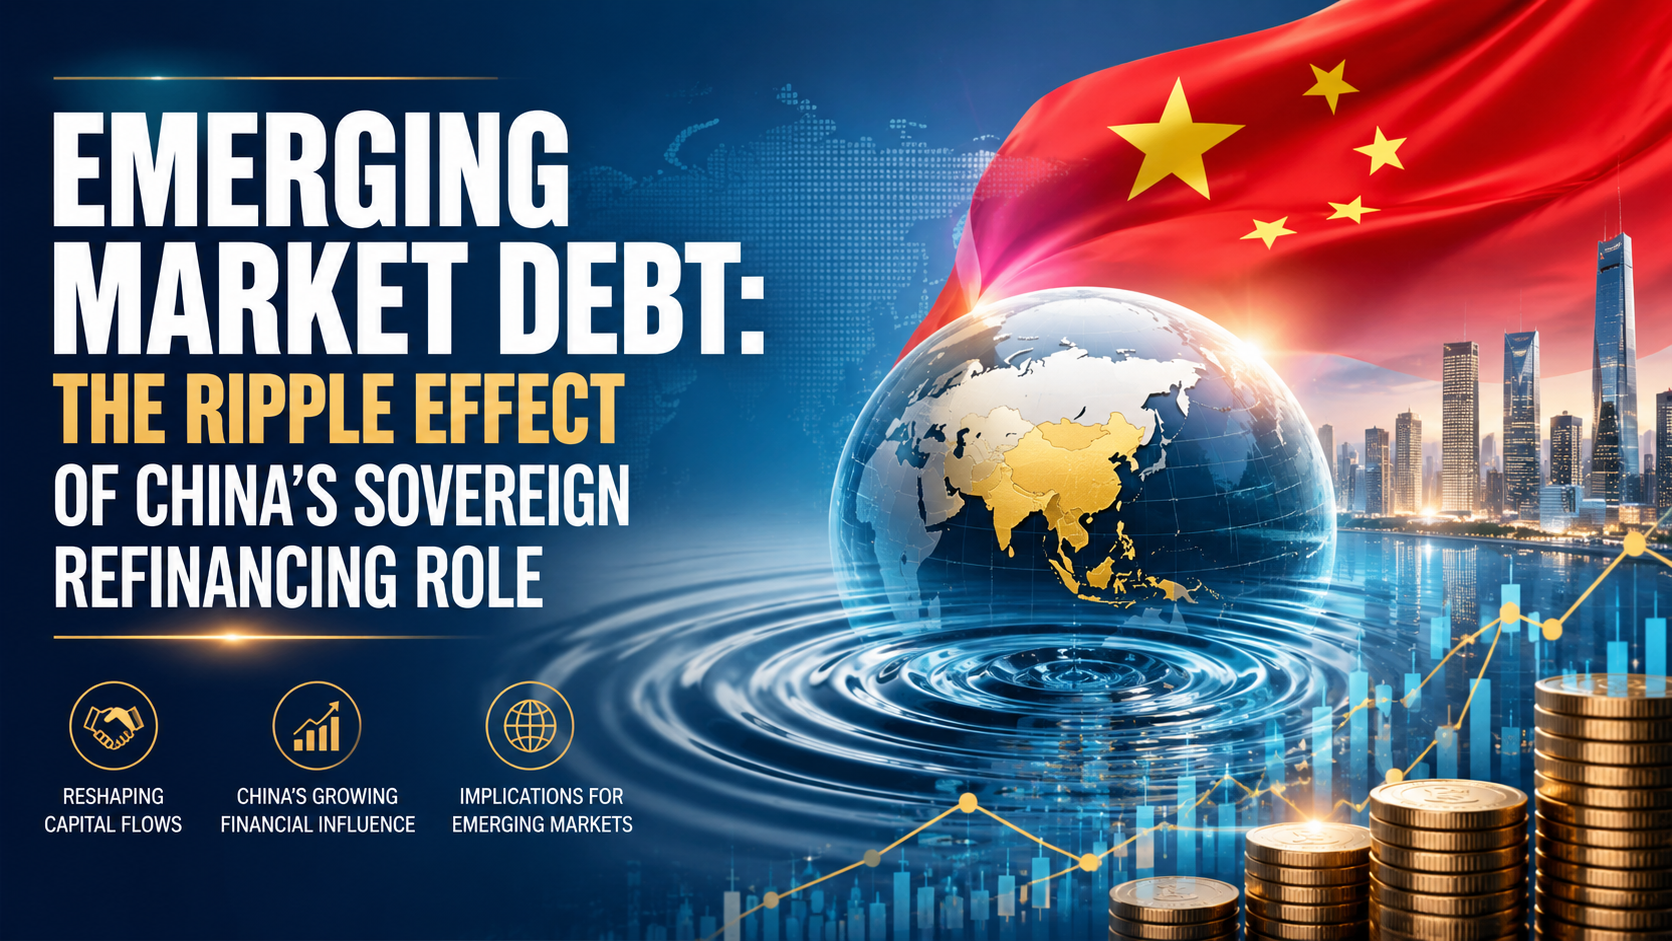
Emerging and developing economies face refinancing needs of more than $9 trillion in 2026, according to the Institute of International Finance’s Global Debt Monitor — the largest wall of maturing sovereign and corporate debt these markets have ever faced simultaneously. At the center of that system sits China, now the single largest issuer of emerging-market sovereign debt and, increasingly, the largest bilateral lender of last resort when smaller economies can’t refinance on their own. For institutional investors and foreign-policy-adjacent business strategists, understanding China’s dual role — dominant issuer and dominant creditor — is now a prerequisite for pricing emerging-market risk correctly.
Editorial note on sourcing: a specific figure describing a discrete “$1.3 billion” China sovereign refinancing transaction could not be independently verified against primary reporting at the time of writing. This article instead builds its analysis on verified, dated figures from the OECD, IIF, Moody’s, and peer-reviewed research, and any deal-level claim should be confirmed against primary sources (finance ministry statements, rating-agency releases) before publication or citation.
China’s Dual Role: Issuer and Creditor of Last Resort
China accounted for 45% of total EMDE sovereign bond issuance in 2024, up sharply from just 17% in the 2007–2014 period, according to the OECD’s Global Debt Report 2025. By 2025, China remained the top borrower among a concentrated group — China, India, Brazil, Egypt, and Argentina together represented 78% of EMDE central-government borrowing, per the OECD’s Global Debt Report 2026.
Domestically, Beijing has simultaneously executed one of the largest local-government debt refinancing programs in history: a 6 trillion yuan (roughly $839 billion) swap of “hidden” local-government debt into standardized bonds, approved in late 2024 and implemented through 2026, according to VOA News. By mid-2026, Chinese provinces had used nearly 94% of that swap allowance, according to Bloomberg.
Internationally, China has also re-entered dollar sovereign bond markets at scale — its 2026 international offering was reported as its largest ever, oversubscribed well beyond target, according to Business Standard/Reuters reporting on the prior comparable issuance. This dual positioning — massive domestic refinancing plus expanding international issuance — gives China outsized influence over EM bond-market liquidity and pricing benchmarks that smaller sovereigns then reference for their own issuance.
The $9 Trillion Wall: Why 2026 Is Different
The scale of what’s coming due matters more than any single deal. Key figures from the IIF’s Global Debt Monitor and OECD’s 2026 report:
- Gross EMDE central-government borrowing crossed $4 trillion in 2025, up from roughly $3 trillion in 2024.
- Around 36% of outstanding EMDE bond stock matures within three years.
- Low-income countries face the sharpest cliff: 52% of their outstanding bonds mature by 2028, with 29% due by the end of 2026 alone.
- Secondary-market yields on maturing debt now exceed 10% for non-investment-grade sovereigns, meaning refinancing at current rates locks in materially higher debt-service costs than the original issuance.
Refinancing Cost Comparison: Then vs. Now
| Issuer Tier | Original Issuance Yield (illustrative range) | 2026 Refinancing Yield | Refinancing Risk |
|---|---|---|---|
| Investment-grade EMDEs (e.g., select Gulf, Southeast Asia sovereigns) | 3–5% | 5–7% | Moderate — absorbable within fiscal space |
| Non-investment-grade EMDEs | 6–8% | 10%+ | High — debt-service costs rising faster than revenue growth |
| Low-income issuers (heavy China bilateral exposure) | Concessional/below-market | Market-rate or restructured terms | Severe — 29% of debt stock matures by end of 2026 |
Source: OECD Global Debt Report 2025/2026 (see citations above); ranges are illustrative of documented tier-level trends, not specific bond issues.
The Restructuring Precedent: What Happens When Refinancing Fails
China’s response to sovereign distress has evolved into a distinct pattern that investors increasingly price into risk premiums. Research published via the National Bureau of Economic Research documents a rising trend of “re-structurings” — repeated restructurings of the same debt with the same creditor — echoing the drawn-out resolution patterns of prior global debt crises. Angola, Ecuador, Seychelles, Sri Lanka, and Venezuela have each undergone two or more restructurings with Chinese state creditors.
Sri Lanka’s case is illustrative of the mechanics: China Development Bank extended a $500 million financing facility in 2020, and a subsequent equity-linked arrangement brought in $1.12 billion in cash that Colombo used to repay non-Chinese creditors, according to Oxford Academic’s International Affairs journal. These bilateral bridge arrangements illustrate how China’s rescue lending functions as a parallel track to traditional Paris Club-style restructuring — often faster to arrange, but less transparent to third-party bondholders pricing the same sovereign’s risk.
Regional Ripple Effects: Where Investors Should Watch Closely
Direct Exposure Zones
- Sub-Saharan Africa: Heaviest concentration of low-income issuers facing near-term maturity walls and prior China restructuring history (Angola, Zambia).
- South Asia: Sri Lanka’s precedent shapes how markets price Pakistan and Bangladesh refinancing risk.
- Latin America: Ecuador and Venezuela carry documented repeat-restructuring histories; Argentina remains among the top-five EMDE borrowers by volume.
Indirect / Second-Order Exposure
- Gulf and Southeast Asian investment-grade sovereigns face rising benchmark yields even without direct restructuring risk, simply because China’s issuance volume moves the EM bond-pricing benchmark broadly.
- Enterprise B2B lenders and trade-finance providers operating in these corridors should treat sovereign-refinancing stress as a leading indicator of counterparty and currency risk, not a lagging one.
An Investor Risk-Monitoring Framework
- Track maturity-wall concentration, not headline debt-to-GDP. A country with moderate debt-to-GDP but a heavy 2026–2028 maturity cliff carries more near-term risk than a higher-leverage country with a smoothed maturity profile.
- Distinguish China’s domestic refinancing (yuan-denominated, largely contained) from its role as an external EM creditor (dollar/foreign-currency exposure, higher spillover risk).
- Watch for repeat-restructuring signals. Countries with a prior China restructuring are statistically more likely to require another, per the NBER research above — treat this as a standing risk flag, not a one-time resolved event.
- Monitor secondary-market yield spreads on maturing debt versus issuance-year yields as the clearest real-time signal of refinancing stress building in a specific sovereign.
The Bottom Line
China’s simultaneous role as the largest domestic debt-refinancer in EM history and the most influential external creditor to distressed sovereigns makes it the single most important variable in the 2026 emerging-market debt outlook. The $9 trillion refinancing wall isn’t a uniform risk — it’s concentrated in low-income issuers with the heaviest prior China bilateral exposure, and that concentration is exactly where enterprise investors, trade-finance providers, and sovereign-risk analysts should be focusing due diligence through the remainder of 2026.
Discover more from The Economy
Subscribe to get the latest posts sent to your email.
There’s a number that keeps showing up in every conversation about Pakistan’s economy, and it keeps getting bigger: circular debt. As of early July 2026, the gas sector’s share of that debt alone has topped Rs 3.44 trillion, and Islamabad has missed a deadline the IMF set for tariff reforms meant to arrest the slide, according to Dawn.
What circular debt actually is, and why it won’t go away
Circular debt is the chain of unpaid obligations that builds up when the price consumers pay for electricity or gas doesn’t cover what it actually costs to produce and deliver it. Someone in the chain — a power producer, a gas utility, a state-owned enterprise — ends up carrying an IOU, and that IOU gets passed down the line. Earlier this year, IMF officials pressed Pakistan on exactly this dynamic, questioning the government’s plan to zero out gas-sector circular debt, according to Aaj English. At the time, officials said around Rs 150 billion remained payable to companies including Oil and Gas Development Company Limited and Pakistan Petroleum Limited.
Islamabad’s proposed fix included a Rs 5-per-unit levy on gas, dividends from state-owned companies redirected toward debt reduction, and the sale of 35 LNG cargoes annually on the international market. The IMF, per that same reporting, raised pointed questions about whether the plan was actually viable.
The commitments Pakistan has already made
Under its Extended Fund Facility, Pakistan has committed to capping circular debt growth at Rs 300 billion for FY2027 and cutting power-sector subsidies from 0.7% of GDP to 0.6%, according to details reported by ProPakistani. The government has also shifted Nepra’s annual tariff-rebasing cycle from July to January, and Ogra now revises gas tariffs twice a year instead of once.
Structurally, some of this is working. The IMF’s own review in May 2026 credited Pakistan with a primary fiscal surplus of 1.6% of GDP for FY26, broadly in line with program targets, and noted gross reserves had climbed to $16 billion by end-December, up from $14.5 billion six months earlier, according to the IMF’s own press release. That progress unlocked roughly $1.1 billion under the EFF and $220 million under a parallel climate-resilience facility, bringing total disbursements under the two arrangements to about $4.8 billion.
Where the fault lines actually are
The uncomfortable part of this story, laid out by commentary reported in The Hans India, is that revenue targets get IMF scrutiny with great precision, while structural reform of loss-making public enterprises — Pakistan International Airlines and Pakistan Steel Mills chief among them — moves far more slowly. Those enterprises’ losses are absorbed by the national exchequer through subsidies, guarantees, and debt restructuring year after year, and privatization plans keep slipping because the political cost of confronting them is high.
Distribution company inefficiency compounds the problem. In FY25, Discos posted Rs 265 billion in losses, an improvement on FY24’s Rs 276 billion but still a substantial drag, according to Geo News, with Quetta, Peshawar and Hyderabad among the worst-performing utilities.
What happens if the pattern holds
Pakistan’s debt-to-GDP ratio sits between 70% and 80% as of 2026, according to Wikipedia’s economic summary, with debt servicing occasionally consuming two-thirds of government spending. That’s the backdrop against which every circular-debt conversation happens: there is very little fiscal room left to absorb another missed deadline.
The missed gas tariff deadline doesn’t automatically trigger a program breakdown — Pakistan has weathered similar friction points before during its current EFF arrangement. But with the IMF’s own documentation showing persistent concern about the credibility of debt-reduction plans, and with global energy prices still elevated in the aftermath of the Iran war, the margin for further slippage is thin. The next review will likely hinge less on the rhetoric around reform and more on whether the Rs 5 levy and LNG cargo sales actually show up in the numbers.
Discover more from The Economy
Subscribe to get the latest posts sent to your email.

Silver Price Today: Why the Xi-Trump AI Standoff Is Fueling a Safe-Haven Rally

Citibank & Dólar Estadounidense: Forex Playbook After the Xi-Trump Truce

How the Trump-Xi White House Summit Is Reshaping Mortgage Rates Today for Real Estate Investors

Indonesia Navigates Mega-Project Risks as China and Russia Eye the 2,772km Trans-Kalimantan Railway

Trump-Xi 2026 Summit Takeaways: The Trade Truce, Taiwan, and the AI Divide

Solar Panel Installation Cost in 2026: Why the Math Changed Overnight

Business Insurance: What Coverage You Actually Need and What It Costs in 2026

Auto Insurance Quotes: How to Get the Lowest Rate Without Losing Coverage

Huntington Online Banking: Full Features, Fees, and How It Compares in 2026

Apply for a Bank Account Online: What You Need and How Long It Actually Takes

World’s Largest Economies: Ranking the Top Global Powers

Business Loan: A Complete 2026 Guide to Rates, Types, and Qualifying

Fast Invoice Factoring: How to Turn Unpaid Invoices Into Cash Within 24 Hours

Investment Banking Services: What They Cost and How to Choose the Right Firm in 2026

Top 30 Stocks for Investment in PSX for Massive ROI in 2026

SpaceX Starship Flight 14: First Orbital Attempt & Starlink V3 Launch Explained

Oil Prices Break $100 in 2026: Middle East Conflict & Energy Markets

BRICS+ Cross-Border Payments 2026: Interoperability Explained

AI Chip Stocks 2026: The Best Semiconductor Investments Beyond Marvell

Fidelity Investments Review 2026: SPAXX Yields & Zero-Fee Funds

Tween Back-to-School Trends 2026: What’s Driving the $85B Season

10-Year Treasury Yield Hits 4.80%: What It Means for Rates & Portfolios

Shein Clothes Quality & Safety in 2026: What Lab Tests Show

IMF & World Bank 2026 Global Economic Outlook: Growth, Inflation, Debt

China’s US$10.8 Billion Trade Shortcut: Why the Pinglu Canal Matters

High-CPM Finance Niches 2026: Publisher Monetization Blueprint

Middle East War Economics 2026: Oil Prices & Energy Markets

China Stocks Today: Are Big Economies in Asia Nearing a Market Bottom?
-

 Markets & Finance9 months ago
Top 15 Stocks for Investment in 2026 in PSX: Your Complete Guide to Pakistan’s Best Investment Opportunities
-

 Analysis7 months ago
Johor’s Investment Boom: The Hidden Costs Behind Malaysia’s Most Ambitious Economic Surge
-

 Analysis7 months ago
Top 10 Stocks for Investment in PSX for Quick Returns in 2026
-

 Banks8 months ago
Best Investments in Pakistan 2026: Top 10 Low-Price Shares and Long-Term Picks for the PSX
-

 Analysis8 months ago
Brazil’s Rare Earth Race: US, EU, and China Compete for Critical Minerals as Tensions Rise
-

 Investment9 months ago
Top 10 Mutual Fund Managers in Pakistan for Investment in 2026: A Comprehensive Guide for Optimal Returns
-

 Global Economy9 months ago
15 Most Lucrative Sectors for Investment in Pakistan: A 2025 Data-Driven Analysis
-

 Global Economy9 months ago
Pakistan’s Export Goldmine: 10 Game-Changing Markets Where Pakistani Businesses Are Winning Big in 2025