
Opinion
Pakistan’s Current Account Slips Back into Deficit: A Fragile Recovery Tested in December 2025

The chai shop owner in Karachi’s Saddar district doesn’t track monthly balance of payments data, but he feels it in his bones. When the rupee weakens and import costs rise, his supplier charges more for tea leaves shipped from Kenya. When remittances surge from his cousin in Dubai, neighborhood purchasing power ticks upward, and his modest business thrives. Pakistan’s external accounts—arcane to most citizens yet fundamental to everyday economic stability—tell a story that reverberates from corporate boardrooms in Lahore to family kitchens in rural Punjab.
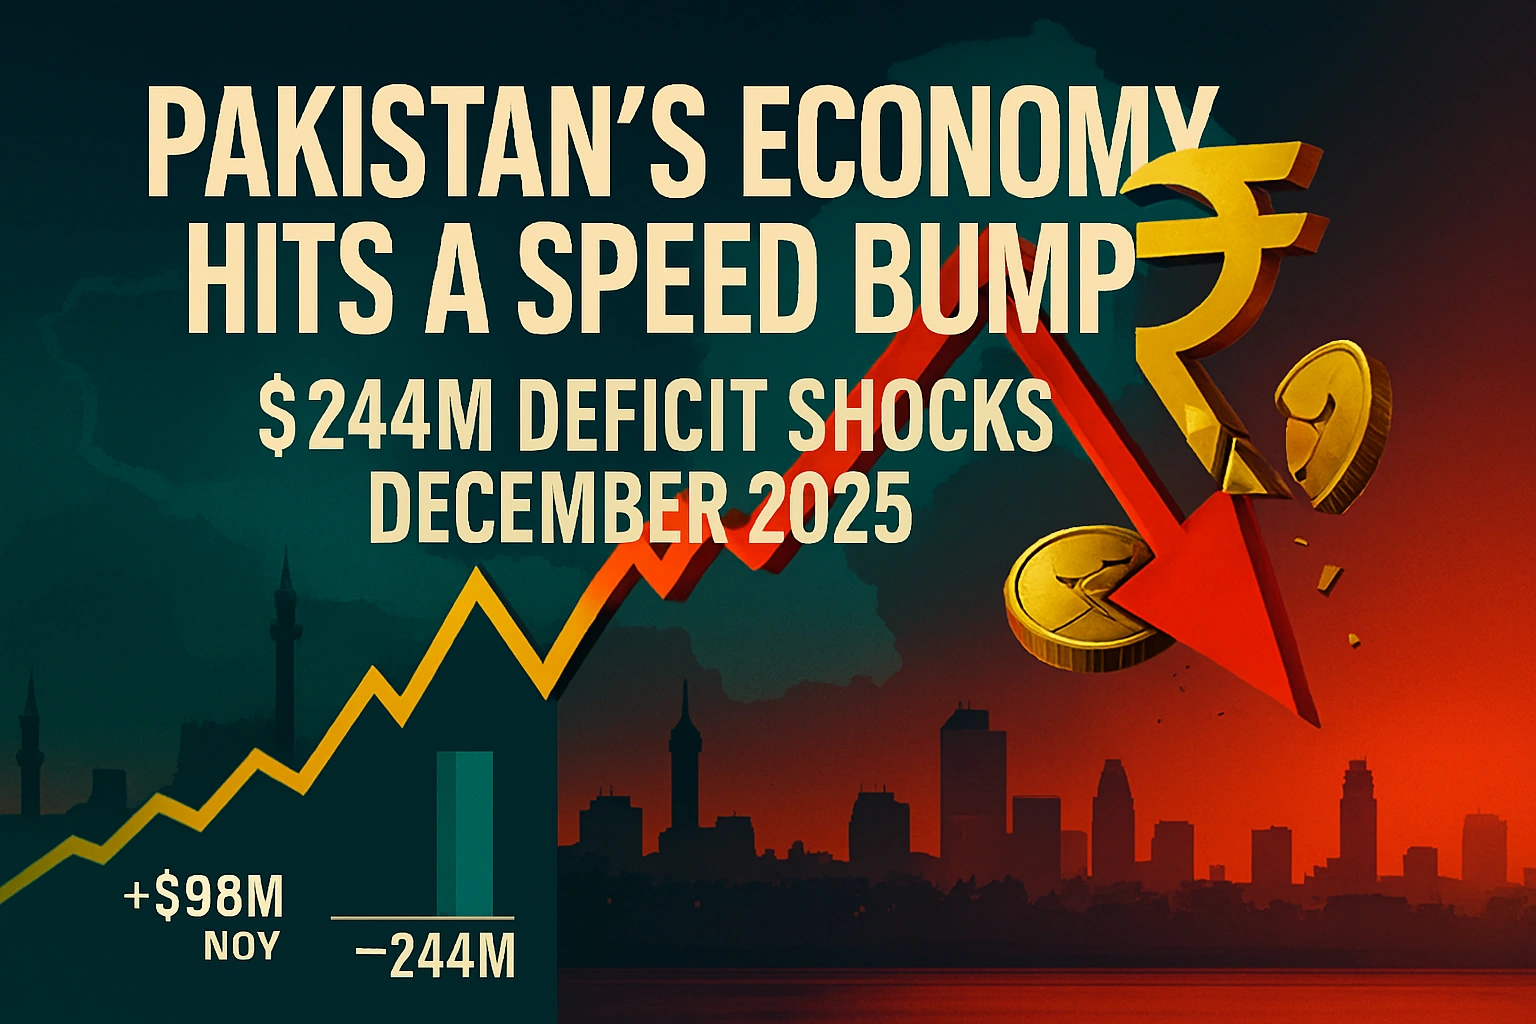
That story took an unexpected turn in December 2025. After eking out a modest $98 million current account surplus in November—a welcome sign that Pakistan’s post-crisis stabilization might be gaining traction—the State Bank of Pakistan (SBP) reported a sharp reversal: a $244 million deficit for December. The swing represents more than just monthly volatility; it encapsulates the fragile, two-steps-forward-one-step-back nature of Pakistan’s economic recovery following the near-meltdown of 2022-2023, when foreign exchange reserves plummeted to barely one month of import cover and default whispers rattled markets from Islamabad to Wall Street.
For context, December 2024 had delivered a comfortable $454 million surplus, making the year-on-year deterioration particularly striking. Yet zoom out further, and Pakistan’s fiscal year 2025 (July 2024–June 2025) still recorded a cumulative current account surplus—the first in years—offering a crucial buffer as the country navigates a $7 billion International Monetary Fund (IMF) Extended Fund Facility program designed to restore macroeconomic stability. December’s deficit, therefore, poses a critical question: Is this a temporary blip driven by seasonal import spikes and one-off factors, or an early warning that Pakistan’s external balance remains precariously dependent on remittance inflows and vulnerable to the slightest uptick in domestic demand or global commodity shocks?
This article dissects the December 2025 current account data with the rigor it demands, placing the numbers within broader historical trends, examining structural drivers from trade composition to energy dependence, comparing Pakistan’s trajectory with peer emerging markets, and assessing what this means for policymakers, investors, and ordinary Pakistanis as the country charts a course through 2026 and beyond.
Unpacking the December 2025 Numbers: Beyond the Headline Deficit
The Monthly Reversal: From Surplus to Shortfall
December’s $244 million deficit marks a $342 million swing from November’s revised $98 million surplus—a substantial shift in a single month for an economy where current account movements are measured in hundreds of millions rather than billions. More tellingly, the year-on-year comparison reveals a $698 million deterioration from December 2024’s $454 million surplus, signaling pressures beyond mere seasonal noise.
Breaking down the current account components clarifies the drivers:
- Trade Balance (Goods): Pakistan’s merchandise trade deficit widened appreciably in December, driven primarily by a surge in imports. Preliminary customs data from the Pakistan Bureau of Statistics suggests imports rose approximately 12-15% month-on-month, reflecting increased petroleum product shipments as winter heating demand spiked, higher machinery imports tied to delayed investment projects, and a restocking of intermediate goods by manufacturers anticipating Lunar New Year supply chain disruptions in China. Exports, while growing year-on-year at a modest 4-6%, failed to keep pace, constrained by energy shortages that intermittently shuttered textile mills—Pakistan’s export backbone—and sluggish demand from key European markets grappling with their own economic headwinds.
- Services Balance: This account remained persistently negative, albeit stable. Pakistan runs structural deficits in freight, transportation, and insurance services, exacerbated by reliance on foreign shipping for both exports and imports. Telecommunications and IT services exports—championed as a growth sector—contributed positively but remain insufficient to offset traditional service account drains.
- Primary Income Account: A chronic source of outflows, this component includes profit repatriation by multinational corporations, debt servicing payments to foreign creditors, and returns on foreign direct investment. December saw elevated outflows, likely tied to quarterly dividend payments by energy sector multinationals and scheduled debt obligations. According to World Bank data, Pakistan’s external debt stock exceeds $100 billion, with debt service ratios remaining elevated despite IMF-supported restructuring efforts.
- Secondary Income (Remittances): The undisputed bright spot. Pakistani workers abroad sent home a record $3.6 billion in December 2025, the highest monthly inflow on record and a 14% increase from December 2024’s $3.16 billion. This surge reflected seasonal patterns (expatriates sending funds for year-end festivities and winter expenses), improved formal banking channels following crackdowns on illegal hundi/hawala networks, and a modest depreciation of the rupee that enhanced the rupee-value of dollar remittances, incentivizing use of official channels. Remittances from Saudi Arabia, the UAE, the UK, and the US—Pakistan’s primary source countries—all posted gains, with Gulf Cooperation Council (GCC) countries alone accounting for nearly 60% of inflows.
Historical Context: FY25 Surplus Versus December Volatility
To appreciate December’s significance, consider Pakistan’s broader current account trajectory. Fiscal year 2023 (FY23, ending June 2023) saw a deficit exceeding $17 billion—over 6% of GDP—as import demand rebounded post-COVID while reserves hemorrhaged. This unsustainable imbalance triggered the 2022-2023 crisis, forcing stringent import controls, emergency IMF negotiations, and painful economic compression.
FY24 witnessed aggressive stabilization: import restrictions, steep interest rate hikes (the SBP’s policy rate peaked at 22% in mid-2023), and currency depreciation that dampened demand. The current account deficit shrank dramatically to approximately $1.2 billion for the full fiscal year—roughly 0.3% of GDP—a swing of over $15 billion. FY25 (July 2024–June 2025) went further, achieving a cumulative current account surplus of around $1.5-2 billion, driven by sustained remittance growth, contained imports, and marginally improved exports.
December 2025’s deficit, therefore, arrives against this backdrop of hard-won stability. Monthly volatility is normal—Pakistan’s current account has historically oscillated due to lumpy commodity imports (especially oil and LNG shipments), seasonal agricultural trade patterns, and irregular capital flows. A single deficit month doesn’t erase FY25’s surplus achievement. Yet it serves as a reminder: the underlying structure of Pakistan’s external accounts hasn’t fundamentally transformed. The economy remains heavily reliant on remittances to finance persistent trade deficits, with limited export diversification or import-substitution progress.
The Drivers Beneath the Surface: Trade Dynamics, Energy Dependence, and Remittance Resilience
The Persistent Trade Deficit: Import Addiction and Export Stagnation
Pakistan’s trade deficit—the gap between merchandise exports and imports—has long been the Achilles’ heel of its external balance. In December 2025, this gap widened notably, reflecting structural weaknesses decades in the making.
Import Composition and Vulnerabilities:
Pakistan imports roughly $50-60 billion annually, with several categories dominating:
- Energy (Petroleum, LNG, Coal): Constitutes 25-30% of total imports. Despite indigenous gas reserves, declining domestic production forces reliance on imported liquefied natural gas (LNG) for power generation and fertilizer manufacturing. Oil imports fluctuate with global crude prices and domestic consumption patterns. December’s import surge partly reflected higher LNG spot cargoes procured as winter power demand spiked and domestic gas shortfalls widened.
- Machinery and Transportation Equipment: Essential for industrial investment, these imports (15-20% of total) are economically productive but reflect limited local manufacturing capacity. December saw elevated machinery imports as businesses—buoyed by moderating interest rates and IMF program confidence—resumed delayed capital expenditure projects.
- Edible Oils, Pulses, and Food Products: Pakistan, despite its agricultural heritage, imports substantial food items due to population growth outpacing yield improvements and water scarcity constraining production. Palm oil from Indonesia and Malaysia alone accounts for billions annually.
- Chemicals, Plastics, and Intermediate Goods: Feedstock for textile and manufacturing sectors, these imports (20-25%) underscore the economy’s integration into global supply chains but also its vulnerability to input cost shocks.
The December import spike, while partly seasonal, highlights a critical policy tension: sustaining economic growth requires imports (machinery, energy, raw materials), yet unchecked import demand quickly exhausts foreign exchange reserves and widens the current account deficit. Pakistan’s growth-imports elasticity remains high—GDP growth of 3-4% typically correlates with 10-15% import growth unless demand is actively suppressed through monetary tightening or administrative controls.
Export Performance and Competitiveness Challenges:
Pakistan’s exports, hovering around $30-32 billion annually, are heavily concentrated:
- Textiles and Apparel: Account for 55-60% of merchandise exports. While Pakistan boasts competitive labor costs and proximity to cotton cultivation, the sector faces chronic challenges: energy shortages (load-shedding cripples production), outdated machinery, limited value-addition (focus on yarn and basic fabrics rather than high-end garments), and fierce competition from Bangladesh, Vietnam, and Cambodia. Recent reports from Dawn highlight how energy costs in Pakistan exceed regional competitors by 30-50%, eroding margins.
- Agriculture (Rice, Fruits, Vegetables): Contribute 15-20% but face quality standardization issues, inadequate cold chain infrastructure, and volatility tied to weather patterns and global commodity cycles.
- IT and Business Services: A bright spot, with exports exceeding $3 billion annually and growing at 15-20% yearly. However, this remains modest relative to India’s $200+ billion IT services sector.
December’s export growth, at 4-6% year-on-year, reflects incremental gains—textiles benefited from EU Generalized Scheme of Preferences (GSP+) status and recovering European demand—but insufficient to offset import surges. Structural constraints—inadequate investment in technology, skills mismatches, regulatory burdens, and infrastructure deficits (ports, logistics, power)—continue to hobble export competitiveness. According to the World Bank’s Logistics Performance Index, Pakistan ranks poorly (around 120th globally), impeding trade efficiency.
Remittances: The External Account’s Lifeline
December 2025’s record $3.6 billion remittance inflow underscores the Pakistani diaspora’s outsized role in propping up the external balance. Remittances have consistently exceeded $30 billion annually in recent years, often surpassing total merchandise exports. This dependence, while stabilizing, carries risks:
Drivers of Remittance Strength:
- Diaspora Demographics: Over 9 million Pakistanis work abroad, concentrated in GCC countries (Saudi Arabia, UAE, Qatar), the US, UK, and EU. GCC workers, typically in construction, hospitality, and services, send frequent, smaller remittances; Western diaspora remittances tend larger but less frequent.
- Policy Improvements: The SBP’s push to digitize remittances via fintech platforms (like JazzCash, Easypaisa), partnerships with international money transfer operators (Western Union, MoneyGram), and incentives (rupee credit at preferential rates) have channeled flows away from informal hawala networks. The Pakistan Remittance Initiative, launched years ago, has matured, enhancing tracking and convenience.
- Exchange Rate Dynamics: A weaker rupee incentivizes using formal channels—expatriates receive more rupees per dollar, enhancing purchasing power for families back home. December’s mild rupee depreciation likely contributed to record inflows.
- Global Economic Conditions: GCC economies, buoyed by moderating oil prices and economic diversification (Saudi Vision 2030, UAE’s non-oil growth), sustained employment for Pakistani workers. Western economies, despite slower growth, maintained demand for skilled professionals (IT, healthcare).
Vulnerabilities and Downside Risks:
- Oil Price Volatility: GCC economies—and thus Pakistani employment there—are highly sensitive to oil market dynamics. A sharp oil price collapse could trigger layoffs, reducing remittances by billions.
- Policy Shifts in Host Countries: Gulf states increasingly pursue “nationalization” policies (Saudization, Emiratization) to employ local citizens, potentially displacing South Asian expatriates. Geopolitical tensions or immigration policy changes in Western countries could also dampen flows.
- Demographic and Economic Shifts in Pakistan: As Pakistan’s economy develops (albeit slowly), remittance growth may plateau if opportunities at home improve, reducing emigration incentives. Conversely, economic distress could spur emigration but might also depress the asset base families can leverage for migration.
For now, remittances remain robust, but treating them as a perpetual safety net invites complacency. Sustainable external balance requires addressing the trade deficit’s root causes, not merely offsetting it with diaspora largesse.
Pakistan’s External Position in Global Context: Lessons from Peer Emerging Markets
How does Pakistan’s current account volatility compare with similarly positioned emerging economies? Examining peers illuminates both shared challenges and unique vulnerabilities.
Turkey: A Parallel in Chronic Deficits and Unorthodox Policies
Turkey, like Pakistan, has grappled with persistent current account deficits—averaging 3-5% of GDP—driven by energy import dependence (Turkey imports 75%+ of energy needs) and robust domestic consumption. Turkey’s deficits widened alarmingly in 2022-2023 amid unorthodox monetary policies (President Erdoğan’s low-interest-rate doctrine despite soaring inflation), sparking currency crises and reserve depletion eerily reminiscent of Pakistan’s travails.
However, Turkey differs crucially: its export base is far more diversified and technologically advanced (automotive, machinery, electronics), and tourism inflows contribute substantial services receipts. Turkey’s economy is also larger (GDP over $900 billion vs. Pakistan’s ~$350 billion), affording greater shock absorption capacity. Both nations share reliance on external financing and vulnerability to Fed rate hikes, yet Turkey’s NATO membership and EU integration (despite setbacks) provide geopolitical buffers Pakistan lacks.
Egypt: IMF Programs and Persistent External Fragility
Egypt offers perhaps the closest parallel. Both Egypt and Pakistan have cycled through multiple IMF programs over decades, facing recurrent foreign exchange crises rooted in import-dependent growth models, energy subsidies, and weak export competitiveness. Egypt’s current account deficit, traditionally 2-4% of GDP, spiked during the 2022 global commodity shock, triggering sharp currency devaluation (the pound lost 50%+ of value) and emergency IMF interventions.
Egypt’s Suez Canal receipts (a unique asset) provide substantial services income, yet like Pakistan, it relies heavily on remittances from expatriates in the Gulf and Europe. Both nations face similar structural challenges: youthful, rapidly growing populations outpacing job creation, heavy public debt burdens (constraining fiscal space), and political-economic governance issues that deter sustained foreign investment. Egypt’s recent economic struggles—despite $8 billion UAE investment deals and IMF support—underscore how fragile emerging market external balances can reverse quickly under adverse shocks.
Bangladesh and Vietnam: Export-Led Contrasts
Bangladesh and Vietnam present instructive contrasts. Both have achieved sustained current account surpluses or manageable deficits through export-led growth. Bangladesh’s ready-made garment (RMG) sector, while facing labor and safety challenges, generates $40+ billion in annual exports, surpassing Pakistan’s total goods exports despite a smaller economy. Vietnam’s integration into global manufacturing supply chains (electronics, footwear, furniture) has driven export growth exceeding 10% annually, attracting massive foreign direct investment.
These successes hinge on policy consistency, infrastructure investment, trade openness, and business-friendly environments—areas where Pakistan has struggled due to political instability, inconsistent economic policies across governments, and bureaucratic inefficiencies. The comparison underscores that Pakistan’s external account woes aren’t fate but reflect addressable policy failures and governance deficits.
Policy Implications and the Road Ahead: Navigating IMF Conditions, Monetary Policy, and Structural Reforms
The IMF Extended Fund Facility: Lifeline or Straitjacket?
Pakistan’s current $7 billion IMF Extended Fund Facility (EFF), approved in 2024 following protracted negotiations, imposes strict conditions: fiscal consolidation (reducing budget deficits through tax revenue increases and expenditure controls), energy sector reforms (tariff adjustments to eliminate circular debt), State-Owned Enterprise (SOE) restructuring, and exchange rate flexibility. Meeting these targets unlocks tranches of financing and signals credibility to bilateral lenders (China, Saudi Arabia, UAE) and markets.
December’s current account deficit, while modest, complicates the IMF program’s narrative of stabilization. IMF reviews scheduled for early 2026 will scrutinize whether the deficit represents a temporary aberration or a worrying trend. Key metrics monitored:
- Gross Official Reserves: As of late December 2025, SBP reserves stood around $11-12 billion—equivalent to roughly 2.5 months of import cover, a marked improvement from the sub-$4 billion nadir of mid-2023 but still below the comfortable 3-4 month buffer recommended for emerging markets. Sustained current account deficits could erode reserves, jeopardizing IMF targets.
- External Financing Gap: The IMF program assumptions include projections of bilateral support, FDI inflows, and bond market access. Widening current account deficits would increase the financing gap, potentially necessitating additional IMF disbursements or supplementary bilateral loans—complicating debt sustainability.
- Exchange Rate Management: The SBP has moved toward greater exchange rate flexibility, a key IMF demand. However, managing the rupee’s depreciation without sparking inflation or capital flight remains delicate. December’s modest weakening (rupee depreciated from ~278 to ~281 per USD) likely contributed to remittance inflows but also raised import costs, feeding inflation.
The policy tension is acute: supporting growth (which Pakistan desperately needs to reduce poverty and unemployment) requires accommodative conditions, yet unchecked growth risks import surges, reserve depletion, and current account blowouts. The SBP’s recent rate cuts—from the 22% peak to around 13% by late 2025—reflect confidence in declining inflation (down to single digits) and stabilization progress. December’s deficit may test whether further rate cuts are prudent or whether monetary policy needs to remain restrictive to cap import demand.
Fiscal Policy and Structural Reforms: Beyond Stabilization to Transformation
Monetary tightening and IMF programs can stabilize external accounts temporarily, but sustainable balance requires structural transformation:
- Export Diversification and Value Addition: Pakistan must move beyond low-value textiles to higher-margin products—branded garments, technical textiles, engineering goods. This demands investment in vocational training, R&D, quality certifications, and trade facilitation. Government initiatives like the Strategic Trade Policy Framework aim to incentivize non-traditional exports (pharmaceuticals, surgical instruments, sports goods), but implementation lags.
- Energy Sector Overhaul: Chronic energy shortages and high costs cripple competitiveness. Addressing this requires diversifying the energy mix (renewables, indigenous coal, hydroelectric), resolving circular debt (over $2.5 billion in payables), and improving distribution efficiency. Recent Chinese investments under the China-Pakistan Economic Corridor (CPEC) added generation capacity, but transmission bottlenecks and governance issues persist.
- Import Substitution in Agriculture and Industry: Reducing reliance on imported edible oils, pulses, and pharmaceuticals through productivity enhancements, agricultural R&D, and local manufacturing can narrow the trade deficit. Pakistan’s agricultural yields lag regional peers due to water scarcity, outdated farming techniques, and inadequate extension services.
- Investment Climate and FDI: Pakistan attracts only $2-3 billion in FDI annually—far below potential given its market size and location. Security concerns, regulatory unpredictability, corruption, and inconsistent policies deter investors. Successful examples like Bangladesh’s Special Economic Zones (SEZs) offer models, yet Pakistan’s SEZ progress remains slow.
- Debt Management: External debt servicing consumes substantial foreign exchange. Lengthening debt maturities, securing concessional financing, and improving debt transparency (addressing concerns from Financial Times reporting on hidden liabilities) are critical.
The Political Economy Wildcard: Stability Versus Turbulence
Economic policy in Pakistan is inseparable from political dynamics. The current government’s ability to sustain IMF program compliance depends on political stability—avoiding mass protests, military-civilian tensions, or populist pressures that derail reforms. Elections, coalition dynamics, and judicial interventions have historically disrupted economic policy continuity, with each government prioritizing short-term relief over long-term transformation.
December’s deficit, modest as it is, could embolden critics arguing that stabilization is choking growth and demanding stimulus measures (subsidies, lower interest rates, relaxed import controls). Resisting such pressures requires political courage and effective communication—explaining to the public why short-term pain (higher taxes, costlier imports) yields long-term gain (stable currency, lower inflation, job creation).
Outlook for 2026 and Beyond: Fragile Optimism Amid Persistent Risks
FY26 Current Account Projections: Navigating a Narrow Path
Most analysts, including the IMF and Asian Development Bank, project Pakistan’s FY26 (July 2025–June 2026) current account deficit to remain modest—between 0% and 1% of GDP, or roughly $0-3.5 billion. This forecast assumes:
- Continued Remittance Strength: Sustained inflows around $32-35 billion annually.
- Moderate Import Growth: GDP growth of 2.5-3.5% (below potential but stabilization-constrained) limiting import demand to $55-58 billion.
- Export Recovery: Gradual improvement toward $33-35 billion, aided by textile sector revival, IT services growth, and potential new export markets (Central Asia, Africa).
- Energy Price Stability: Global oil and LNG prices averaging $75-85/barrel and $10-12/MMBtu respectively, avoiding major import bill shocks.
December’s deficit complicates this picture only marginally if it proves transitory. However, downside risks loom large:
Domestic Risks:
- Political Instability: Governance crises, mass mobilizations, or civil-military discord could derail reforms, spook investors, and trigger capital flight.
- Energy Crisis Deepening: Another summer of severe load-shedding (likely if rainfall is poor and hydroelectric generation falls) could crush exports and industrial output.
- Fiscal Slippage: Missing IMF fiscal targets due to weak tax collection or populist spending could halt program disbursements, draining reserves.
External Risks:
- Global Recession: A sharp slowdown in the US, EU, or China would depress export demand and remittances. Recession in Gulf economies (tied to oil price crashes) could slash remittances by 15-20%, eliminating the current account’s safety buffer.
- Fed Rate Path: Continued or renewed Fed tightening could strengthen the dollar, making debt servicing costlier and reducing emerging market capital flows to Pakistan.
- Commodity Price Shocks: Geopolitical disruptions (Middle East conflicts, Russia-Ukraine escalation) could spike oil prices, widening the trade deficit by billions overnight.
- China Economic Malaise: Slower Chinese growth affects Pakistan via reduced CPEC-related inflows, weaker regional demand, and potential disruptions to supply chains Pakistani manufacturers depend upon.
Scenarios: Best Case, Base Case, Worst Case
Best Case (Probability: 20-25%):
Political stability holds, IMF program fully implemented, global growth surprises upward. Remittances exceed $36 billion, exports surge to $36 billion on textile revival and new sectors (IT crosses $4 billion), imports contained below $57 billion. Current account swings to a $2-3 billion surplus in FY26. Reserves climb toward $15 billion, improving investor confidence. The SBP can cut rates further (to 10-11%), spurring growth to 4%. Pakistan exits the “crisis loop” narrative.
Base Case (Probability: 50-55%):
Muddling through continues. IMF program stays on track with occasional hiccups. Remittances hold steady ($33-34 billion), exports grow modestly ($33 billion), imports edge up ($56-57 billion). Current account deficit widens slightly to 0.5-1% of GDP ($2-3.5 billion), manageable with IMF/bilateral inflows. Reserves stable at $11-13 billion. Growth stays subdued at 2.5-3%. December’s deficit seen as monthly noise, not trend reversal. Vulnerabilities persist but crisis averted for another year.
Worst Case (Probability: 20-25%):
Political turmoil erupts, halting reforms. Energy crisis worsens, crushing exports. Global recession slashes remittances to $28-30 billion. Imports jump on supply shocks or policy relaxation. Current account deficit balloons to 2-3% of GDP. Reserves plummet below $8 billion. IMF halts program over non-compliance. Currency crisis reemerges, inflation spikes, and another painful stabilization cycle begins. Pakistan returns to the brink.
Conclusion: Resilience Tested, Transformation Awaited
December 2025’s $244 million current account deficit—a sharp reversal from November’s surplus and a stark contrast to December 2024’s surplus—offers a sobering reminder: Pakistan’s external balance, though stabilized relative to the 2022-2023 abyss, remains fragile. The deficit isn’t catastrophic; in fact, monthly fluctuations of this magnitude are typical for an economy juggling import needs, energy dependencies, and external financing constraints. But context matters.
Pakistan has achieved remarkable stabilization over the past 18-24 months. Reserves have recovered from critically low levels, inflation has decelerated from over 30% to single digits, and the currency has stabilized. The cumulative FY25 current account surplus stands as a testament to painful but necessary adjustments—import compression, high interest rates, and policy discipline under IMF oversight. December’s deficit doesn’t erase these gains, but it underscores the work that remains.
The underlying drivers—persistent trade deficits rooted in import dependence and export stagnation, reliance on remittance inflows vulnerable to external shocks, and structural weaknesses in energy, productivity, and governance—haven’t fundamentally changed. December’s surge in imports, while partly seasonal and growth-related, highlights how quickly external balances can deteriorate if demand isn’t carefully managed. The record remittances, while reassuring, cannot indefinitely paper over a trade structure biased toward deficits.
For policymakers, the message is clear: stabilization is not transformation. Sustaining external balance through the IMF program’s duration (likely through mid-2026) requires vigilance—monitoring import trends, maintaining exchange rate flexibility, ensuring fiscal discipline, and preserving political commitment to reforms. Beyond stabilization, Pakistan must pursue deeper structural changes: diversifying exports, enhancing competitiveness, overhauling energy, attracting FDI, and improving governance. These transformations, admittedly difficult and politically contentious, are the only pathway to durable external stability and sustained growth.
For investors and international observers, December’s data warrants measured concern but not alarm. Pakistan remains on a tightrope—progress is real but reversible. The country’s trajectory depends critically on political stability, global economic conditions, and the resolve of its leadership to prioritize long-term transformation over short-term expediency.
And for the chai shop owner in Saddar? He’ll continue watching the rupee-dollar rate on his phone, feeling the pulse of remittance inflows when customers spend more freely, and weathering import price shocks that trickle down to his tea leaves. Pakistan’s external accounts are, ultimately, the story of millions of such individuals—navigating global economic forces far beyond their control, seeking stability and opportunity in a nation perennially balancing on the edge of crisis and recovery. December 2025’s deficit is one chapter in that unfolding story. Whether it’s a minor setback or the first crack in a fragile stabilization will become clear in the months ahead.
Sources and Further Reading:
- State Bank of Pakistan – Current Account Statistics
- International Monetary Fund – Pakistan Country Page
- World Bank – Pakistan Data
- Dawn – Pakistan Economy News
- Business Recorder – Latest Economic Updates
- Financial Times – Emerging Markets Coverage
- Reuters – Pakistan Economic News
- Trading Economics – Pakistan Indicators
- World Bank Logistics Performance Index
- Pakistan Bureau of Statistics
Discover more from The Economy
Subscribe to get the latest posts sent to your email.



The global video game industry now generates more annual revenue than the entire GDP of Hungary — and it did so with an audience of 3.6 billion people, close to half of humanity, playing regularly. Gaming has quietly become one of the most reliable case studies in how digital consumerism scales into genuine macroeconomic weight, reshaping everything from U.S. GDP contribution figures to sovereign wealth fund allocation strategy in the Gulf. Here’s the full economic picture as of 2026.
The Headline Numbers: A Market the Size of a Mid-Sized Economy
Sizing the global games market precisely depends heavily on methodology — narrower estimates that track only direct consumer game spending land meaningfully lower than broader “gaming market” figures that fold in hardware, services, and adjacent digital media. Using the more conservative, widely cited Newzoo-based figures, the global games market reached $188.8 billion in 2025 and was forecast to hit roughly $205 billion in 2026, a 4.6% rise, according to SQ Magazine’s 2026 data breakdown. Visa’s own economic analysis frames that 2026 figure in a striking way: at roughly $205 billion, the games market is now “close to the value of a mid-sized European economy such as Hungary,” according to Visa’s consulting and analytics team.
Broader market-sizing methodologies that include hardware and adjacent digital services put the figure considerably higher — Statista’s forecast projects $577.9 billion in 2026 games-market revenue growing at a 6.58% CAGR through 2030, while other industry trackers cite figures ranging from $250 billion to over $400 billion depending on scope, according to a range of 2026 market reports from Straits Research, Mordor Intelligence, and Grand View Research. Whichever methodology is used, the direction is consistent: gaming is one of the fastest-structurally-growing segments of the global entertainment economy, and unlike film or television, its growth curve has held up through multiple macroeconomic cycles.
Gaming market size by source (2026 estimates — note methodology varies):
| Source | 2026 Estimate | Scope |
|---|---|---|
| Newzoo / SQ Magazine | $205 billion | Direct consumer game spend |
| Visa Consulting | $205 billion | Consistent with Newzoo |
| Straits Research | $250.9 billion | Broader market definition |
| Mordor Intelligence | $224.7 billion | Platform + regional breakdown |
| Grand View Research | $374.8 billion | Includes adjacent segments |
| Statista Market Forecast | $577.9 billion | Broadest — includes hardware/services |
The Player Base: Nearly Half the Planet
The scale of gaming’s consumer base is the real driver of its macroeconomic relevance. The worldwide player base reached 3.58 billion in 2025 — over 60% of the world’s online population — and is forecast to approach 4 billion by 2028, according to Newzoo data cited by SQ Magazine. Visa’s analysis separately projects 3.8 billion gamers by 2026, or nearly half the world’s population.
Mobile dominates that base by a wide margin: mobile gaming reaches roughly 3 billion players (83% of all gamers), well ahead of PC at 936 million and console at 645 million, per SQ Magazine’s 2026 breakdown. That platform split matters commercially — mobile also leads on revenue share at 55% of total industry spend, even though console posted the fastest year-on-year segment growth in 2025 at +5.5%.
Regional revenue leaders (2025 data):
| Region | Revenue | Notes |
|---|---|---|
| Asia-Pacific | $87.6 billion | Largest region by revenue |
| North America | $52.7 billion | — |
| China | $49.8 billion | Largest single country |
| United States | $49.6 billion | Close second to China |
The U.S. Case Study: Gaming as Measurable GDP Contribution
Gaming’s economic footprint is now formally tracked as a discrete GDP contributor in the United States. The Entertainment Software Association’s 2026 Economic Impact Report put the U.S. video game industry’s contribution to GDP at $65.5 billion for 2025, with total economic impact — including indirect and induced effects — reaching $95.8 billion, according to SQ Magazine’s summary of ESA data. U.S. weekly players reached 212.3 million, up 3% year-on-year, with the average American player now 37 years old — decisively undercutting the persistent stereotype that gaming is a youth-only pastime.
Emerging Markets: Where the Growth Actually Is
While mature markets like the U.S. and Europe have been largely flat, emerging markets have driven the sharpest growth in mobile game consumer spending. Turkey grew mobile game spending 28% year-on-year, Mexico grew 21%, and India grew 17% in 2024, according to SensorTower data cited by Udonis’ gaming industry report. By contrast, Japan’s mobile gaming revenue actually fell roughly 7% amid domestic economic headwinds during the same period — a reminder that even within a structurally growing global category, individual national markets remain exposed to local macroeconomic conditions.
The Middle East’s Sovereign-Fund Bet on Gaming
Perhaps the clearest sign that gaming has become genuine macroeconomic infrastructure — rather than just consumer entertainment — is the scale of Gulf state investment in the sector. Saudi Arabia has pledged $38 billion toward gaming and esports development, explicitly targeting a $13.3 billion contribution to its own GDP and 39,000 new jobs by 2030, according to Mordor Intelligence’s 2026 regional analysis. Riyadh’s Esports World Cup functions as the public-facing showcase of that sovereign-fund ambition, while the UAE has separately built out incentive programs to attract regional game publishing operations. The Middle East and North Africa region is now growing at a 9.16% CAGR, nearly matching the global average — a striking figure for a region with no prior gaming-industry legacy infrastructure to build on.
The Creator Economy Layer
Gaming’s economic footprint extends beyond direct game sales into an increasingly monetized creator and streaming layer. Total live-streaming hours watched grew approximately 12% in 2024 to 32.5 billion hours, according to Stream Hatchet data cited by Udonis, reversing a slight 2022 dip. Major publishers now build content-creator outreach into launch strategy as standard practice, and esports co-streaming arrangements — where popular streamers broadcast alongside official tournament coverage — have become a deliberate audience-expansion tool for titles like League of Legends and Valorant.
Layoffs Amid Growth: The Industry’s Own Contradiction
Despite the headline growth figures, the games industry has simultaneously undergone significant workforce contraction. Over 10,000 game developer jobs were cut in 2023 alone amid post-pandemic economic tightening and project cancellations, according to Udonis — a pattern that has pushed surviving studios toward cross-platform-first development from day one, using engines that deploy to PC, console, and mobile simultaneously with minimal additional engineering cost, maximizing revenue reach per unit of development spend.
Final Verdict
Gaming’s 2026 economic story is less about any single blockbuster launch and more about scale of ordinary, recurring consumer spending compounding across nearly 4 billion people globally. Whether measured conservatively at roughly $205 billion or more expansively above $500 billion depending on methodology, the industry has crossed a threshold where national governments — not just corporate boardrooms — now treat it as deliberate economic infrastructure, exemplified by Saudi Arabia’s $38 billion sovereign bet and the U.S. government’s own formal GDP-contribution tracking through the ESA. For investors and policymakers alike, the more useful lens going forward is not “is gaming growing” — that question is settled — but which regional and platform segments (emerging-market mobile spend, Gulf sovereign-backed esports infrastructure, and the creator-economy layer built on top of both) capture the next leg of that growth.
Discover more from The Economy
Subscribe to get the latest posts sent to your email.
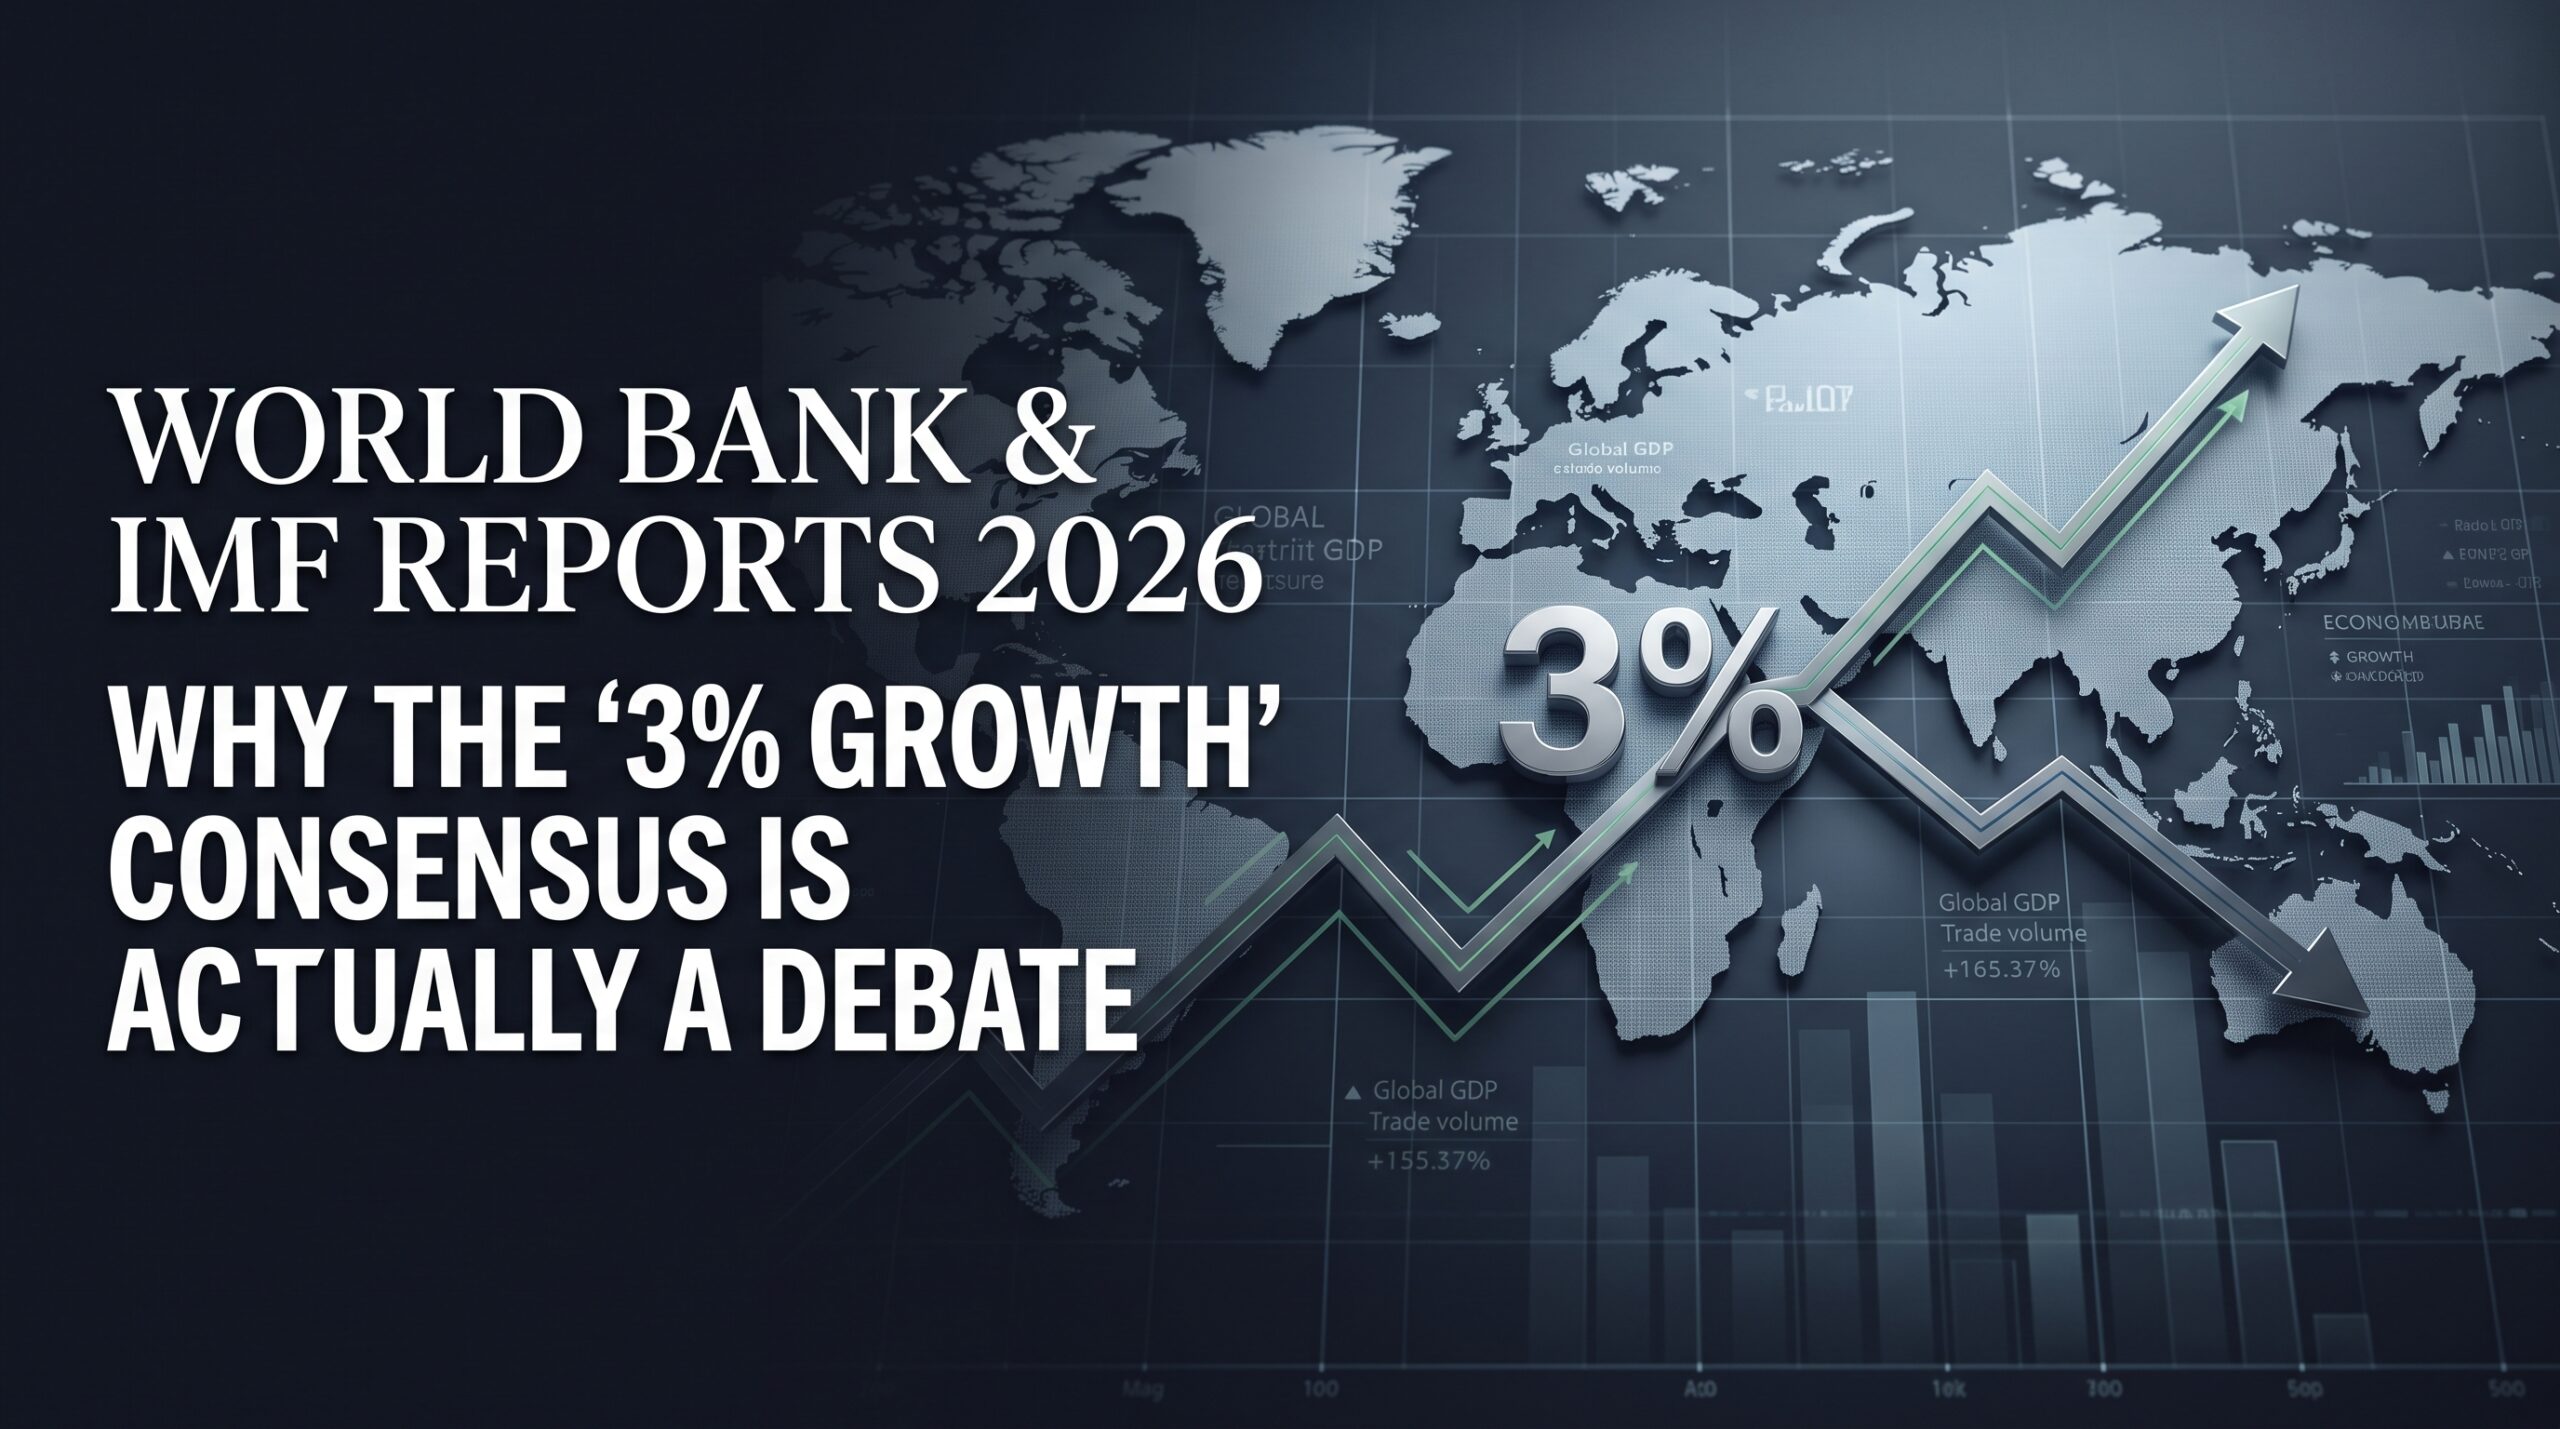
Two of the world’s most authoritative economic institutions have published starkly different verdicts on the global economy in 2026 — and the gap between them tells you more about the state of the world than either number alone. The IMF’s most recent projection puts global growth at 3.0% for 2026. The World Bank, using a different methodology and a more pessimistic read on the Middle East war’s fallout, puts the same year at 2.5% — the weakest rate since the COVID-19 pandemic. Understanding why these two numbers diverge is essential for anyone allocating capital across the world’s largest economies in the second half of 2026.
The IMF’s Case: Resilience Interrupted, Not Broken
The IMF entered 2026 with genuine optimism. Its January 2026 World Economic Outlook Update projected 3.3% global growth for the year — a small upward revision from October 2025 — crediting technology investment, fiscal and monetary support, and private-sector adaptability for offsetting ongoing trade-policy disruption.
The outbreak of war in the Middle East on February 28 forced a rapid downward revision. The April 2026 World Economic Outlook, titled pointedly “Global Economy in the Shadow of War,” cut the 2026 forecast to 3.1%, warning that a longer or broader conflict, a reassessment of AI-driven productivity expectations, or renewed trade tensions could weaken growth significantly further. By the July 2026 update, the figure had settled at 3.0% for 2026, rising to 3.4% in 2027 — a forecast the IMF frames as “broadly unchanged cumulatively” from April, arguing that AI-driven demand lifting technology-integrated economies is offsetting the war’s drag on energy importers.
IMF global growth revisions through 2026:
| Report Date | 2026 Projection | 2027 Projection | Key Framing |
|---|---|---|---|
| January 2026 | 3.3% | 3.2% | “Steady amid Divergent Forces” |
| April 2026 | 3.1% | 3.2% | “Shadow of War” |
| July 2026 | 3.0% | 3.4% | “Crosscurrents of War and Technology” |
The World Bank’s Case: The Weakest Growth Since COVID
The World Bank’s Global Economic Prospects report tells a more sobering story. Its June 2026 edition cut global growth to 2.5% for 2026, down from 2.9% in 2025 — explicitly the lowest rate since the onset of the COVID-19 pandemic. Forecasts for two-thirds of the world’s economies were downgraded relative to the World Bank’s own January 2026 report, which had initially projected 2.6% growth for the year.
World Bank Group Chief Economist Indermit Gill did not mince words in the report’s foreword, warning per the World Bank’s own press release that the 2020s remain on track to be the weakest decade for global growth since the 1960s, and that “virtually half of all developing economies have failed since 2019 to advance on the most rudimentary promise of development: narrowing the income gap with the world’s most prosperous economies.”
World Bank global growth revisions:
| Report Date | 2026 Projection | Context |
|---|---|---|
| January 2026 | 2.6% | Up from June 2025 forecast, driven by U.S. strength |
| June 2026 | 2.5% | Lowest since COVID-19; Middle East war impact |
| 2027 (June forecast) | 2.8% | Still 0.4pp below 2010s average |
Why the Numbers Don’t Match: Methodology, Not Disagreement on Facts
The roughly half-a-percentage-point gap between the IMF’s 3.0% and the World Bank’s 2.5% is not really a disagreement about the war’s severity — both institutions cite the same core shock. It reflects different weighting of technology-driven offsetting growth versus energy-importer drag, and different treatment of emerging-market vulnerability. The World Bank’s framing emphasizes that growth in low-income countries (LICs) is expected to reach 5.4% in 2026, 0.3 percentage points lower than previous forecasts specifically because of the conflict, with real per-capita GDP growth across LICs averaging only about 2.7% through 2026–28 — insufficient, in the Bank’s own assessment, to meaningfully reduce poverty.
Breaking Down the Big Economies
Both institutions converge more closely at the country level than at the global aggregate, which is instructive for investors trying to translate the headline debate into portfolio decisions.
2026 growth projections by major economy/bloc:
| Economy/Bloc | Projection | Source |
|---|---|---|
| United States | 2.2%–2.4% | World Bank (2.2%) / IMF (2.4%) |
| Advanced economies (aggregate) | 1.7%–1.8% | IMF |
| GCC states | 4.4% | World Bank |
| MENAP region (incl. Pakistan) | 3.6% | World Bank |
| Low-income countries | 5.4% | World Bank / IMF |
| Global (IMF) | 3.0% | IMF, July 2026 |
| Global (World Bank) | 2.5% | World Bank, June 2026 |
The United States is the one major economy where both institutions agree growth is holding up better than expected, with the World Bank crediting the U.S. for roughly two-thirds of its own upward revision to global growth back in January — before the war reversed some of that optimism. Gulf Cooperation Council economies are the other standout, benefiting directly from elevated oil prices even as the same conflict drags down oil-importing peers.
Inflation: The Shared Warning
Both reports converge on inflation risk. The IMF’s April 2026 outlook explicitly modeled inflation rising to 4.4% globally under its reference war scenario, a sharp reversal from the disinflation trend of 2024–25. The World Bank similarly flagged that headline inflation expectations have risen broadly across emerging markets and developing economies, with local-currency bond yields and external spreads remaining elevated in commodity-importing nations specifically because of the conflict’s pass-through to energy and food costs.
What This Means for Asset Allocation
The practical takeaway from the IMF-World Bank gap is that “global growth” is now a genuinely bimodal concept in 2026: technology-exposed and energy-exporting economies are outperforming, while energy-importing emerging markets and low-income countries are absorbing a disproportionate share of the war-driven slowdown. A portfolio built around a single “global growth” assumption risks missing this bifurcation entirely — the more useful lens for 2026 is regional and sectoral, not aggregate.
Final Verdict
The IMF’s 3.0% and the World Bank’s 2.5% are not competing predictions so much as two honest readings of the same uncertain war-affected environment, filtered through different modeling emphasis. What both institutions agree on matters more than where they diverge: growth in 2026 is meaningfully weaker than it would have been absent the Middle East conflict, inflation risk has returned after two years of disinflation, and the burden of the shock is falling disproportionately on energy-importing emerging markets rather than being evenly distributed. Investors and policymakers should treat both the 3.0% and 2.5% figures as bookends of a realistic range rather than seeking a single “correct” number — and should watch the IMF’s next scheduled update for whether the numbers converge toward the optimistic or pessimistic end as the war’s duration becomes clearer.
Discover more from The Economy
Subscribe to get the latest posts sent to your email.
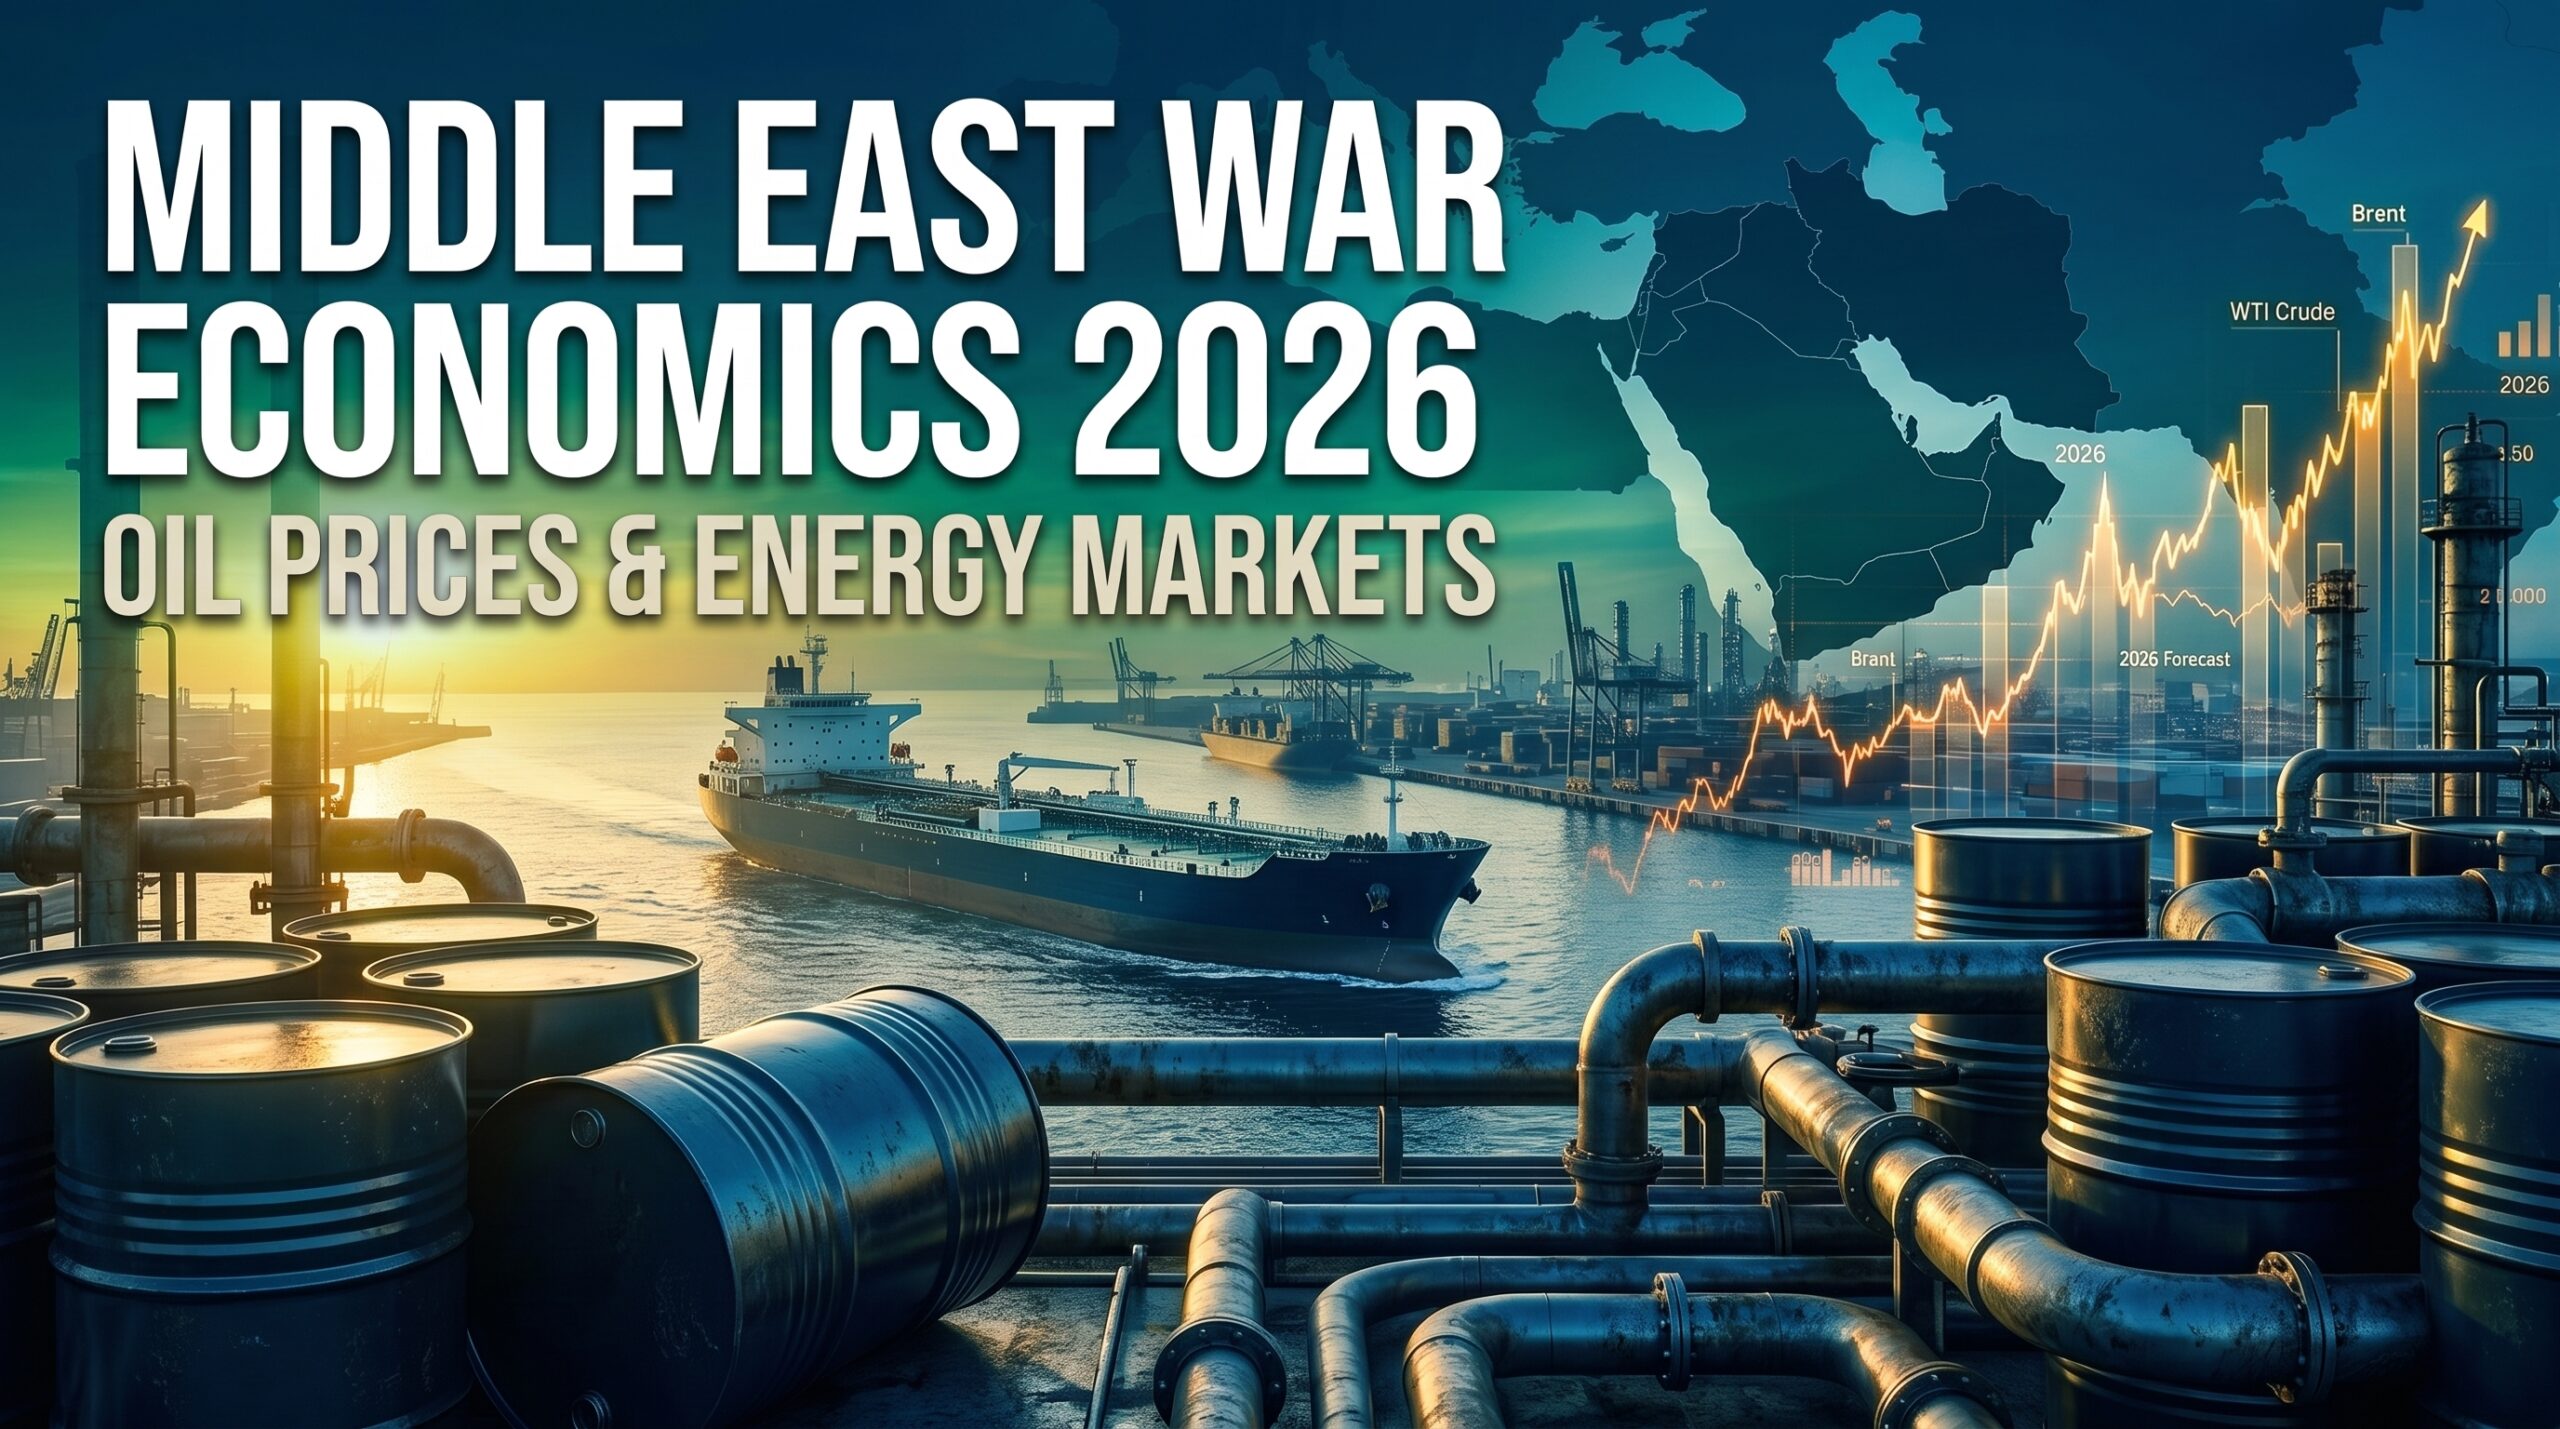
Six months into the war between the United States, Israel, and Iran, one pattern has become unmistakable to energy traders: every reported ceasefire has been followed, sooner or later, by a fresh escalation. What started as a limited conflict on February 28, 2026, has evolved into the most disruptive geopolitical shock to global oil supply since Russia’s invasion of Ukraine — and as of September 2026, it is still actively reshaping energy markets, shipping routes, and inflation forecasts worldwide.
The Ceasefire-and-Relapse Cycle
The conflict has produced at least three distinct ceasefire announcements since February, and none has held for more than a few weeks. In April 2026, a US-Iran arrangement briefly reopened the Strait of Hormuz and sent oil plunging below $100 a barrel, as reported by Euronews. Gold, which had surged as a safe haven, still traded near $4,750 an ounce that same week as investors openly doubted the truce would last, according to Trading Economics — key disputes remained unresolved and the Strait stayed effectively closed even after the announcement.
That skepticism proved warranted. By September 2026, oil had round-tripped decisively higher. Brent crude surpassed $100 a barrel for the first time in nearly six weeks after fresh attacks on oil facilities and tankers, settling at $97.89 before jumping 2.4% to $100.29, with WTI gaining to $94.77, according to reporting carried by the Washington Times. The proximate trigger: the U.S. military struck five Iranian tankers in response to attempted missile attacks on a Navy warship, while Iranian-backed Houthi forces ignited fires at Saudi Arabian oil facilities.
Oil price trajectory during the conflict:
| Date | Brent Crude | Context |
|---|---|---|
| Mar 21, 2026 | ~$106.77 | Fifth straight weekly gain amid escalation |
| Mar 20, 2026 | Forecast warning of $180+ | Saudi Aramco officials warned WSJ of extreme scenario |
| Apr 8, 2026 | Below $100 | Ceasefire announcement, Strait reopening pledge |
| Sept 7, 2026 | $97.31 | Six-week high; Iran vows to strike energy infrastructure |
| Sept 9, 2026 | $100.29 | Attacks on tankers and Saudi refineries |
| Sept 11, 2026 | ~$100, +9% week | Diplomatic talks announced on Hormuz shipping |
Why the Strait of Hormuz Is the Real Story
The Strait of Hormuz is the fulcrum of this entire crisis. Roughly 20% of the world’s oil supply passes through this chokepoint, including about half of Asia’s oil imports and a quarter of its LNG imports, according to TD Economics. Since the war began, fighting has halted most shipping through the strait, and — critically — markets have stopped believing repeated U.S. government proclamations that reopening is imminent. As one energy analyst told Marketplace, “The Strait of Hormuz won’t be what it was before. Now, we understand that Iran can and will block it.”
The physical impact on trade flows has been severe. Oil shipments out of the Middle East are running roughly 65% below year-ago levels, and the cost of shipping crude to Asia on the largest tankers has hit a record high, per the same Marketplace reporting. The United Arab Emirates has responded by actively building alternative export routes and trade corridors to avoid having its energy exports “held hostage” by the conflict, a senior UAE presidential adviser confirmed to Reuters in early September.
Demand Destruction Is Now the Dominant Theme
While supply disruption drove the initial price spike, the market’s focus by September 2026 has shifted decisively toward demand destruction. The International Energy Agency sharply lowered its 2026 global oil demand outlook, forecasting a contraction of 2.5 million barrels per day — the largest annual decline since the COVID-19 pandemic — as higher prices and tighter supply weigh on consumption, according to Trading Economics. OPEC has cut its own demand-growth forecast for a fifth consecutive month. Both organizations now agree that sustained triple-digit oil is actively destroying the demand it was created by.
OPEC+ itself has opted for caution rather than aggressive supply response, keeping its October output policy unchanged at its early-September meeting, pending agreement on new quotas before any further steps, Reuters reported.
The Inflation and Consumer Pass-Through
The war’s inflationary impact has already shown up in hard data. U.S. gasoline prices surged in March 2026 to an EIA-reported average of $3.638 per gallon, the highest since September 2023, with AAA data showing the national average briefly topping $4.02 per gallon — a monthly jump described by Trading Economics as exceeding even the spikes following Hurricane Katrina and Russia’s 2022 invasion of Ukraine. Euro-area inflation jumped to 2.5% in the same window, well above the European Central Bank’s 2% target, driven almost entirely by the energy component.
Who is most exposed:
| Category | Exposure | Why |
|---|---|---|
| Asian oil importers (Japan, India, Pakistan, China) | Very high | ~50% of Asia’s oil, 25% of LNG via Hormuz |
| European energy consumers | High | Already strained post-Russia diversification |
| Gulf oil exporters (Saudi, UAE, Qatar) | Mixed | Higher prices offset by direct attack risk on infrastructure |
| U.S. consumers | Moderate-high | Domestic production buffers some but not all of the shock |
| Global shipping/logistics | High | Record tanker rates, rerouting costs |
Diplomatic Off-Ramps Being Tested
The most significant near-term catalyst for de-escalation is the diplomatic track around Strait of Hormuz shipping management. Top diplomats from the six-member Gulf Cooperation Council were scheduled to meet their Iranian counterpart to negotiate a possible temporary arrangement for managing transit through the strait, according to Trading Economics. Iranian state media separately indicated Tehran would meet Gulf states in Oman for related talks. Markets have priced in modest optimism around these talks — crude paused its rally and settled near $100 on the news — but given the track record of failed ceasefires since February, traders are treating any de-escalation as tactical rather than durable until physical shipping data confirms a sustained reopening.
Final Verdict
The “ceasefire economics” of the 2026 Middle East war have proven to be a recurring, not a resolving, phenomenon: each truce has produced a short-lived relief rally in oil and a corresponding dip in inflation expectations, followed by renewed escalation that erases the gains. As of September 2026, Brent and WTI sit near six-week highs above $90–100, the Strait of Hormuz remains functionally impaired, and both the IEA and OPEC now forecast the sharpest demand contraction since the pandemic. For investors and policymakers, the actionable conclusion is that oil-price volatility itself — not a stable higher or lower price level — is the defining condition of this market, and near-term direction hinges almost entirely on whether the current Gulf-Iran diplomatic track produces a verifiable, physically confirmed reopening of shipping lanes rather than another rhetorical ceasefire.
Discover more from The Economy
Subscribe to get the latest posts sent to your email.

Stock Market Crash 2026? How the Trump $5,000 Dividend Impacts Global Inflation

Tax-to-GDP Ratio Explained: Global Benchmarks, Fiscal Sovereignty & 2026 Insights

Trade Deficit & Terms of Trade Explained: Global Impact, Real-World Examples, and 2026 Insights

Supply vs Demand Shocks Explained: Market Equilibrium, Inflation Risks & Policy Responses in 2026

Microeconomics vs. Macroeconomics Explained: Key Differences, Interdependence & Global Impact

Devaluation vs Depreciation: Clear Differences, Causes, and Economic Impact

Purchasing Power Parity (PPP) Explained: Global Rankings, Living Standards & Why Nominal Exchange Rates Mislead in 2026

Remittances 2026: Global Trends, Household Resilience & Economic Lifeline for Developing Nations

Stagflation Explained: Causes, Global Impact & 2026 Economic Outlook

Understanding Foreign Exchange Reserves: Key Purposes and Global Impact

The Business of Gaming and Tech: How Global Economies Are Driven by Digital Consumerism

Crypto Daily Outlook: Bitcoin, Altcoins, and the Future of Decentralized Finance

Anthony Scaramucci’s Crypto Prediction: Why MicroStrategy’s Move Is Bitcoin’s “iPhone Moment”

Best Dividend Stocks 2026: European & Asian Blue Chips

State Farm’s $5B Dividend 2026: Who Qualifies & Payout Dates

US-China Relations in Q3 2026: Trade Tariffs and Supply Chain Risks

Gold’s Wild 2026: From a Record $5,600 Peak to a 24% Crash and Back Toward $4,500

Oil Surges as Strait of Hormuz Traffic Collapses Again

The Rocket That Won’t Quit: Inside SpaceX’s Falcon 9 Launch Machine

Bank of England Set to Hold Rates Through Year-End, Reuters Poll Shows

SpaceX Starship Flight 14: First Orbital Attempt & Starlink V3 Launch Explained

The 2026 Crypto Regulatory Shift: What It Means for Institutional Investors

Top 30 Stocks for Investment in PSX for Massive ROI in 2026

AI Chip Stocks 2026: The Best Semiconductor Investments Beyond Marvell

Retail Earnings Week: What Home Depot, Target & Walmart Reveal

AI-Powered Training: The Next Multi-Billion Dollar Ecosystem in Fitness

Russia’s Black Sea Oil Exports Fall for a Fifth Straight Week

Tween Back-to-School Trends 2026: What’s Driving the $85B Season
-

 Markets & Finance8 months ago
Top 15 Stocks for Investment in 2026 in PSX: Your Complete Guide to Pakistan’s Best Investment Opportunities
-

 Analysis7 months ago
Johor’s Investment Boom: The Hidden Costs Behind Malaysia’s Most Ambitious Economic Surge
-

 Analysis7 months ago
Top 10 Stocks for Investment in PSX for Quick Returns in 2026
-

 Analysis7 months ago
Brazil’s Rare Earth Race: US, EU, and China Compete for Critical Minerals as Tensions Rise
-

 Banks8 months ago
Best Investments in Pakistan 2026: Top 10 Low-Price Shares and Long-Term Picks for the PSX
-

 Investment8 months ago
Top 10 Mutual Fund Managers in Pakistan for Investment in 2026: A Comprehensive Guide for Optimal Returns
-

 Global Economy9 months ago
15 Most Lucrative Sectors for Investment in Pakistan: A 2025 Data-Driven Analysis
-

 Global Economy9 months ago
Pakistan’s Export Goldmine: 10 Game-Changing Markets Where Pakistani Businesses Are Winning Big in 2025