
Global Economy
The $250 Billion Gamble: How Trump’s Tariff Experiment Is Reshaping the American Economy


Inside the most dramatic restructuring of US trade policy since the Great Depression—and what it means for your wallet, your job, and the future of global commerce
When Wall Street erased over $2 trillion in market capitalization during the first week of April 2025, traders weren’t reacting to corporate earnings, interest rate moves, or geopolitical crises. They were responding to something far more fundamental: the largest restructuring of American trade policy in nearly a century. President Donald Trump’s “Liberation Day” announcement on April 2nd introduced tariffs so sweeping that the average effective tariff rate climbed from 2.5% to 17%—levels unseen since 1935, when the scars of the Smoot-Hawley Tariff Act still stung the global economy.
Nearly nine months into this unprecedented experiment in economic nationalism, the results are in—and they’re more complex than either tariff enthusiasts or free trade purists predicted. With $250 billion in tariff revenue collected through December 2025 and fundamental shifts underway in global supply chains, corporate strategy, and household budgets, we’re witnessing an economic transformation whose consequences will reverberate for years.
The stakes couldn’t be higher. For middle-class families facing an estimated $2,400 annual tariff burden, for manufacturers recalculating decades-old supply chain decisions, and for investors navigating the most volatile market environment since 2020, understanding this seismic shift isn’t optional—it’s essential.
The Tariff Landscape: A Comprehensive Chronicle
The Trump administration’s tariff architecture didn’t emerge overnight. It evolved through a series of escalating actions that began cautiously in February 2025 and exploded into a full-scale trade realignment by spring.
On February 1st, Trump fired the opening salvo: a 25% tariff on Canadian and Mexican goods and 10% on Chinese imports, citing concerns over fentanyl trafficking and illegal immigration. After intense backlash and market jitters, he granted a 30-day reprieve for Canada and Mexico while the 10% China tariff took effect on February 4th. China immediately retaliated with its own duties on American products, setting the stage for months of tit-for-tat escalation.
By March 4th, the gloves came off. The full 25% tariff on Canada and Mexico took effect, though automotive products received a one-month carve-out. Canada responded by slapping 25% duties on roughly $30 billion worth of US goods, including agricultural products that would devastate American farmers. The same day, Trump doubled down on China, raising the tariff from 10% to 20%, then to 34% by early April.
How Trump’s Tariffs Affect Your Wallet in 2025
Trump’s tariff regime—the most aggressive in 90 years—is costing the average American household $2,400 annually through higher prices on everyday goods. With $250 billion collected in tariff revenue but GDP projected to decline 0.4-6%, the economic experiment has created more costs than benefits for middle-class families.
💰 Quick Impact Summary:
Your Household: $2,400/year additional cost (3% of median income)
Tariff Rate: 16.8% average (up from 2.5% in 2024) — highest since 1935
🛒 Price Increases You’re Paying:
- Bananas: +4.9% (April-August)
- Coffee: +15% annualized
- Cars: +11.4% projected
- Jewelry/Watches: +5.5% (August)
- Furniture & Appliances: +5.5%
📈 Economic Ripple Effects:
- Inflation boost: +0.5 to 1.5 percentage points
- Trade coverage: 71% of all US imports
- Job losses: 4,100+ in freight/logistics
- Market volatility: $2 trillion erased in April crash
- Manufacturing jobs: Modest gains offset by supply chain losses
💸 The Real Long-Term Cost:
Economists at Penn Wharton Budget Model project middle-income households will lose $22,000 in lifetime income—roughly equivalent to two years of retirement savings for typical American families.
But the real earthquake came on April 2nd—”Liberation Day,” as Trump christened it. Invoking the rarely-used International Emergency Economic Powers Act, he declared America’s trade deficit a national emergency and imposed a baseline 10% tariff on virtually all imports. Country-specific rates soared higher: 34% on China, 20% on the European Union, 27% on India, 24% on Japan, 26% on South Korea, and a staggering 46% on Vietnam.
The announcement triggered what would become known as the 2025 stock market crash. The S&P 500 plummeted more than 10% in two days, wiping out trillions in household wealth. Bond yields spiked as investors questioned US fiscal stability. Within a week, Trump blinked—announcing a 90-day pause on the country-specific tariffs while keeping the 10% baseline and dramatically increasing pressure on China to 145% (though this was later clarified and adjusted).
The subsequent months brought a dizzying array of adjustments. Steel and aluminum tariffs hit 50% under Section 232 authority. Copper faced a proposed 50% levy. Switzerland’s watches saw rates climb to 39%. Brazil, initially subject to moderate duties, found itself facing 50% tariffs by August after diplomatic tensions flared. By November, as legal challenges wound through federal courts and trade negotiations produced tentative deals with select partners, the average effective tariff rate settled at approximately 16.8%—still the highest in over eight decades.
According to data from the Congressional Research Service and Atlantic Council’s Trump Tariff Tracker, these measures now cover roughly $2.3 trillion in goods, representing 71% of all US imports. US Customs and Border Protection reports collecting over $200 billion specifically from Trump’s new tariffs between January 20 and December 15, 2025—a figure that doesn’t include legacy tariffs from his first term.
Economic Impact: Where Theory Meets Reality
The macroeconomic consequences of this tariff regime have defied simple predictions. While Trump administration officials promised a manufacturing renaissance and fiscal windfall, and critics warned of immediate economic collapse, the reality has been more nuanced—and more troubling in specific sectors.
GDP and Growth Trajectories
Economic modeling from the Penn Wharton Budget Model projects the tariffs will reduce long-run GDP by approximately 6%, with middle-income households facing a $22,000 lifetime income loss. These losses, according to Wharton researchers, are roughly twice as damaging as a revenue-equivalent corporate tax increase from 21% to 36%—itself considered highly distortionary.
The Peterson Institute for International Economics found that under current tariff levels, US real GDP would decline by 0.4% relative to baseline by 2026, with permanent annual losses thereafter due to the persistent efficiency costs. JP Morgan Global Research slashed its 2025 GDP growth forecast from 2.1% to 1.4% by Q4, citing tariff uncertainty and supply chain disruption.
Yet paradoxically, actual GDP growth has shown remarkable resilience in certain quarters. The third quarter of 2025 saw robust 4.3% annualized growth, driven primarily by consumer spending on healthcare and services. This resilience masks significant sectoral pain and may reflect temporary stockpiling effects rather than sustainable momentum.
The Inflation Conundrum
Tariffs function as consumption taxes, raising prices on imported goods and, through reduced competition, on domestic substitutes. The inflationary impact has materialized gradually but persistently across multiple categories.
Tax Foundation analysis indicates the tariffs amount to an average tax increase of $1,100 per household in 2025, rising to $1,400 in 2026. JP Morgan economists estimate Personal Consumption Expenditures (PCE) prices increased by 1.0-1.5 percentage points specifically due to tariffs, with effects concentrated in the middle quarters of 2025.
Federal Reserve data from St. Louis shows tariffs explaining roughly 0.5 percentage points of headline PCE inflation between June and August. While this may seem modest, it represents a meaningful share of total inflation running at 2.7-3.0%—well above the Fed’s 2% target and making monetary policy considerably more difficult.
Specific product categories tell a starker story. According to Harvard Business School’s Pricing Lab, prices for imported goods rose 4.0% between March and September 2025, double the 2.0% increase for domestic goods. Bananas—virtually all imported from Central and South America—saw prices climb 4.9% from April through August, an annualized pace of 15%. Coffee prices surged as tariffs on major suppliers like Vietnam (raised sharply), Indonesia, and Brazil (hit with 50% duties in August) disrupted a market where the US grows less than 1% of consumption.
Jewelry and watches experienced a 5.5% jump in August alone, far above the historical 0.8% monthly average, driven by the 39% tariff on Swiss imports. Toys, furniture, appliances, and apparel have all shown above-trend inflation. Yale Budget Lab estimates the effective tariff rate peaked at 28% in April—the highest since 1901—before moderating to 17.4% by year-end as trade patterns adjusted.
Employment and Manufacturing: The Unfulfilled Promise
One of Trump’s central justifications for tariffs was restoring American manufacturing jobs. The data suggests a more complicated picture, with modest gains in protected sectors offset by significant losses in trade-exposed industries.
Peterson Institute modeling indicates employment measured as hours worked would decline in sectors most exposed to trade, with the biggest drops in durable goods manufacturing, mining, and agriculture. The promised manufacturing boom has largely failed to materialize; instead, jobs growth slowed significantly in 2025 compared to 2024.
The freight and logistics sector—a bellwether for manufacturing activity—has hemorrhaged over 4,100 jobs in recent months. Major truck manufacturers have announced layoffs citing weak demand, declining orders, and uncertainty over tariffs and regulations. Agricultural exports, particularly soybeans and pork, have plummeted due to retaliatory tariffs, devastating farming communities across the Midwest.
The Tax Foundation projects the IEEPA tariffs alone will reduce US employment by significant margins, though exact figures vary by scenario. What’s clear is that tariff protection for steel and aluminum workers hasn’t translated into broader manufacturing employment gains, as downstream industries that use these materials as inputs—automotive, construction, machinery—face higher costs that reduce their competitiveness.
Financial Markets: Volatility as the New Normal
Perhaps no aspect of the tariff regime has been more visible than its impact on financial markets. The April 2025 stock market crash ranks among the most severe declines since the COVID-19 pandemic, with the S&P 500 experiencing its largest daily and weekly swings of the year during tariff announcements.
Research published in finance journals shows tariffs and trade policy uncertainty collectively explain up to 7.9%, 8.2%, and 9.9% of forecast error variance for the S&P 500, Nasdaq, and Dow Jones respectively. BlackRock analysis found that low-volatility strategies significantly outperformed during the April drawdown, with minimum volatility ETFs falling only half as much as the broader market.
The bond market has experienced its own turmoil. As stocks initially declined in April, investors fled to Treasury bonds, pushing yields down. Trump touted this as evidence his policies were lowering borrowing costs. But the trend reversed sharply as bond markets began experiencing widespread selling—an example of bond vigilantism reflecting waning confidence in US fiscal policy. The 10-year Treasury yield, which helps set mortgage and credit card rates, spiked before easing but remains elevated relative to early 2025 levels.
Council on Foreign Relations analysis highlights how tariffs create hidden costs for the Treasury market through three channels: increased bond supply (as deficits persist despite tariff revenue), reduced foreign demand (as trade relationships deteriorate), and adverse effects on growth and inflation that push yields higher.
Despite the tumult, markets have shown resilience. Through December 11th, the S&P 500 returned over 18% for the year, the third consecutive year of double-digit gains. This recovery reflects the economy’s underlying strength, Federal Reserve rate cuts, and investor adaptation to policy uncertainty. Yet each major tariff announcement continues to trigger volatility, keeping strategists and investors in a constant state of anticipation.
Winners and Losers: The Uneven Distribution of Costs
Trade policy always creates winners and losers. Understanding who benefits and who pays is essential for evaluating the tariff regime’s ultimate success or failure.
The Winners: Narrow Gains
Certain domestic manufacturers in heavily protected sectors have benefited. American steel and aluminum producers have seen improved pricing power and reduced foreign competition, though this comes at the expense of downstream users. Some firms previously considering offshoring have announced plans to expand US production, though these remain modest compared to overall manufacturing investment.
The federal Treasury has been an undeniable winner, at least on paper. The $250 billion in tariff collections represents a significant revenue stream, constituting 7.5% of total federal revenue by December 2025—far more than typical customs duties. Trump has suggested these revenues could eventually replace income taxes, though economists universally dismiss this as mathematically impossible given that tariff revenues would need to be 4-5 times larger to offset income tax collections.
Countries benefiting from trade diversion—particularly Vietnam, Mexico, Taiwan, and India—have seen export growth as companies shift supply chains away from China. Mexico’s imports to the US actually increased year-to-date despite tariffs, as USMCA provisions provide some protection and proximity offers advantages.
The Losers: Widespread Pain
The costs are far more diffuse and consequential. Middle-class consumers face the most direct impact through higher prices on everyday goods. Yale Budget Lab’s $2,400 annual household cost estimate represents roughly 3% of median household income—a meaningful reduction in purchasing power that hits hardest at families already struggling with inflation.
Small businesses that rely on imports have been particularly vulnerable. Reports indicate the typical small importer faced more than $90,000 in additional tariff costs from April through July 2025 alone, with revenue losses averaging 13%. Many lack the scale or market power to negotiate with suppliers or pass costs to customers, forcing them to absorb the hit to margins or scale back operations.
Export-dependent industries have suffered enormously from retaliatory measures. American farmers have watched soybean exports to China collapse and pork shipments face prohibitive duties. Agricultural export losses have compounded existing challenges in rural America, prompting emergency aid packages that reduce the net fiscal benefit of tariff revenues.
The automotive sector exemplifies the complex pain. US automakers—Ford, General Motors, and Stellantis—lobbied aggressively against tariffs, warning they would inflict more harm on American companies than foreign competitors due to deeply integrated North American supply chains. JP Morgan Research estimated light vehicle prices could rise by as much as 11.4% if automakers successfully pass costs to consumers, a development that would devastate sales volumes.
Geopolitically, the tariff regime has strained alliances. European Union members have announced countermeasures and struggled to maintain unity in responding to US actions. The USMCA, barely five years old, faces an uncertain future with its 2026 review approaching. Trust in the rules-based trading system—a pillar of American economic influence—has eroded as the US demonstrates willingness to unilaterally rewrite trade rules.
The Uncertainty Tax: Policy Volatility as Economic Headwind
Beyond the direct costs of tariffs lies a more insidious problem: the economic damage caused by sheer unpredictability. Businesses make capital allocation decisions based on expected future conditions. When those conditions shift wildly—with tariffs announced, paused, raised, lowered, and restructured with dizzying frequency—investment freezes.
Capital expenditure data shows businesses delaying major decisions throughout 2025. CFO confidence surveys have plummeted, with executives citing policy uncertainty as a primary concern. The Peterson Institute’s modeling explicitly accounts for this uncertainty premium, finding it amplifies economic losses beyond the tariffs themselves.
Historical parallels are ominous. The Smoot-Hawley Tariff Act of 1930 contributed to the Great Depression not solely through its direct effects but through the uncertainty and retaliation it triggered, causing trade to collapse by 66% between 1929 and 1934. While current circumstances differ dramatically—the US economy is far more diversified and resilient—the mechanism of uncertainty-driven contraction remains relevant.
Federal Reserve testimony has highlighted how tariff unpredictability hampers monetary policy. The Fed must balance supporting growth against controlling inflation, but when tariffs might suddenly increase prices by an unknown amount, calibrating interest rate policy becomes extraordinarily difficult. Chair Jerome Powell has publicly noted that markets are “struggling with a lot of uncertainty and that means volatility.”
This uncertainty has real costs. Research from the Federal Reserve Bank of Atlanta found businesses—both those directly exposed to tariffs and those who are not—sharply increased their price expectations by mid-May 2025, jumping from 2.5% anticipated price growth to 3.5%. The anticipation of future cost increases can be as damaging as the increases themselves, as businesses price in risk premiums and consumers alter spending patterns.
What Comes Next: Three Plausible Scenarios
As we enter 2026, three distinct scenarios capture the range of possible outcomes for US trade policy and the economy.
Scenario 1: Escalation and Entrenchment
In this darker timeline, Trump pursues even more aggressive tariffs as trade deficits fail to narrow and manufacturing gains disappoint. China refuses to make substantive concessions, leading to a permanent decoupling of the world’s two largest economies. European patience exhausts, triggering comprehensive countermeasures. The effective tariff rate climbs above 20%, and retaliatory measures multiply.
This scenario risks stagflation—the toxic combination of weak growth and elevated inflation that paralyzed policymaking in the 1970s. Consumer confidence craters as prices rise and employment softens. Business investment remains depressed. The dollar weakens significantly, raising import costs further but also increasing the burden of servicing dollar-denominated debt globally. Emerging markets face capital flight and currency crises.
Probability: 25%. This remains a tail risk rather than the central case, but political incentives—particularly Trump’s unwillingness to acknowledge policy failures—could push toward escalation if economic conditions deteriorate or if he perceives political benefit.
Scenario 2: Negotiated Resolution and Selective Rollback
The middle path sees Trump leverage tariffs as bargaining chips to extract concessions, then declare victory and pull back. Deals with Japan (already reached at 15% tariffs), the UK, and other partners provide templates. China agrees to modest reforms and increased purchases of American products in exchange for tariff reductions to 40-50% rather than current levels.
USMCA survives its 2026 review with adjustments. The EU and US strike a limited agreement on specific sectors. While tariffs don’t return to pre-2025 levels, they stabilize at a “new normal” of 8-10% effective rates—higher than the historical average but far below current peaks. Supply chains adapt, with some manufacturing returning to the US and Mexico while China’s share of imports permanently declines.
Inflation gradually subsides as supply chains stabilize and retaliatory measures ease. GDP growth recovers modestly. Financial markets stabilize, pricing in the new equilibrium. The economic costs are real but manageable—a permanent reduction in efficiency and living standards, but not a crisis.
Probability: 50%. This represents the most likely outcome, reflecting Trump’s past pattern of using tariffs for negotiation, market sensitivity constraining worst impulses, and the sheer economic pressure for resolution.
Scenario 3: Status Quo Drift and Adaptation
In this scenario, tariffs remain elevated but cease being the dominant political and economic story. Legal challenges wind through courts, with the Supreme Court potentially ruling on IEEPA authority in ways that complicate but don’t eliminate the tariff regime. Trump’s attention shifts to other priorities. Trade volumes adjust to the new cost structure, with supply chains reconfigured and companies accepting tariffs as a cost of doing business.
The economy muddles through with slightly slower growth—1.5-1.8% annually rather than 2.0-2.5%—and inflation settling at 2.5-3.0% rather than the Fed’s 2% target. Manufacturing sees modest gains in protected sectors but no dramatic reshoring. American households permanently adjust to somewhat higher prices and reduced purchasing power. Financial markets find a new normal of slightly elevated volatility around tariff-related news but without the extreme swings of spring 2025.
This scenario represents managed decline—not a catastrophe, but a slow erosion of US economic dynamism and living standards relative to what might have been.
Probability: 25%. This outcome requires both political paralysis (neither full escalation nor decisive resolution) and economic resilience (avoiding recession despite headwinds).
Indicators to Watch
Several key metrics will signal which scenario unfolds:
Manufacturing PMI: Purchasing Managers’ Index data will reveal whether protected industries are actually expanding or if input cost increases are overwhelming any benefits. Readings consistently below 50 indicate contraction and would suggest the tariff strategy is failing even on its own terms.
Core PCE Inflation: The Federal Reserve’s preferred inflation measure must trend back toward 2% for tariffs to be economically sustainable. If core PCE remains above 3% through mid-2026, pressure will mount for policy changes.
Trade Deficit Trends: Trump’s stated goal is narrowing the trade deficit. If the deficit widens despite tariffs—as economic theory suggests could happen due to dollar appreciation and reduced export competitiveness—the political logic of tariffs weakens.
Supply Chain Investment Data: Watch announcements of major manufacturing facility investments in the US. If these materialize in meaningful scale, it would validate reshoring claims. If they don’t, it indicates tariffs alone are insufficient to overcome other cost disadvantages.
Retaliatory Measure Evolution: Whether trading partners escalate, maintain, or reduce retaliatory tariffs will significantly impact outcomes. China’s decisions are particularly crucial given the scale of bilateral trade.
2026 Midterm Calculations: As congressional elections approach, political pressure from affected industries and states could force tariff modifications. Key Senate and House races in agricultural and manufacturing-heavy states will be telling.
The Real Cost of Economic Nationalism
Step back from the technical details and data points, and a broader truth emerges: We’re conducting an enormous economic experiment with American prosperity as the wager. The question isn’t whether tariffs impose costs—they demonstrably do. It’s whether the benefits—whatever form they take—justify those costs.
The Trump administration argues yes, pointing to national security concerns about supply chain vulnerability, the need to rebuild manufacturing capacity, and the injustice of unequal trading relationships. These aren’t trivial concerns. China’s dominant position in critical supply chains, from rare earth elements to pharmaceuticals, poses genuine risks. The hollowing out of American industrial capacity over decades has social and strategic costs beyond pure economics.
But economics cannot be wished away. Every dollar spent on more expensive domestic production rather than cheaper imports is a dollar not spent on something else—education, healthcare, innovation, or simply higher living standards. The $2,400 annual household tariff burden represents lost purchasing power that disproportionately affects those least able to afford it. The uncertainty tax on business investment means forgone productivity gains and innovation.
Perhaps most concerning is what this experiment reveals about governance and policy process. The chaotic, announcement-pause-modification-reversal cycle has undermined both legal norms (the unprecedented use of IEEPA for trade policy faces serious constitutional challenges) and international trust. Even if specific tariff rates eventually settle at reasonable levels, the demonstration that US trade policy can shift radically based on presidential whim makes the US a less reliable partner.
The promised manufacturing renaissance hasn’t materialized at scale. Jobs in protected industries haven’t offset losses in trade-exposed sectors and downstream users. The trade deficit, despite all the disruption, hasn’t narrowed meaningfully. And the Treasury revenue windfall, while real, comes nowhere close to offsetting income taxes as Trump has suggested, meaning it represents at best a partial offset to other tax cuts rather than a new fiscal foundation.
For business leaders, the lesson is stark: flexibility and geographic diversification matter more than ever. For investors, volatility isn’t a temporary phenomenon but a feature of the current policy environment. For policymakers contemplating similar approaches, the evidence suggests blunt tariff instruments create more collateral damage than their advocates acknowledge.
Conclusion: An Unfinished Story with High Stakes
We stand at a crossroads. The tariff regime implemented in 2025 represents either the beginning of a new American economic model—one that prioritizes security and self-sufficiency over efficiency and interdependence—or a costly detour that will ultimately be unwound as its costs become undeniable.
History suggests caution. Every major episode of trade protection, from Smoot-Hawley to 1970s protectionism, eventually gave way to liberalization as the costs mounted and the promised benefits failed to materialize. But history also shows that trade policy is intensely political, and once constituencies form around protection, dismantling it proves difficult.
The $250 billion collected in tariffs this year is real money. The thousands of jobs lost in agriculture, freight, and manufacturing are real losses. The $2,400 hitting household budgets is real pain. The volatility whipsawing markets is real uncertainty. All of it adds up to an economy operating below its potential, with families bearing costs that outweigh any benefits to protected industries.
As we enter 2026, the question isn’t whether tariffs will dominate economic policy discussions—they will. It’s whether evidence will matter more than ideology, whether pragmatism will overcome populism, and whether the American economy’s remarkable resilience can overcome self-imposed barriers.
The experiment continues. The data is mounting. And the stakes—for American workers, consumers, businesses, and global leadership—have never been higher.
For investors, businesses, and households, the message is clear: In an era of tariff uncertainty, adaptability isn’t optional—it’s survival. For policymakers, the evidence demands honest assessment. Are we building a more resilient economy, or simply a more expensive one?
The answer will define American prosperity for a generation.
The Author is an award-winning political economy columnist specializing in trade policy, fiscal economics, Foreign Policy ,Security and international commerce. Previously covered tariff impacts during multiple administrations for major financial publications.
Data Sources: Congressional Research Service, US Customs and Border Protection, Tax Foundation, Peterson Institute for International Economics, Penn Wharton Budget Model, JP Morgan Global Research, Yale Budget Lab, Federal Reserve Economic Data, Harvard Business School Pricing Lab, Atlantic Council, International Trade Centre
Discover more from The Economy
Subscribe to get the latest posts sent to your email.


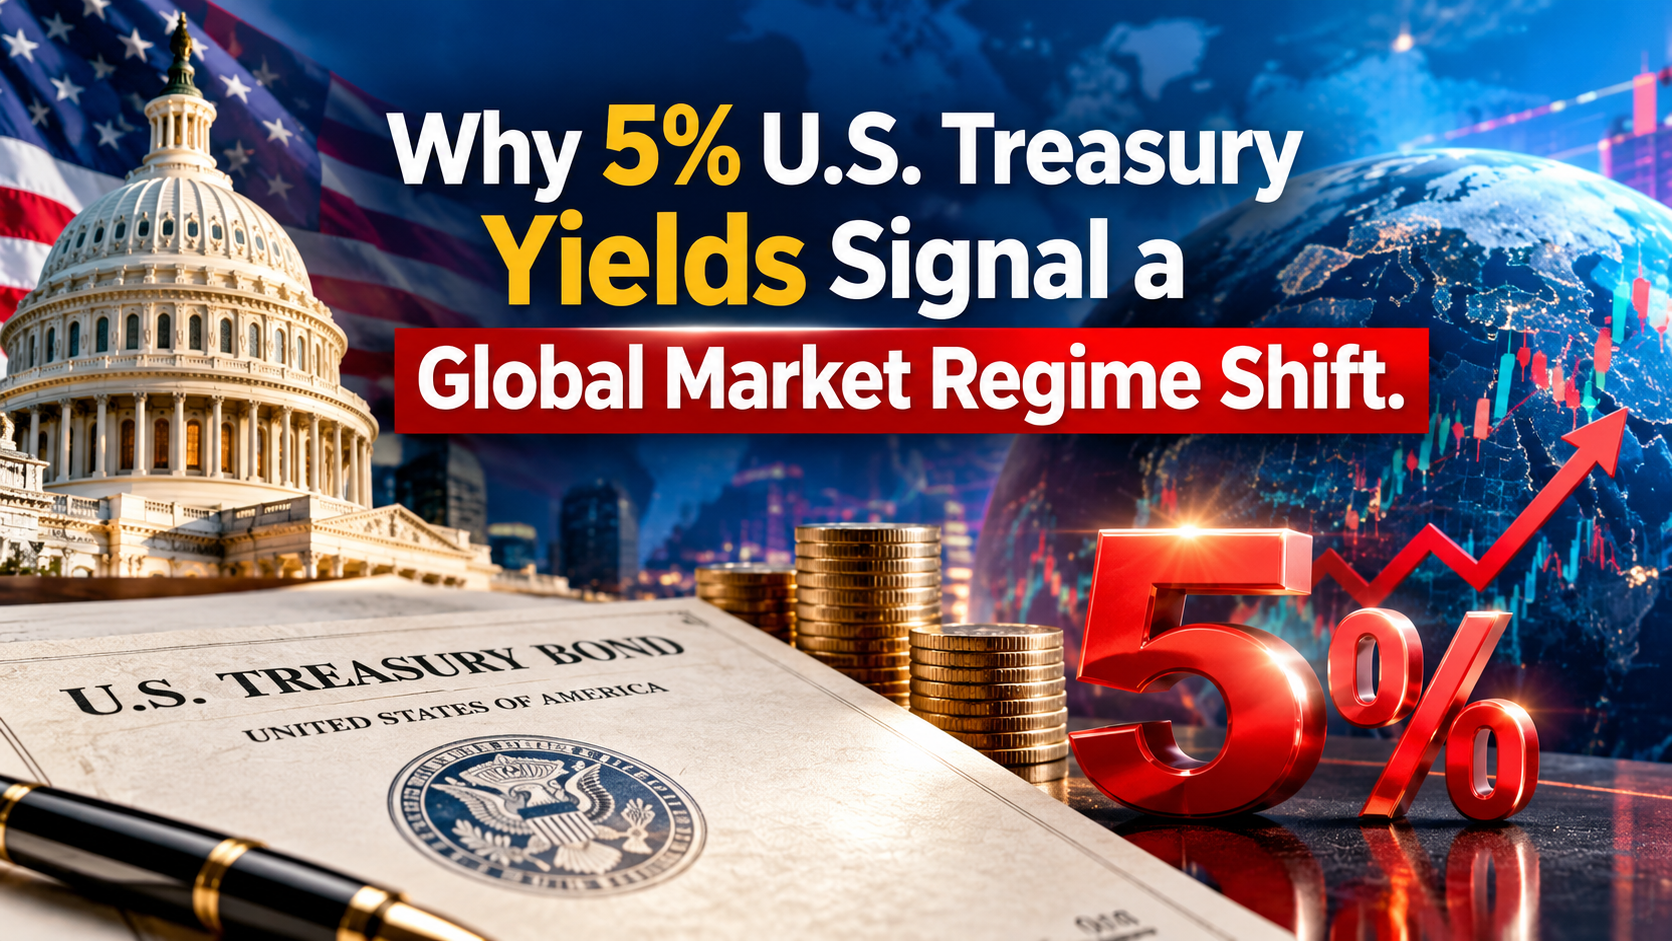
When the benchmark 10-year U.S. Treasury yield crosses the 5.0% threshold, financial markets undergo a structural paradigm shift. Far beyond a routine spike in borrowing costs, a 5% yield alters the hurdle rate for global capital, re-prices risk across every asset class, and exposes systemic sovereign debt fragilities.
1. The 5.0% Benchmark: Why the “Risk-Free” Rate Reshapes Equities
The 10-year U.S. Treasury note is the foundational anchor of global finance. Its yield represents the risk-free rate ($R_f$) utilized in the Capital Asset Pricing Model (CAPM) and Discounted Cash Flow (DCF) models worldwide.
When $R_f$ rises from 2%–3% to over 5%, the present value of future corporate earnings contracts exponentially.
$$\text{Present Value} = \sum_{t=1}^{n} \frac{CF_t}{(1 + WACC)^t}$$
As the Weighted Average Cost of Capital ($WACC$) climbs alongside Treasury yields:
- Growth Stocks & Big Tech: Long-duration growth equities—where the majority of projected cash flows sit far in the future—suffer the sharpest valuation multiple compressions.
- Equity Risk Premium (ERP) Squeeze: With risk-free Treasury bills yielding 5%, the additional premium required to hold volatile equities shrinks dramatically, prompting institutional capital to migrate from stocks to bonds.
- Corporate Liquidity Crunch: Corporate debt refinancing costs double or triple compared to pre-2022 issuance levels, directly eroding net profit margins reported to the U.S. Securities and Exchange Commission.
2. Macroeconomic Catalysts: What Is Driving the Bond Sell-Off?
The surge to 5%+ yields is driven by three primary structural forces rather than a single economic data point:
┌─────────────────────────────────────────────────────────────────────────┐
│                      DRIVER 1: FISCAL EXPANSION                         │
│  U.S. national debt interest + mandatory entitlement outlays now absorb │
│  ~98% of federal tax revenues (Source: U.S. Treasury Department).       │
└────────────────────────────────────┬────────────────────────────────────┘
                                     │
                                     ▼
┌─────────────────────────────────────────────────────────────────────────┐
│                     DRIVER 2: ISSUANCE MISMATCH                         │
│  84% of 12-month Treasury debt issuance concentrated in short-term T-   │
│  Bills, creating severe rollover sensitivity to rate hikes.             │
└────────────────────────────────────┬────────────────────────────────────┘
                                     │
                                     ▼
┌─────────────────────────────────────────────────────────────────────────┐
│                     DRIVER 3: CAPITAL COMPETITION                       │
│  Corporate AI CAPEX spending (~$700B–$900B/yr) competes with sovereign  │
│  bond issuance for global institutional capital reserves.               │
└─────────────────────────────────────────────────────────────────────────┘
Sovereign Debt & Supply Shock
As documented by the U.S. Department of the Treasury, massive fiscal deficit spending has accelerated net bond issuance. Because traditional central bank buyers engaged in quantitative tightening (QT) while foreign sovereign buyers reduced purchases, price discovery has shifted to price-sensitive private institutional investors who demand higher yields (term premium) to absorb debt supply.
Global Central Bank Tightening Synchronicity
Monetary policy decisions from the Federal Reserve System and global partners—such as the Bank of Japan raising interest rates—have reinforced elevated global rate floors. Official global debt perspectives from the International Monetary Fund highlight how high real yields strain emerging market borrowing capacity.
3. Sector Impact Analysis & Asset Class Vulnerabilities
| Asset Class / Sector | Impact Level | Primary Vulnerability / Opportunity |
| Mega-Cap Big Tech | Moderate to High | CAPEX borrowing costs rise; DCF discount rate expansion reduces forward P/E multiples. |
| Commercial & Residential Real Estate | Severe Headwind | Mortgage rates track 10-year yields; refinancing resets create valuation pressure. |
| Short-Term T-Bills & Money Market | Highly Favorable | Yields above 5% offer competitive risk-adjusted real returns without duration risk. |
| Hard Assets (Gold / Precious Metals) | Strategic Hedge | Fiscal deficit concerns and dollar devaluation risks enhance gold’s monetary status. |
| Asian & Emerging Market Equities | Selective Upside | Valuations in South Korea, Japan, and India trade at significant discounts relative to U.S. multiples. |
4. Tactical Asset Allocation Framework
Navigating a 5%+ Treasury yield environment requires balancing yield capture, capital preservation, and equity growth.
Core Portfolio Takeaways
- The Cash-Equivalent Shield: Allocating 35% to short-dated T-Bills mimics Warren Buffett’s liquidity strategy at Berkshire Hathaway, locking in 5%+ yields while preserving optionality for market corrections as reported by CNBC Markets.
- Selective Equity Quality: Focus equity exposure on companies with pristine balance sheets, low debt-to-equity ratios, and pricing power capable of outrunning inflation.
- Monetary Hedges: Gold and hard assets provide downside protection against potential currency weakness if central banks step in to cap bond yields through yield curve intervention. Further macroeconomic debt analysis is regularly updated by Bloomberg Markets and Reuters Financial News.
Discover more from The Economy
Subscribe to get the latest posts sent to your email.
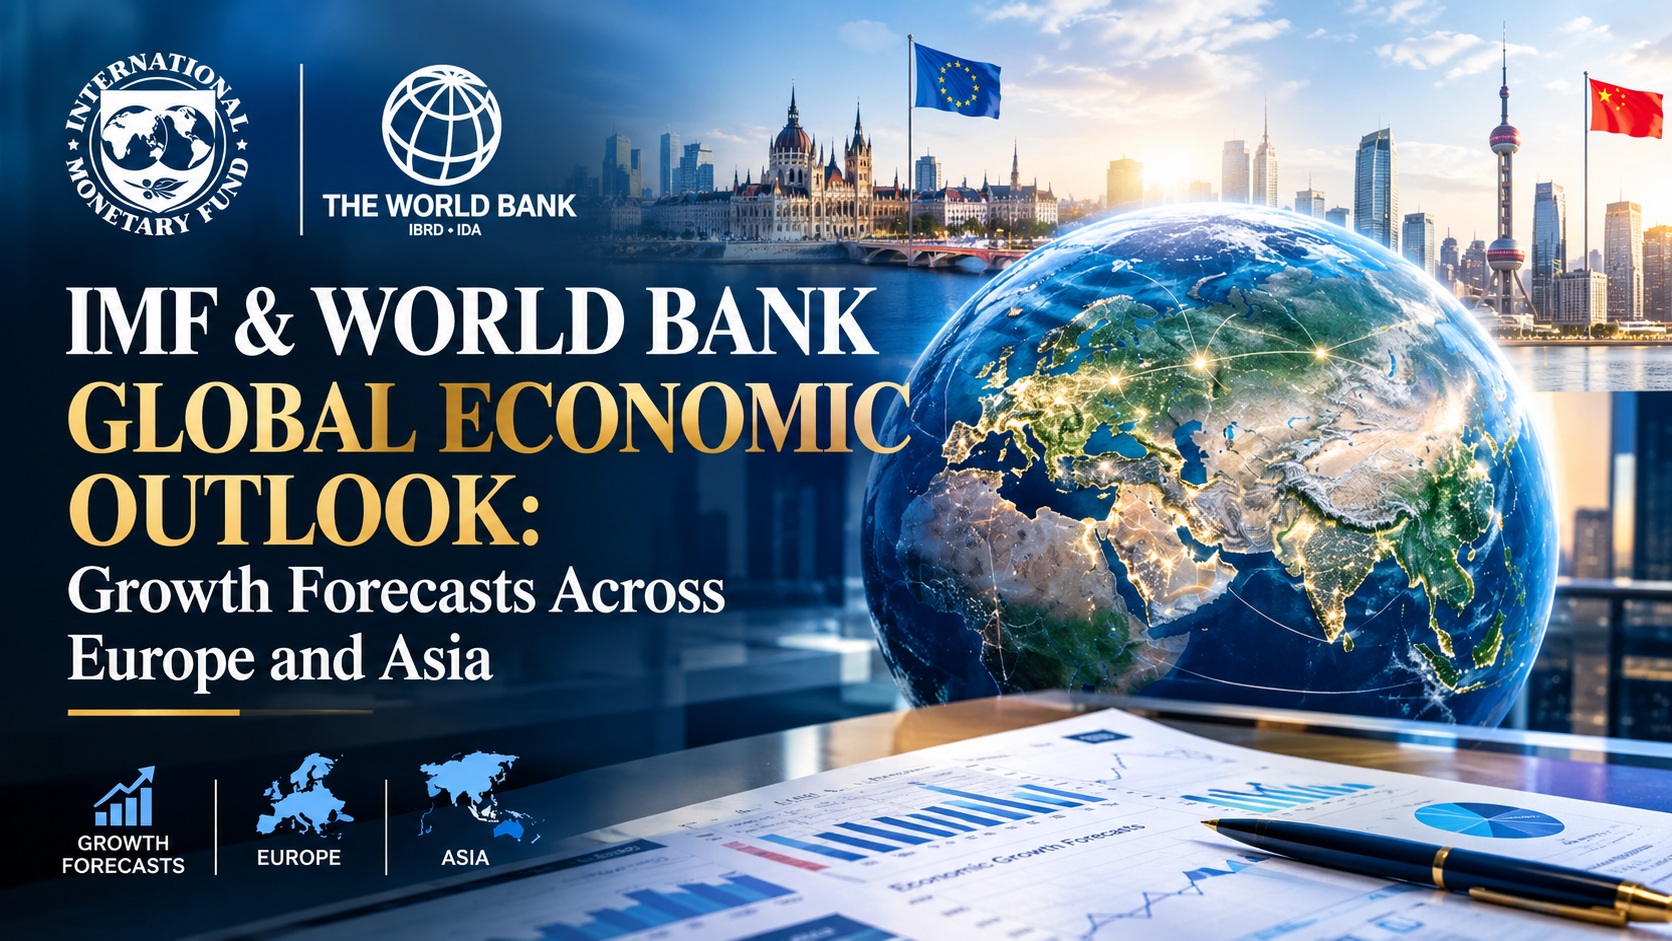
IMF sees 3.0% global growth in 2026, the World Bank just 2.5%. Compare Europe and Asia forecasts, the gap between them, and what it means for capital.
Executive Summary / Key Takeaways
- The IMF’s July 2026 World Economic Outlook Update projects global growth of 3.0% in 2026 and 3.4% in 2027, down from the 3.5% average of 2024–25.
- The World Bank’s June 2026 Global Economic Prospects is far darker: 2.5% in 2026, the weakest since the pandemic, with two-thirds of economies downgraded since January.
- The two institutions are not contradicting each other — they use different weighting methodologies — but the direction of both revisions is the same, and the driver is the Middle East war.
- Europe and Central Asia was cut to 2.1% for 2026; East Asia and Pacific to 4.2%. The Middle East, North Africa, Afghanistan and Pakistan region takes the worst hit at 1.6%.
- The divergence that matters for allocators is not regional but structural: economies plugged into the AI-led technology cycle are outperforming energy importers that are not.
1. Introduction & Immediate Context
Two flagship forecasts, two very different headline numbers, one identical story underneath. Anyone building a 2027 capital plan needs to understand why.
The IMF’s July update projects global growth of 3.0% in 2026 and 3.4% in 2027, down from the 3.5% average observed across 2024–25 and broadly unchanged on a cumulative basis from the April 2026 World Economic Outlook. The Fund attributes the modest slowdown to the effects of the war in the Middle East, partly offset by accelerated demand-driven momentum in the global technology cycle thanks to advances in artificial intelligence and its adoption.
The World Bank is blunter. It forecasts global growth slowing to 2.5% in 2026 from 2.9% in 2025 — the lowest rate since the onset of the COVID-19 pandemic — amid higher energy prices, steeper inflation and increased borrowing costs. Forecasts for two-thirds of economies were downgraded relative to January. Growth is expected to improve to 2.8% in 2027 but will remain 0.4 percentage point below the 2010s average.
The gap between 3.0% and 2.5% is largely methodological: the IMF aggregates at purchasing-power-parity weights, the World Bank at market exchange rates, which gives slower-growing advanced economies more influence. Read the revisions, not the levels.
2. Core Market / Strategic Analysis
2.1 Regional forecasts side by side
| Region | World Bank 2026 | World Bank 2027 | Revision direction | Source |
|---|---|---|---|---|
| World | 2.5% | 2.8% | Cut from 2.6% (Jan) | World Bank |
| East Asia & Pacific | 4.2% | 4.4% | Cut from 4.4% (Jan) | World Bank |
| Europe & Central Asia | 2.1% | 2.3% | Cut from 2.4% (Jan) | World Bank |
| South Asia | 6.3% | 6.9% | Fastest-growing region | World Bank |
| MENA, Afghanistan & Pakistan | 1.6% | 5.0% | Cut from 3.6% (Jan) | World Bank |
| Sub-Saharan Africa | 4.0% | 4.4% | Marginal easing | World Bank |
| Low-income countries | 5.4% | — | Cut 0.3pp on the conflict | World Bank |
The MENAAP line is the single most violent revision in the dataset: from 3.6% to 1.6% for 2026 in five months, followed by a mechanical 5.0% rebound in 2027 as base effects and assumed energy normalisation kick in. For frontier-market investors with Pakistan or Gulf exposure, that V-shape is the entire investment thesis — and it rests on an assumption about how long the conflict lasts.
2.2 The European picture
Growth in Europe and Central Asia is projected to decelerate to 2.1% in 2026, weakening in roughly 70% of economies in the region, according to the World Bank’s regional highlights. Domestic demand remains the primary driver but is constrained in 2026 by elevated energy prices, which raise inflation and erode real incomes, and by tighter financial conditions.
Commodity exporters in the region — Azerbaijan, Kazakhstan and Turkmenistan among them — see export revenues supported by higher energy prices even as growth slows. In Russia, the World Bank estimates oil revenue gains at roughly 1.5% of 2025 GDP for each $10 per barrel increase in prices, with those gains mainly directed toward fiscal consolidation.
The euro area itself sits at the sluggish end. The IMF’s January 2026 update had projected euro-area growth steady at 1.3% in 2026 and 1.4% in 2027, noting that the region benefits less than others from the technology-driven investment boost and that lingering energy-price effects continue to drag on manufacturing. Planned defence spending increases are expected to show up in output only in later years given phased commitments running to 2035.
2.3 The Asian picture
East Asia and Pacific is projected to fall to 4.2% in 2026 before firming to 4.4% in 2027 — a downgrade, but still comfortably the second-fastest-growing region. South Asia leads globally at 6.3% in 2026 and 6.9% in 2027.
The IMF’s framing explains why Asia holds up better than Europe: economies plugged into the technology-led upturn experience stronger activity even when they are energy importers, while activity weakens for energy importers with limited participation in that cycle. Energy exporters outside the conflict zone benefit from favourable terms of trade.
3. Structural Drivers and Competitor Gaps
Most coverage treats these as two competing headline numbers. The more useful read is that both institutions have converged on the same three-channel transmission mechanism, articulated by IMF Chief Economist Pierre-Olivier Gourinchas when the April outlook was released: higher energy and food prices themselves; persistence in wage and price inflation; and a confidence shock. The Fund noted at the time that the global economy had been on a roughly 3.3% trajectory and was heading for an upgrade before the war stopped that momentum, with inflation instead rising toward 4.4%.
Three structural points follow that competitors miss:
The dispersion is the story. The April WEO recorded a cumulative growth revision of nearly three percentage points for 2026 in the Middle East and North Africa, against comparatively modest effects in advanced economies. A single global number conceals a distribution this wide.
The 2027 rebound is conditional, not forecast. The World Bank’s recoveries across all regions in 2027–28 are driven by an assumed decline in energy prices and rebound in global activity. If Brent stays above $100, the rebound does not arrive on schedule.
AI is now a macro line item, not a sector story. Both institutions explicitly cite broader AI adoption as an upside risk offsetting the energy shock. That reframes technology capital expenditure as a national growth input, which is why Singapore, Malaysia and Taiwan are outperforming regional peers with similar energy exposure.
4. Key Implications for Stakeholders
Macro allocators. The IMF–World Bank spread is not noise to be averaged away; it is a signal about where you sit in the distribution. Market-weight exposure to advanced economies should be benchmarked against the World Bank’s 2.5%, not the IMF’s 3.0%.
Corporate strategists. Fiscal pressure is the binding constraint in developing markets. The World Bank flags that fiscal pressures will affect the ability to reduce poverty and food insecurity and to create jobs — which translates into weaker public procurement and slower infrastructure pipelines across frontier markets through 2027.
Frontier and EM investors. Emerging market and developing economies face their weakest per capita income growth since the pandemic. Pair that with the MENAAP downgrade and the case for selectivity over beta exposure is straightforward.
Watch the October calendar. The IMF’s next full World Economic Outlook lands with the Annual Meetings. Given the energy trajectory since July, the risk to the 3.0% figure is to the downside.
5. Frequently Asked Questions
Q1: What is the IMF’s global growth forecast for 2026?
The IMF projects 3.0% global growth in 2026 and 3.4% in 2027, per its July 2026 World Economic Outlook Update — down from the 3.5% average recorded across 2024–25, with the Middle East war the principal drag.
Q2: Why does the World Bank forecast lower growth than the IMF?
The World Bank aggregates using market exchange rates while the IMF uses purchasing-power-parity weights, giving slower-growing advanced economies more influence in the World Bank’s 2.5% figure. Both revised downward for the same reasons.
Q3: Which region is growing fastest in 2026?
South Asia, at a projected 6.3% in 2026 rising to 6.9% in 2027, according to the World Bank. East Asia and Pacific follows at 4.2%.
Q4: How badly has the Middle East conflict hit growth forecasts?
The World Bank cut its MENA, Afghanistan and Pakistan forecast from 3.6% to 1.6% for 2026, and downgraded two-thirds of all economies since January. Global growth is now at its weakest since the pandemic.
Discover more from The Economy
Subscribe to get the latest posts sent to your email.
Global Economy
Fed Rate Hike Projections vs. Trump’s Interest Rate Policy: What Global Markets Expect Next
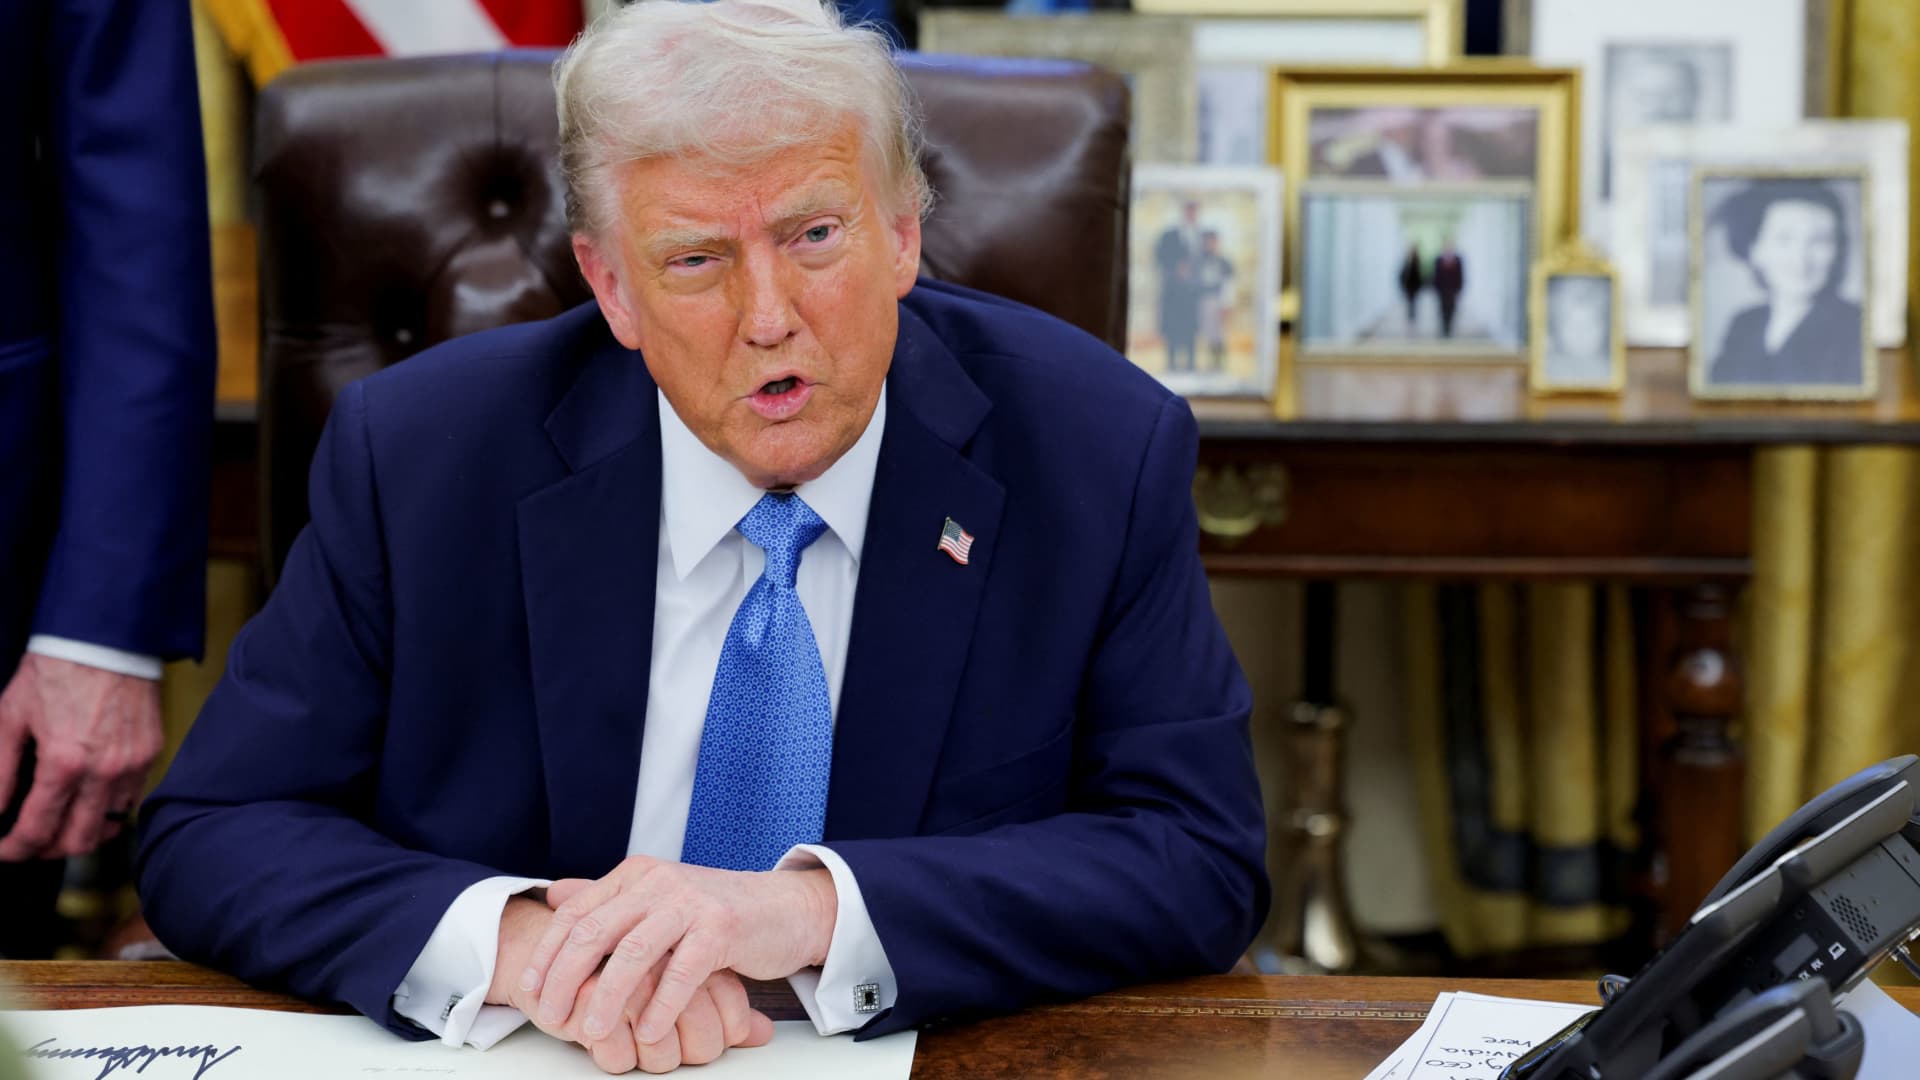
The Fed hiked to 3.75%-4% on Sept 16 as Trump demanded 1% rates. See the dot plot, the market reaction and what it means for borrowers next.
Executive Summary / Key Takeaways
- On 16 September 2026 the Federal Open Market Committee voted 12-0 to raise the federal funds target range by a quarter point to 3.75%–4.00% — the first US rate increase since July 2023.
- The statement was blunt: inflation remains elevated, and the action is meant to support a timelier return to the 2% goal.
- The dot plot showed 16 of 18 participants expecting at least one more quarter-point hike before year-end, with four seeing room for two. Chair Kevin Warsh declined to submit a projection at all.
- President Trump responded within hours, demanding that US rates fall to 1% “or less” — while saying he still has confidence in the chair he appointed.
- Markets sold the decision then partly reversed: the Dow fell more than 600 points, the 10-year Treasury yield topped 5%, and the two-year reached its highest level since 2024.
1. Introduction & Immediate Context
For three and a half years the direction of travel in US monetary policy was one-way — cuts, pauses and arguments about the pace of easing. That ended on Wednesday afternoon.
The Federal Reserve approved its statement by a 12–0 vote, lifting the target range for the federal funds rate by a quarter percentage point to 3¾–4 percent while continuing its policy of maintaining ample reserves in the banking system. The Committee described economic activity as expanding at a solid pace, noted that uncertainty remains elevated partly because of geopolitical developments, and observed that domestic spending has been resilient, productivity growth strong and capital investment robust.
Alongside that assessment sat a one-line justification for tightening: inflation remains elevated, and the policy action will support a timelier return to the 2 percent objective. That combination — firm growth, firm inflation — is what separates this decision from the reflexive easing bias markets carried through the first half of the year. As CNBC reported, futures markets had priced better than a 90% chance of the move, but the accompanying projections were more hawkish than most desks expected.
2. Core Market and Policy Analysis
2.1 What the dot plot actually says
The Summary of Economic Projections is the part institutional desks will trade for the next six weeks. Sixteen of eighteen policymakers anticipate at least one more quarter-point increase by the end of this year, and only two expect rates to stay where they are, according to Reuters. Four of those officials see two further hikes as possible.
Warsh’s refusal to publish his own dot is a deliberate break with a decade of Fed communication practice; he has said repeatedly that he opposes issuing forward guidance. For rate-sensitive borrowers that matters. The committee’s central tendency is now the only signal available, and it points higher.
| Metric / Indicator | Current Status | Projected Impact | Primary Source |
|---|---|---|---|
| Federal funds target range | 3.75%–4.00% (raised 25 bps, 12-0) | At least one further hike signalled for 2026 | Federal Reserve |
| FOMC dot plot | 16 of 18 see ≥1 more hike; 4 see two | Terminal-rate debate shifts toward 4.25%–4.50% | Reuters |
| PCE inflation projection | 3.7% in 2026, falling to 2.3% in 2027 | Above target across the forecast horizon | Fox Business |
| 10-year Treasury yield | Above 5% | Higher mortgage and corporate borrowing costs | Yahoo Finance |
| Prior policy path | Three cuts in 2025 to 3.50%–3.75%, then five holds | First reversal of the easing cycle since 2023 | Trading Economics |
2.2 The inflation case for tightening
Fed projections put PCE inflation at 3.7% in 2026, falling to 2.3% in 2027, with domestic spending remaining resilient, Fox Business reported. That is a second consecutive year of above-target inflation on the central bank’s own numbers, driven substantially by energy costs.
Warsh framed the decision in unusually plain terms at his press conference, saying that inflation is too high and has been for too long, and describing the vote as a sober, serious, responsible decision. Speaking to Bloomberg, he characterised the move as removing a dose of accommodation so that financial and credit conditions would sit more consistently with the Fed’s ultimate objectives — and said the action begins to show the central bank is serious about delivering price stability. He also noted that the economy has gathered speed since the July hold, with little sign of inflation cooling.
3. Structural Drivers and Competitor Gaps: The Independence Test
This is where most coverage stops short. The interesting variable is not 25 basis points; it is the institutional test now underway.
In the week before the meeting, the president, vice president, Treasury secretary and a senior White House economic counselor all publicly urged the Fed not to raise rates and in some cases to cut — an unusually broad pressure campaign even by the standards of Trump’s long-running criticism of the central bank, CNBC reported. Vice President JD Vance said the administration believes the Fed should be lowering rates and would appreciate help from the central bank. Treasury Secretary Scott Bessent argued that the Fed typically does not raise rates during a supply shock until second- or third-order inflationary effects appear.
The decision went the other way. Warsh voted with a unanimous committee despite that pressure, in a move read by analysts as an unambiguous signal that the White House should keep its hands off the Federal Reserve. Trump had selected Warsh in January after souring on former chair Jerome Powell — which is precisely what makes the vote consequential. This was not an inherited adversary defying the administration; it was the administration’s own appointee.
The presidential response came within hours. Trump wrote on Truth Social that US interest rates should be 1% or less because America is the best credit in the world, ending with a demand that rates be lowered fast, Reuters reported. He also appeared to link persistent US trade deficits to the central bank’s borrowing costs, though the two are largely unrelated. Asked later whether he believed Warsh had decided based on White House input, the president said he did not think so, and confirmed he still has confidence in the chair.
For sovereign allocators the pricing question is whether September establishes a durable precedent of operational independence, or whether the pressure campaign intensifies into 2027 as the midterm cycle bites. Long-end term premium is the cleanest instrument for expressing a view either way.
4. Key Implications for Stakeholders
Mortgage borrowers. The transmission channel is the long end, not the policy rate. The 10-year Treasury topped 5% around the decision while oil traded solidly above $100 per barrel, according to Yahoo Finance. Thirty-year fixed mortgage pricing tracks the long bond far more closely than the funds rate, so the term-premium repricing matters more than the hike itself.
Equity investors. Stocks reversed during Warsh’s press conference as markets read his remarks as hawkish, with the Dow dropping more than 600 points — over 1.2% — while the S&P 500 fell 0.4% and the Nasdaq finished near flat. Yardeni Research cut its year-end S&P 500 target to 7,900 from 8,400, citing higher Treasury yields driven by rising energy prices and an increased risk of a downturn over the next three to six months, CNBC noted.
Global markets. By Thursday, sentiment had steadied. Bloomberg reported Treasuries paring losses and US equity futures climbing as Warsh’s resolve reassured investors, with the two-year note easing a basis point to 4.72% after touching its highest level since 2024, and the 10-year and 30-year both slipping around two basis points.
Institutional positioning. The base case is now higher-for-longer with a live December hike. Markets are pricing one more 25-basis-point increase in 2026 followed by further tightening extending into 2027, per Seeking Alpha analysis of CME FedWatch pricing.
5. Frequently Asked Questions
Q1: What is the current Fed interest rate after the September 2026 meeting?
The federal funds target range is 3.75%–4.00%, raised by 25 basis points on 16 September 2026 in a unanimous 12-0 FOMC vote. It was the first US rate increase since July 2023 and partially reversed the 2025 easing cycle.
Q2: Will the Fed raise rates again in 2026?
The dot plot indicates 16 of 18 FOMC participants expect at least one further quarter-point increase before year-end, and four see two as possible. Markets currently price one additional hike in December, with more tightening possible into 2027.
Q3: How did Trump react to the Fed rate hike?
He demanded on Truth Social that US rates be cut to 1% or less, while telling reporters afterwards that he retains confidence in Chair Kevin Warsh and does not believe Warsh acted on White House instruction.
Q4: Why is the Fed hiking when inflation was supposed to be falling?
Fed projections put PCE inflation at 3.7% in 2026, well above the 2% target, driven substantially by energy prices. The Committee judged growth, productivity and capital investment strong enough to absorb tighter policy.
Discover more from The Economy
Subscribe to get the latest posts sent to your email.

Global Pension Systems Ranked: The World’s Best and Worst Retirement Frameworks

Global Supply Chain Vulnerabilities: From Eurasian Trade Corridors to Food Consumer Recalls

Why 5% U.S. Treasury Yields Signal a Global Market Regime Shift.

Federal Reserve Defies White House Pressure: Inside Trump’s Demand for Sub-1% Interest Rates After Historic 2026 Rate Hike

How Rising Interest Rates Impact Gig Economy Apps: DoorDash, Uber, and Urban Services

GasBuddy Market Insights: How Crude Price Shifts Impact Local Fuel Cost Averages

DoorDash Driver Payouts, Fee Structures, and Market Competition Analysis

OPINION:Breaking the 3.5% Growth Trap: How Pakistan Can Build a High-Productivity Export Economy

Global Equity Market Divergence: US Tech vs. European Dividend Stocks vs. Asian Growth

Asian Markets Analysis: Navigating Volatility in China, Japan, and Singapore Stocks

Stagflation vs. Soft Landing: How Central Bank Rates Are Reshaping European and Asian Economies

IMF & World Bank Global Economic Outlook: Growth Forecasts Across Europe and Asia

Fed Rate Hike Projections vs. Trump’s Interest Rate Policy: What Global Markets Expect Next

Singapore Stocks: The Ultimate Safe Haven for Markets and Finance in 2026?

State Farm’s $5B Dividend 2026: Who Qualifies & Payout Dates

US-China Relations in Q3 2026: Trade Tariffs and Supply Chain Risks

SpaceX Starship Flight 14: First Orbital Attempt & Starlink V3 Launch Explained

Top 30 Stocks for Investment in PSX for Massive ROI in 2026

The 2026 Crypto Regulatory Shift: What It Means for Institutional Investors

AI Chip Stocks 2026: The Best Semiconductor Investments Beyond Marvell

AI-Powered Training: The Next Multi-Billion Dollar Ecosystem in Fitness

Tween Back-to-School Trends 2026: What’s Driving the $85B Season

10-Year Treasury Yield Hits 4.80%: What It Means for Rates & Portfolios

Oil Prices Break $100 in 2026: Middle East Conflict & Energy Markets

Shein Clothes Quality & Safety in 2026: What Lab Tests Show

Fidelity Investments Review 2026: SPAXX Yields & Zero-Fee Funds

MRVL Earnings 2026: Why Marvell Sank Despite Beating Estimates

China’s US$10.8 Billion Trade Shortcut: Why the Pinglu Canal Matters
-

 Markets & Finance9 months ago
Top 15 Stocks for Investment in 2026 in PSX: Your Complete Guide to Pakistan’s Best Investment Opportunities
-

 Analysis7 months ago
Johor’s Investment Boom: The Hidden Costs Behind Malaysia’s Most Ambitious Economic Surge
-

 Analysis7 months ago
Top 10 Stocks for Investment in PSX for Quick Returns in 2026
-

 Analysis7 months ago
Brazil’s Rare Earth Race: US, EU, and China Compete for Critical Minerals as Tensions Rise
-

 Banks8 months ago
Best Investments in Pakistan 2026: Top 10 Low-Price Shares and Long-Term Picks for the PSX
-

 Investment8 months ago
Top 10 Mutual Fund Managers in Pakistan for Investment in 2026: A Comprehensive Guide for Optimal Returns
-

 Global Economy9 months ago
15 Most Lucrative Sectors for Investment in Pakistan: A 2025 Data-Driven Analysis
-

 Global Economy9 months ago
Pakistan’s Export Goldmine: 10 Game-Changing Markets Where Pakistani Businesses Are Winning Big in 2025