
Global Economy
15 Most Lucrative Sectors for Investment in Pakistan: A 2025 Data-Driven Analysis


While global investors chase saturated markets in established economies, Pakistan’s 240.49 million population presents a transformation that Goldman Sachs has quietly termed “the emerging market story of the decade”—yet 87% of international portfolios remain critically underexposed to this $350 billion economy poised at an inflection point.
The numbers tell a compelling story that contradicts mainstream narratives. Pakistan attracted $1.9 billion in FDI during fiscal year 2024, marking a 17% increase from the previous year, while the first seven months of FY25 saw FDI surge by 56% compared to the same period in FY24. But here’s what makes this moment historic: the convergence of demographic momentum, infrastructure maturity, and policy reforms is creating investment opportunities that won’t remain hidden much longer.
This analysis draws on institutional data from Pakistan’s Planning Commission, Ministry of Finance, State Bank of Pakistan, the IMF, World Bank, and Asian Development Bank to identify the 15 sectors where capital deployment offers the most attractive risk-adjusted returns through 2030.
Pakistan’s Economic Inflection Point: Understanding the 2025 Investment Landscape
The IMF projects Pakistan’s GDP growth at 2.7% for 2025 and 3.6% for 2026, but these headline figures mask profound sectoral dynamics. Inflation is expected to moderate to 4.5% in 2025, creating the most favorable monetary environment in five years for capital deployment.
Pakistan’s demographic dividend is perhaps its most underappreciated asset. With 65% of the population under 30 years old and agriculture employing half the labor force while contributing 24% to GDP, the economy is transitioning toward services and high-value manufacturing. The China-Pakistan Economic Corridor (CPEC) has already delivered $25 billion in infrastructure investments, with Phase II focusing on special economic zones and digital infrastructure that will unlock regional connectivity advantages.
The World Bank announced a $20 billion Country Partnership Framework with Pakistan, emphasizing clean energy and climate resilience projects, while the International Finance Corporation plans to invest up to $2 billion annually over the next decade. These institutional commitments signal a recalibration of Pakistan’s risk profile.
The Extended Fund Facility program with the IMF has driven critical reforms: currency stabilization, energy sector restructuring, and tax base expansion. For investors, this translates to improved repatriation conditions, reduced policy uncertainty, and a government increasingly aligned with market-oriented growth strategies.
Pakistan’s strategic geography positions it as the gateway between South Asia, Central Asia, and the Middle East. Gwadar Port’s operationalization creates a maritime trade corridor that reduces shipping costs for Central Asian republics by 40%, while road and rail networks connecting to China’s western provinces are transforming regional logistics economics.
THE 15 SECTORS: Where Smart Capital Finds Asymmetric Returns
1. Technology & IT Services: The $15 Billion Export Trajectory
Investment Thesis: Pakistan’s IT sector is experiencing explosive growth that few international investors have fully priced in.
Market Size & Growth: Pakistan’s IT and IT-enabled Services exports reached a record high of $3.8 billion in FY2024-25, while total IT, ITeS, and freelancers’ exports hit $4.6 billion for FY 2024-25, reflecting 26.4% growth. The government has set an ambitious but achievable target of $25 billion in IT exports by 2028.
Key Drivers: Zero income tax on IT exports until June 2025, 100% foreign ownership permitted, complete profit repatriation, and cost advantages where Pakistani developers charge 60-70% less than Western counterparts while delivering comparable quality. The United States accounts for 54.5% of Pakistan’s IT exports, but diversification into Gulf markets is accelerating rapidly.
Statistical Evidence: Monthly IT exports reached a historic high of $348 million in December 2024, up 28% year-over-year. Software services exports surpassed $1 billion for the first time in an 11-month period, showing 27.4% growth. The talent pipeline is robust, with over 300,000 IT graduates entering the workforce annually.
Opportunity Highlights: Software-as-a-Service (SaaS) startups, fintech platforms, blockchain development, artificial intelligence services, gaming development, and business process outsourcing. Pakistan hosted the first-ever Digital Foreign Direct Investment Forum, securing over $700 million in investment commitments. The upcoming Islamabad IT Park will provide state-of-the-art infrastructure for 10,000+ technology workers.
Risk Considerations: Internet reliability concerns and occasional policy uncertainty around VPN regulations require monitoring, though the government recognizes IT as a strategic growth sector.
Investment Entry Points: Direct stakes in Pakistani software houses, venture capital funds focused on Pakistani startups, partnerships with established firms like Systems Limited or TRG Pakistan, or real estate in technology parks.
2. Renewable Energy: The Solar Revolution Transforming Power Economics
Investment Thesis: Pakistan is experiencing the world’s fastest solar adoption rate, fundamentally restructuring energy economics.
Market Size & Growth: Pakistan imported 17GW of solar panel capacity in 2024, double the previous year’s imports, making it the world’s largest solar panel importer. The solar energy market is expected to grow from 6.75 gigawatts in 2025 to 15.5 gigawatts by 2030, representing an 18.09% compound annual growth rate.
Key Drivers: Electricity tariffs have doubled since 2021, creating powerful economic incentives for distributed solar. Between 2019 and 2025, cumulative solar panel imports surpassed Pakistan’s total installed power plant capacity by 2 gigawatts. Government targets call for 20% of electricity from renewables by 2025 and 30% by 2030.
Statistical Evidence: Net-metered rooftop solar reached 5.3 GW (5,300 MW) by end-April 2025, up from 2,500 MW a year earlier. Pakistan also imported an estimated 1.25 gigawatt-hours of lithium-ion battery packs in 2024, signaling the evolution toward solar-plus-storage solutions. Solar’s share of total electricity generation is expected to reach 1.6% in 2025, up from 0.7% in 2024.
Opportunity Highlights: Solar panel manufacturing and assembly (currently 90% imported from China), energy storage systems, solar farm development, agricultural solar pumps (with estimates that half of 1.5-2 million tube wells will switch to solar, adding 5.6-7.5 GW of capacity), and engineering, procurement, and construction (EPC) services. Wind energy presents complementary opportunities, with wind generation projected to reach 5,946 GWh in 2025.
Risk Considerations: Policy changes on net-metering tariffs could affect residential payback periods, though the economic fundamentals remain compelling given high grid electricity costs.
Investment Entry Points: Joint ventures with Chinese manufacturers for local assembly, solar farm development through PPIB, EPC contracting, or financing vehicles for commercial solar installations.

3. Agriculture & Agritech: Modernizing a $80 Billion Backbone
Investment Thesis: Agriculture contributes 24% to GDP and employs half the labor force, yet operates far below potential productivity due to outdated practices—creating massive modernization opportunities.
Market Size & Growth: The agriculture sector achieved 6.25% growth in FY2024, the highest in 19 years, driven by record wheat, rice, and cotton production. With 37.4% of employment in agriculture, productivity improvements translate directly to national GDP growth.
Key Drivers: State Bank of Pakistan allocated Rs 2,250 billion for agriculture lending in FY2024, 26.7% higher than the previous year. Climate-adaptive practices are essential following devastating 2022 floods that caused $12.9 billion in agricultural damages. Government focus on increasing oilseed and cotton production to reduce import dependence creates clear policy support.
Statistical Evidence: Wheat production reached 31.4 million tonnes in FY2024, up 11.6%, while cotton production surged 108.2% to 10.2 million bales after flood recovery. Livestock contributed 60.8% of agricultural value and grew 4.72% in FY2025, reflecting strong demand for dairy and meat products.
Opportunity Highlights: Precision agriculture technologies, drip irrigation systems, cold chain logistics, agricultural biotechnology, organic farming, livestock genetics improvement, dairy processing, and agricultural commodity trading platforms. CPEC agricultural cooperation includes technology transfer for disease-free zones, mechanization, and processing facilities.
Risk Considerations: Climate volatility remains a factor, with erratic rainfall patterns affecting crop yields. Land ownership disputes can complicate large-scale operations.
Investment Entry Points: Joint ventures in food processing, partnerships with agricultural universities for technology commercialization, or investment in agricultural finance institutions serving the unbanked rural population.
4. Textile & Apparel: Reclaiming the $25 Billion Export Vision
Investment Thesis: Textile exports rose 9.67% to $9.084 billion in the first half of FY25, with value-added segments driving growth as Pakistan capitalizes on Bangladesh’s manufacturing challenges.
Market Size & Growth: Pakistan’s textile exports reached $17.88 billion in FY2025, up 7.39%, with the sector representing 55.4% of total exports. Industry projections suggest $25 billion in annual textile exports is achievable with proper policy support.
Key Drivers: Political unrest in Bangladesh redirected export orders to Pakistan between December 2024 and March 2025, providing a window for Pakistani manufacturers to capture market share. Knitwear exports increased 15.47% and ready-made garments rose 17.52%, reflecting a strategic shift toward higher-value products.
Statistical Evidence: Textile exports in July-August FY2025 reached $2.92 billion, up 5.37% year-over-year. In 2024, textile exports increased by $1.3 billion compared to the previous year. The U.S. market accounts for $5 billion annually, representing 92% of Pakistan’s exports to America.
Opportunity Highlights: Vertical integration from spinning to garment manufacturing, technical textiles for automotive and industrial applications, sustainable fashion brands, and man-made fiber production. Cotton yarn faces challenges, but finished garments show strong momentum.
Risk Considerations: U.S. tariff policies could impact competitiveness, with President Trump’s tariffs potentially reducing exports by 20-25%. Energy costs and removal of zero-rating for local inputs pose cost pressures.
Investment Entry Points: Partnerships with established textile groups, investments in specialized segments like denim or home textiles, or development of export-oriented manufacturing facilities in special economic zones.
5. Construction & Real Estate: Urbanization’s $40 Billion Opportunity
Investment Thesis: With 65% of the population under 30 and rapid urbanization, Pakistan faces a housing shortage of 10 million units, creating sustained demand for decades.
Market Size & Growth: The construction sector contributes approximately 2.5% to GDP directly, with multiplier effects across 40+ allied industries. Government low-cost housing initiatives aim to deliver 500,000 units annually, while commercial real estate in Karachi, Lahore, and Islamabad shows 12-15% annual appreciation.
Key Drivers: State Bank of Pakistan’s construction financing schemes offer subsidized mortgages. Special Economic Zones under CPEC require industrial parks, warehousing, and worker housing. Tax incentives for construction materials and documented property transactions are improving sector transparency.
Statistical Evidence: Cement dispatches—a leading indicator—grew 8% in FY2024, reaching 52 million tonnes. Mortgage financing increased 35% year-over-year, though penetration remains below 0.3% of GDP, suggesting massive growth potential.
Opportunity Highlights: Affordable housing projects targeting middle-income families, commercial office spaces in metropolitan areas, hospitality infrastructure for tourism, logistics parks near CPEC routes, and Build-Operate-Transfer (BOT) infrastructure projects.
Risk Considerations: Property registration complexities and uneven documentation standards require thorough legal due diligence. Currency volatility affects imported construction materials.
Investment Entry Points: Real Estate Investment Trusts (REITs) are emerging, joint ventures with established developers, or direct land banking in areas designated for future development.
6. Healthcare & Pharmaceuticals: Serving 240 Million Lives
Investment Thesis: Pakistan’s healthcare expenditure is only 2.8% of GDP—far below the World Health Organization’s 5% recommendation—creating structural growth as incomes rise and health awareness increases.
Market Size & Growth: The pharmaceutical market is valued at $4.2 billion, growing 12-15% annually. With a doctor-to-patient ratio of 1:1,300 (WHO recommends 1:1,000), healthcare infrastructure expansion is inevitable.
Key Drivers: Rising middle class with health insurance coverage expanding, government’s push for Universal Health Coverage, COVID-19’s lasting impact on health consciousness, and pharmaceutical export potential to Africa and Central Asia.
Statistical Evidence: Pharmaceutical production increased 6.8% in FY2024, with local manufacturers meeting 70% of domestic demand. Medical device imports grew 15% annually, indicating market expansion. Private hospital chains are expanding bed capacity by 20% year-over-year in major cities.
Opportunity Highlights: Diagnostic laboratories, specialty hospitals (cardiac, orthopedic, oncology), telemedicine platforms, pharmaceutical manufacturing under licensing agreements, medical tourism targeting diaspora and regional patients, and health insurance platforms.
Risk Considerations: Price controls on essential medicines can compress margins. Regulatory approval processes require navigation with experienced local partners.
Investment Entry Points: Partnerships with hospital chains like Shaukat Khanum or Aga Khan University Hospital, pharmaceutical contract manufacturing, or diagnostic center franchises.
7. Financial Services: Banking the Unbanked Majority
Investment Thesis: Only 21% of Pakistani adults have bank accounts, while 53% have mobile phone connections—creating a massive fintech opportunity to leapfrog traditional banking.
Market Size & Growth: The banking sector holds assets of $180 billion, with Islamic banking growing at 20% annually and now comprising 22% of total banking assets. Digital payments grew 47% in FY2024.
Key Drivers: State Bank of Pakistan’s Digital Pakistan initiative, mandatory digital payments for government transactions, and branchless banking regulations. Remittances—$29.4 billion in fiscal year 2021—create demand for efficient money transfer solutions.
Statistical Evidence: Mobile wallet accounts surged to 120 million, with transaction values increasing 65% year-over-year. Credit card penetration remains below 2%, indicating massive potential. Microfinance institutions serve only 9 million borrowers against a target market of 40 million.
Opportunity Highlights: Digital payment gateways, peer-to-peer lending platforms, microfinance banks, Islamic finance products, insurance technology (insurtech), credit scoring using alternative data, and embedded finance solutions for e-commerce.
Risk Considerations: Cybersecurity infrastructure is developing but requires investment. Regulatory compliance for fintech startups demands careful attention.
Investment Entry Points: Equity stakes in fintech startups, partnerships with commercial banks for digital transformation, or microfinance bank investments serving underbanked segments.
8. Mining & Minerals: Unlocking $6 Trillion in Untapped Resources
Investment Thesis: Pakistan possesses world-class mineral deposits—including the Reko Diq copper-gold project valued at over $60 billion—that remain largely unexploited due to historical policy constraints now being resolved.
Market Size & Growth: Estimated mineral reserves total $6 trillion, yet mining contributes only 2.8% to GDP. Reko Diq alone will produce 200,000 tonnes of copper and 250,000 ounces of gold annually at full capacity.
Key Drivers: Saudi Arabia is considering acquiring a 10-20% stake in the Reko Diq project, validating the sector’s potential. New mining policies offer tax holidays, streamlined approvals, and guaranteed repatriation. Global energy transition increases demand for copper, lithium, and rare earth elements found in Pakistan.
Statistical Evidence: Coal reserves exceed 185 billion tonnes, primarily in Thar, where mining has commenced with power generation capacity of 1,320 MW operational. Cement industry consumes 45 million tonnes of limestone annually, supporting sustainable extraction. Gemstone exports (emeralds, rubies) reached $15 million in FY2024 with informal sector much larger.
Opportunity Highlights: Reko Diq copper-gold complex (Balochistan), Thar coal integrated mining and power projects, marble and granite extraction for export, rare earth element exploration, and mineral processing facilities near extraction sites.
Risk Considerations: Balochistan’s security situation requires robust risk management. Infrastructure connectivity to mines needs investment. Environmental permits demand comprehensive compliance.
Investment Entry Points: Joint ventures with government entities like Balochistan Minerals, equipment leasing to mining operators, or downstream mineral processing facilities.
9. Logistics & Transportation: Moving Goods Across Trade Corridors
Investment Thesis: Pakistan’s location at the intersection of $3 trillion in annual trade routes creates logistics demand that current infrastructure cannot meet, with e-commerce growth adding urgent capacity needs.
Market Size & Growth: Logistics costs represent 18-20% of GDP (versus 10-12% in developed economies), indicating massive efficiency gains possible. E-commerce penetration below 2% is growing at 40% annually, requiring supporting logistics.
Key Drivers: Gwadar Port operationalization, CPEC transport corridors, government’s push to increase railway freight share from 4% to 20% by 2030, and cold chain requirements for agricultural exports.
Statistical Evidence: Container traffic at Karachi Port grew 7% in FY2024, reaching 2.6 million TEUs. Road freight dominates 96% of cargo movement, but railway infrastructure investments of $8 billion are underway. Warehousing space in major cities commands 15-20% annual rental yields.
Opportunity Highlights: Cold chain facilities for agricultural products, last-mile delivery solutions for e-commerce, third-party logistics (3PL) providers, inter-city freight services, warehousing near ports and borders, and technology platforms for load optimization.
Risk Considerations: Road infrastructure quality varies significantly by region. Regulatory differences between provinces complicate inter-provincial operations.
Investment Entry Points: Partnerships with logistics companies like TCS or Leopard Courier, warehouse development in industrial estates, or specialized cold storage facilities.
10. Tourism & Hospitality: Rediscovering the ‘Switzerland of Asia’
Investment Thesis: Northern Pakistan’s mountain landscapes rival Switzerland’s beauty at 10% of the cost, while religious tourism (especially to Sikh and Sufi sites) creates year-round demand—yet hospitality infrastructure is severely underdeveloped.
Market Size & Growth: Tourism contributes only 5.9% to GDP (versus 10.4% in comparable economies), with 1.1 million international arrivals in 2024 (pre-pandemic levels were 1.9 million). Domestic tourism is booming, with 60 million domestic tourists annually.
Key Drivers: Government’s visa-on-arrival for 50 countries, marketing campaigns showcasing Pakistan’s beauty, improved security perceptions, and UNESCO World Heritage sites (6 total) gaining recognition. K2 base camp treks command $5,000+ per tourist, while Hunza and Skardu are becoming Instagram-famous destinations.
Statistical Evidence: Hotel occupancy in Gilgit-Baltistan reached 85% during summer 2024, with rates increasing 30% year-over-year. Religious tourism to Kartarpur Corridor (for Sikhs) exceeded 3 million visitors since opening. Adventure tourism revenue in northern areas grew 45% in FY2024.
Opportunity Highlights: Boutique hotels in scenic locations, adventure tourism operators (trekking, mountaineering, rafting), religious tourism facilities, eco-lodges, heritage site restoration with commercial operations, and travel technology platforms connecting tourists with verified services.
Risk Considerations: Seasonal demand concentration in summer months (May-October) requires business model adaptations. International perceptions of security, though improving, require proactive management.
Investment Entry Points: Hotel development in underserved tourist areas, partnerships with provincial tourism departments, or acquisition of heritage properties for restoration and operation.
11. Education Technology: Bridging the Skills Gap
Investment Thesis: With 26 million children out of school and a youth bulge requiring vocational training, education technology offers scalable solutions to Pakistan’s human capital challenge.
Market Size & Growth: The education sector is valued at $9 billion, growing 8% annually. Online education penetration accelerated during COVID-19 but remains below 5% of the market, suggesting massive headroom.
Key Drivers: Government partnerships for digital classrooms, corporate demand for skilled workers in IT and manufacturing, and parental willingness to invest in children’s education even in low-income segments. 4G coverage reaching 80% of population enables mobile-first learning.
Statistical Evidence: EdTech startups raised $28 million in venture funding in 2024, with platform enrollments growing 120% year-over-year. Vocational training market is valued at $600 million, with government allocating $100 million for skills development programs. Test preparation market (for MDCAT, ECAT, CSS, etc.) exceeds $200 million annually.
Opportunity Highlights: Online K-12 education platforms, vocational training in high-demand skills (coding, digital marketing, design), test preparation services, corporate training solutions, learning management systems for schools, and AI-powered personalized learning apps.
Risk Considerations: Payment collection from consumer segments requires robust systems. Content localization in Urdu and regional languages is essential for mass market penetration.
Investment Entry Points: Venture capital investments in promising EdTech startups, partnerships with educational institutions for technology deployment, or franchise models for test preparation centers.
12. Automotive & Electric Vehicle Manufacturing: Electrifying Mobility
Investment Thesis: Pakistan assembles 250,000 vehicles annually in a market dominated by three players, while EV adoption is emerging with government incentives—creating disruption opportunities for new entrants.
Market Size & Growth: Automotive sector contributes 4% to GDP and employs 3.5 million people directly and indirectly. Local assembly saves 30-40% versus full imports through tariff structures designed to encourage localization.
Key Drivers: Government’s EV policy offers 5-year tax holidays, lower duties on EV imports, and mandates for charging infrastructure. Rickshaws and motorcycles (5 million units annually) are prime electrification targets. Rising fuel costs (petrol at PKR 280/liter) make EVs economically attractive.
Statistical Evidence: Two-wheeler production reached 2.3 million units in FY2024, while car production was 190,000 units. Chinese brands (MG, Chery, BYD) are entering with competitive EVs. Motorcycle electrification pilot programs in Lahore and Karachi show 65% cost savings versus gasoline.
Opportunity Highlights: EV assembly plants through joint ventures, charging infrastructure networks, battery manufacturing and recycling, auto parts localization (currently 60% imported), and conversion kits for existing vehicles to electric/CNG.
Risk Considerations: Currency volatility affects CKD (completely knocked down) import costs. Consumer preference for established Japanese brands requires brand-building investment.
Investment Entry Points: Joint ventures with Chinese EV manufacturers, dealership networks for new brands, or specialized EV components manufacturing.
13. Food Processing & FMCG: Feeding a Nation of 240 Million
Investment Thesis: Post-harvest losses exceed 30% of agricultural production due to inadequate processing and storage, while packaged food penetration remains low—creating a $15 billion processing opportunity.
Market Size & Growth: FMCG market valued at $22 billion, growing 10% annually as urbanization and modern retail expand. Food processing contributes 2% to GDP versus 8-10% in comparable economies, indicating structural growth potential.
Key Drivers: Rising disposable incomes, nuclear family structures preferring convenience foods, halal certification providing export access to 1.8 billion Muslim consumers globally, and cold chain development enabling perishables handling.
Statistical Evidence: Packaged milk penetration reached 52% (from 3% in 2000), proving scalability of organized processing. Dairy exports to Afghanistan and Central Asia grew 18% in FY2024. Snack foods market expanded 15%, with local players like Kolson and Ismail Industries competing effectively.
Opportunity Highlights: Dairy processing for domestic and export markets, meat processing with halal certification, fruit and vegetable processing for export, snack foods for growing middle class, and organic food products targeting premium segments.
Risk Considerations: Raw material price volatility affects margins. Working capital requirements for agricultural sourcing need careful management.
Investment Entry Points: Partnerships with agricultural cooperatives for reliable sourcing, acquisition of existing brands, or greenfield processing facilities near production areas.
14. Telecommunications & 5G Infrastructure: Connecting Digital Pakistan
Investment Thesis: Mobile penetration exceeds 90%, but data usage is exploding as Pakistan transitions from 3G/4G to 5G, requiring infrastructure investments of $8 billion through 2030.
Market Size & Growth: Telecom sector generates $3.8 billion in annual revenue, with cellular companies investing $800 million annually in network expansion. Data revenue now represents 45% of operator revenue, up from 25% five years ago.
Key Drivers: 5G spectrum auctions scheduled for 2025, government’s smart city initiatives requiring connectivity, IoT applications for agriculture and logistics, and content streaming demand. Average data consumption per user doubled to 12GB/month in 2024.
Statistical Evidence: Pakistan has 196 million cellular subscribers with 122 million using mobile broadband. Fiber-to-the-home coverage reached 2.8 million connections, growing 40% year-over-year. Telecom sector contributed $4.5 billion to national exchequer in FY2024.
Opportunity Highlights: Tower infrastructure sharing models, 5G equipment deployment, fiber optic network expansion, data center facilities, content delivery networks, and telecom tower real estate investment trusts.
Risk Considerations: Regulatory environment includes high taxation on telecom services. License fee structures require monitoring.
Investment Entry Points: Infrastructure-sharing partnerships with operators, data center development for cloud services, or specialized 5G applications for industrial clients.
15. Chemical & Petrochemical Industry: Building Industrial Foundation
Investment Thesis: Pakistan imports $4 billion in chemicals annually while possessing feedstock advantages in natural gas—creating import substitution opportunities worth billions.
Market Size & Growth: Chemical sector contributes 1.2% to GDP, valued at $4.2 billion, with fertilizer production being largest segment. Plastics and polymer demand grows at 8% annually, driven by packaging and construction.
Key Drivers: Government’s policy to encourage downstream industries under CPEC special economic zones, guaranteed gas supply to priority industries, and rising agricultural demand for fertilizers and crop protection chemicals.
Statistical Evidence: Urea production reached 6.2 million tonnes in FY2024, with Pakistan largely self-sufficient. Phosphate fertilizer (DAP) production is expanding with new plants adding 1.2 million tonnes capacity. Plastics consumption per capita is only 11 kg (versus 45 kg in India), indicating growth runway.
Opportunity Highlights: Specialty chemicals for agriculture, plastics and polymer production, fertilizer manufacturing with gas-based feedstock, pharmaceutical intermediates, and petrochemical refining with value addition.
Risk Considerations: Natural gas pricing policies can impact feedstock economics. Environmental regulations on chemical manufacturing are tightening.
Investment Entry Points: Joint ventures in special economic zones with gas supply guarantees, partnerships with engineering firms for plant setup, or distribution networks for imported specialty chemicals.
Navigating Pakistan’s Investment Frontier: Strategic Takeaways
Pakistan’s investment narrative in 2025 is fundamentally different from the crisis-dominated years that preceded it. The convergence of structural reforms, demographic momentum, and strategic geography creates a rare alignment of factors that sophisticated investors recognize.
Seven Strategic Recommendations for Investors:
- Start with Sectors Showing Demonstrated Momentum: IT services, solar energy, and textile value-addition are already delivering returns and provide lower-risk entry points before moving to emerging opportunities.
- Leverage Government Policy Alignment: Sectors receiving explicit government support through Special Investment Facilitation Council—including IT, agriculture, mining, and EVs—benefit from bureaucratic streamlining.
- Partner with Established Local Players: Pakistan’s business ecosystem rewards relationships. Joint ventures with respected groups provide market access, regulatory navigation, and operational expertise.
- Build Repatriation Strategies from Day One: While regulations permit 100% profit repatriation, practical implementation requires banking relationships and documentation. Structure this proactively.
- Diversify Geographic Exposure: Punjab dominates economic activity, but opportunities in Sindh’s ports, Khyber Pakhtunkhwa’s minerals and tourism, and Balochistan’s natural resources offer higher-risk, higher-return profiles.
- Plan for Long-Term Capital Deployment: Pakistan rewards patient capital. Three-to-five-year horizons capture market development cycles better than short-term trading approaches.
- Monitor Political Economy Closely: IMF program compliance, U.S.-Pakistan trade relations, and China’s CPEC commitments significantly impact investment climate. Maintain scenario planning for policy shifts.
Risk Mitigation Framework:
Currency hedging through natural hedging (export-linked revenues), political risk insurance from multilateral agencies, diversified stakeholder engagement, and robust governance structures minimize downside exposure while capturing upside potential.
Three-Year Outlook: By 2028, successful investors will have established market positions in sectors transitioning from fragmented to organized. IT sector could realistically reach $12-15 billion in exports, solar installations could exceed 25 GW total capacity, and textile exports could approach the $25 billion target if tariff negotiations succeed.
Ten-Year Outlook: Pakistan’s economy could reasonably reach $500 billion by 2035 if current reform trajectories persist. Population exceeding 260 million, with median age of 25, creates consumer demand comparable to Indonesia’s growth in the 2000s. Infrastructure investments under CPEC Phase II unlock connectivity premiums in logistics, manufacturing, and services.
The question for institutional investors is not whether Pakistan presents opportunities—the data confirms it does—but rather which sectors align with their risk appetite, time horizons, and operational capabilities. The early movers who establish positions now, while valuations remain attractive and competition is manageable, will capture asymmetric returns as Pakistan’s economy matures over the coming decade.
For investor inquiries and detailed sector analysis reports, contact the Pakistan Board of Investment at invest.gov.pk or explore opportunities through the Special Investment Facilitation Council (SIFC).
Data Sources: Planning Commission of Pakistan (pc.gov.pk), Ministry of Finance (finance.gov.pk), Board of Investment Pakistan
Disclaimer: This analysis is for informational purposes only and does not constitute investment advice. Prospective investors should conduct thorough due diligence and consult with financial advisors before making investment decisions.
Discover more from The Economy
Subscribe to get the latest posts sent to your email.


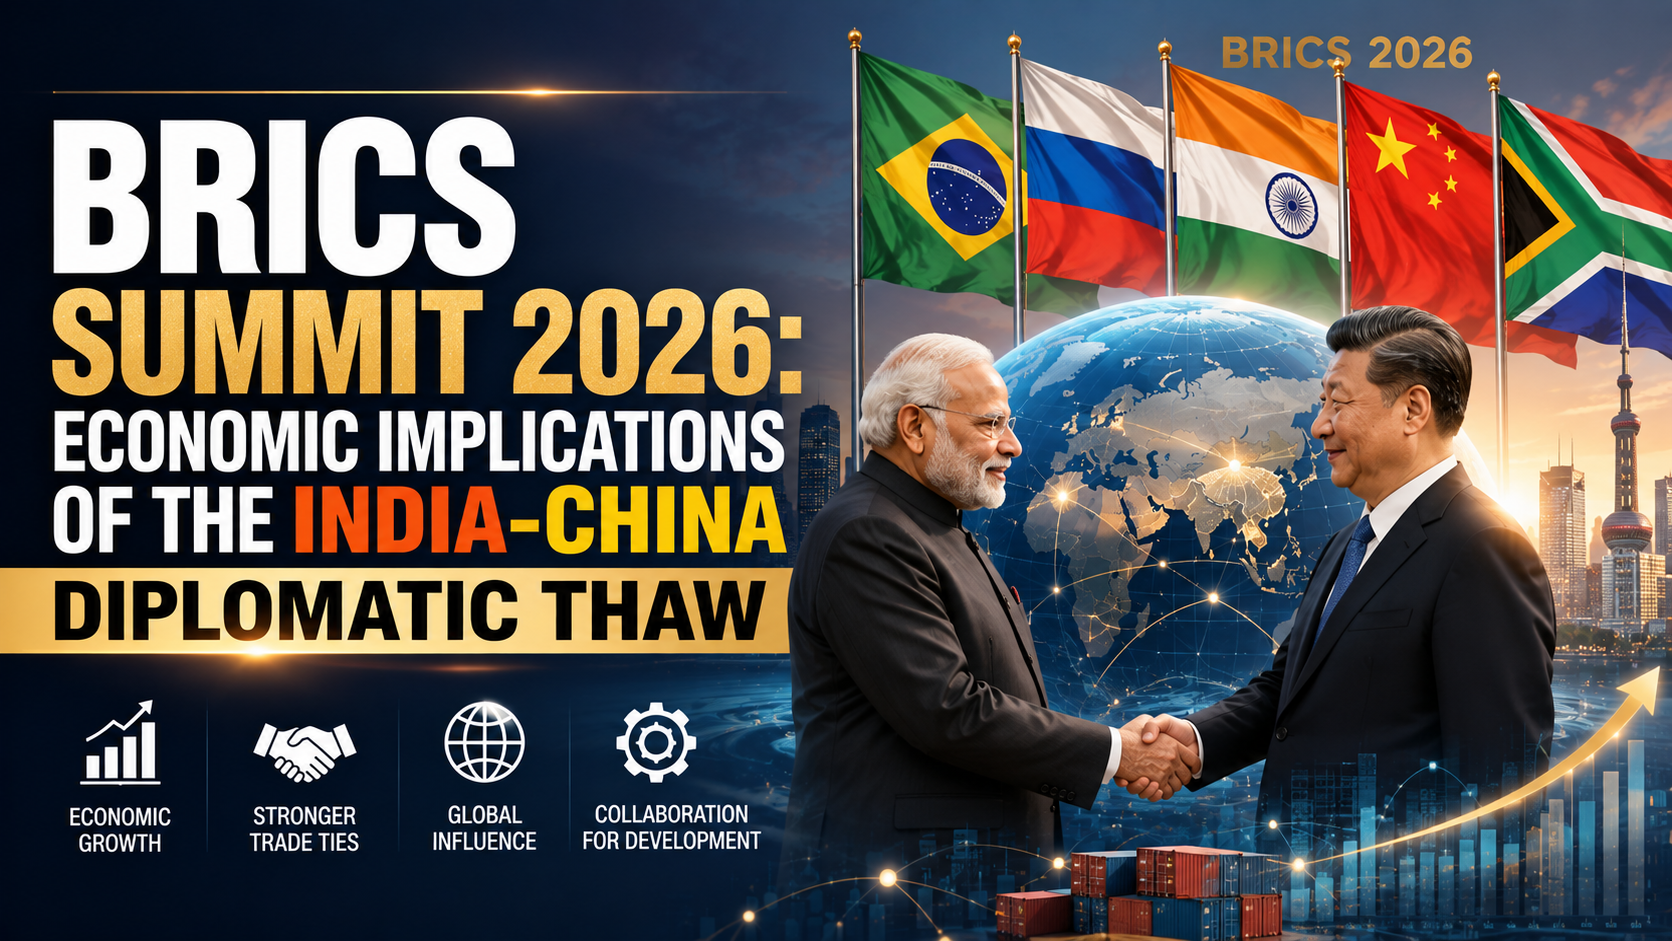
Chinese President Xi Jinping is expected to travel to New Delhi on September 12–13, 2026, for the 18th BRICS Summit — his first visit to India in six years, and the clearest signal yet that Beijing and New Delhi are prepared to move past the 2020 Galwan Valley border clash, according to Indian Defence News. For enterprise strategists and investors positioned across South Asian and Chinese supply chains, this is not a symbolic handshake — it is a signal event with direct implications for trade flows, tariff exposure, and capital competition across the Global South.
From Galwan to Kazan to New Delhi: The Timeline
The normalization process has moved in deliberate stages, not a single reset:
- October 2024 — Kazan, Russia: Modi and Xi meet on the sidelines of the BRICS summit, the first formal meeting since 2019, following a border disengagement agreement, according to The Diplomat.
- 2025 — Resumption of high-level visits: India’s defense and external affairs ministers visited Beijing; China’s Foreign Minister Wang Yi visited New Delhi, producing several bilateral agreements, per The Diplomat.
- August 2025 — Tianjin SCO Summit: Modi and Xi met again, described as the culmination of the resumed high-level engagement.
- May 2025 — India-Pakistan conflict stress test: The thaw survived Beijing providing military and political support to Islamabad against India during a brief conflict — evidence the normalization is now resilient to shocks, per The Diplomat.
- September 12–13, 2026 — New Delhi BRICS Summit: India chairs BRICS for a fourth time, hosting Xi for the first time since 2019, per Indian Defence News.
Why Now: The Strategic Logic on Both Sides
For Beijing, sustaining a frozen conflict with a rising economic power while simultaneously managing friction with Washington over the South China Sea and Taiwan Strait has become strategically costly, per Indian Defence News. For New Delhi, hosting Xi under the multilateral BRICS umbrella allows Modi to project global statesmanship while engaging Beijing without appearing to unilaterally concede on unresolved border issues.
Crucially, analysts at the China-Global South Project note the 2026 dynamic is being shaped primarily by regional realities and a deliberate decoupling of economic cooperation from security disputes — not by U.S. trade pressure, even though Trump-era tariff policy has often been cited as a contributing factor.
Where the Economic Exposure Sits
Import Dependency: India’s Structural Vulnerability
India’s supply chains remain heavily dependent on Chinese intermediate goods, particularly in pharmaceuticals and electronics, according to Indian Defence News. Any further normalization of technology-investment restrictions — India banned a range of Chinese tech applications and tightened border-nation investment rules after Galwan — would be the single highest-impact policy shift for enterprise B2B supply chain planners in the region.
The BRICS Bloc Itself: Expanded and More Consequential
The 2026 summit occurs against a materially expanded BRICS bloc. Since the original five-member group, Egypt, Ethiopia, Iran, Saudi Arabia, and the UAE joined in 2024, and Indonesia joined in 2025, per the official BRICS 2026 site — with ten additional partner countries (Belarus, Bolivia, Cuba, Kazakhstan, Malaysia, Nigeria, Thailand, Uganda, Uzbekistan, Vietnam) joining in 2025. The bloc’s prior Rio summit produced a Leaders’ Framework Declaration proposing to mobilize $300 billion annually by 2035 for climate finance, according to Business Standard.
Trade & Investment Exposure Matrix
| Sector | Pre-Thaw Position (2020–2024) | Post-Thaw Trajectory (2025–2026) | Enterprise Risk/Opportunity |
|---|---|---|---|
| Pharmaceuticals (API imports) | Heavy Indian dependency on Chinese active pharmaceutical ingredients | Potential easing of investment friction | Opportunity: supply diversification talks; Risk: continued single-source dependency |
| Electronics/consumer tech | Chinese app bans, investment screening for border-sharing nations | Selective, cautious relaxation possible | Watch for FDI rule changes ahead of/after the summit |
| Border trade | Suspended since 2020 | Partial resumption of trade at three border outposts | Direct logistics opportunity for regional trade B2B services |
| Africa infrastructure/capital | Parallel, competing Chinese BRI and Indian maritime/digital investment | Continued competition, not cooperation | Africa remains contested capital-deployment theatre, per Indian Defence News |
| AI governance | No joint framework | BRICS Leaders’ Statement on Global AI Governance (Rio) | Multilateral framework emphasizing Global South inclusion, UN-led process |
Sources: Indian Defence News, The Diplomat, Business Standard — see citations above.
What to Watch at the September Summit
- Border trade mechanics: Whether the Working Mechanism for Consultation and Coordination produces concrete friction-point resolutions in eastern Ladakh ahead of the summit, per Indian Defence News.
- Investment-screening rule changes: Any signal India will ease its border-nation FDI restrictions would be the most direct enterprise-relevant outcome.
- Africa positioning: Whether joint statements address, rather than paper over, competing Chinese BRI and Indian maritime-security/digital-investment strategies across the continent.
- AI governance follow-through: Concrete mechanisms building on the Rio AI governance statement, relevant to any enterprise operating AI infrastructure across BRICS-aligned markets.
The Caveat: This Is a Thaw, Not a Resolution
Independent policy analysis from the ISAS Brief is explicit that the Kazan-era thaw has not resolved bilateral mistrust or delivered progress on sensitive issues — it has stabilized the border and eased some economic restrictions without addressing the underlying territorial dispute. The China-Global South Project similarly notes India continues to treat Beijing with caution in the security domain even as it normalizes economic engagement. Investors should read the September summit as confirmation of a durable, deliberate de-escalation track — not as a signal that structural India-China rivalry has been resolved.
The Bottom Line
The India-China thaw formalized at the New Delhi BRICS Summit represents a genuine, multi-year, deliberately sequenced de-politicization of economic relations between two of the world’s largest economies — but one that leaves core security and territorial disputes unresolved. For enterprise and investment strategists, the actionable signal is narrower than “US-China rapprochement” headlines suggest: watch FDI screening rules, pharmaceutical/electronics supply-chain diversification announcements, and border-trade resumption specifics, not broad geopolitical sentiment.
Discover more from The Economy
Subscribe to get the latest posts sent to your email.
Key Takeaways
- The US-China relationship in Q3 2026 is best described as a “tactical truce” — managed friction with both sides avoiding total decoupling, rather than a resolved trade relationship.
- The blended effective US tariff on Chinese imports stood around 33% as of May 2026, stacked across four separate legal layers, with some product categories (EVs, batteries, solar) clearing 145%.
- A Supreme Court ruling on February 20, 2026 found the President cannot use IEEPA to impose tariffs, forcing a pivot to Section 122 and Section 301 authorities — a significant legal constraint reshaping the tariff toolkit.
- Washington’s focus has shifted from tariff escalation toward structural supply chain revamps, including critical-minerals diplomacy with dozens of allied countries.
- US imports from China have fallen to near-2001 levels — the year China joined the WTO — reflecting one of the most significant trade reallocations in a generation.
From Escalation to “Managed Competition”
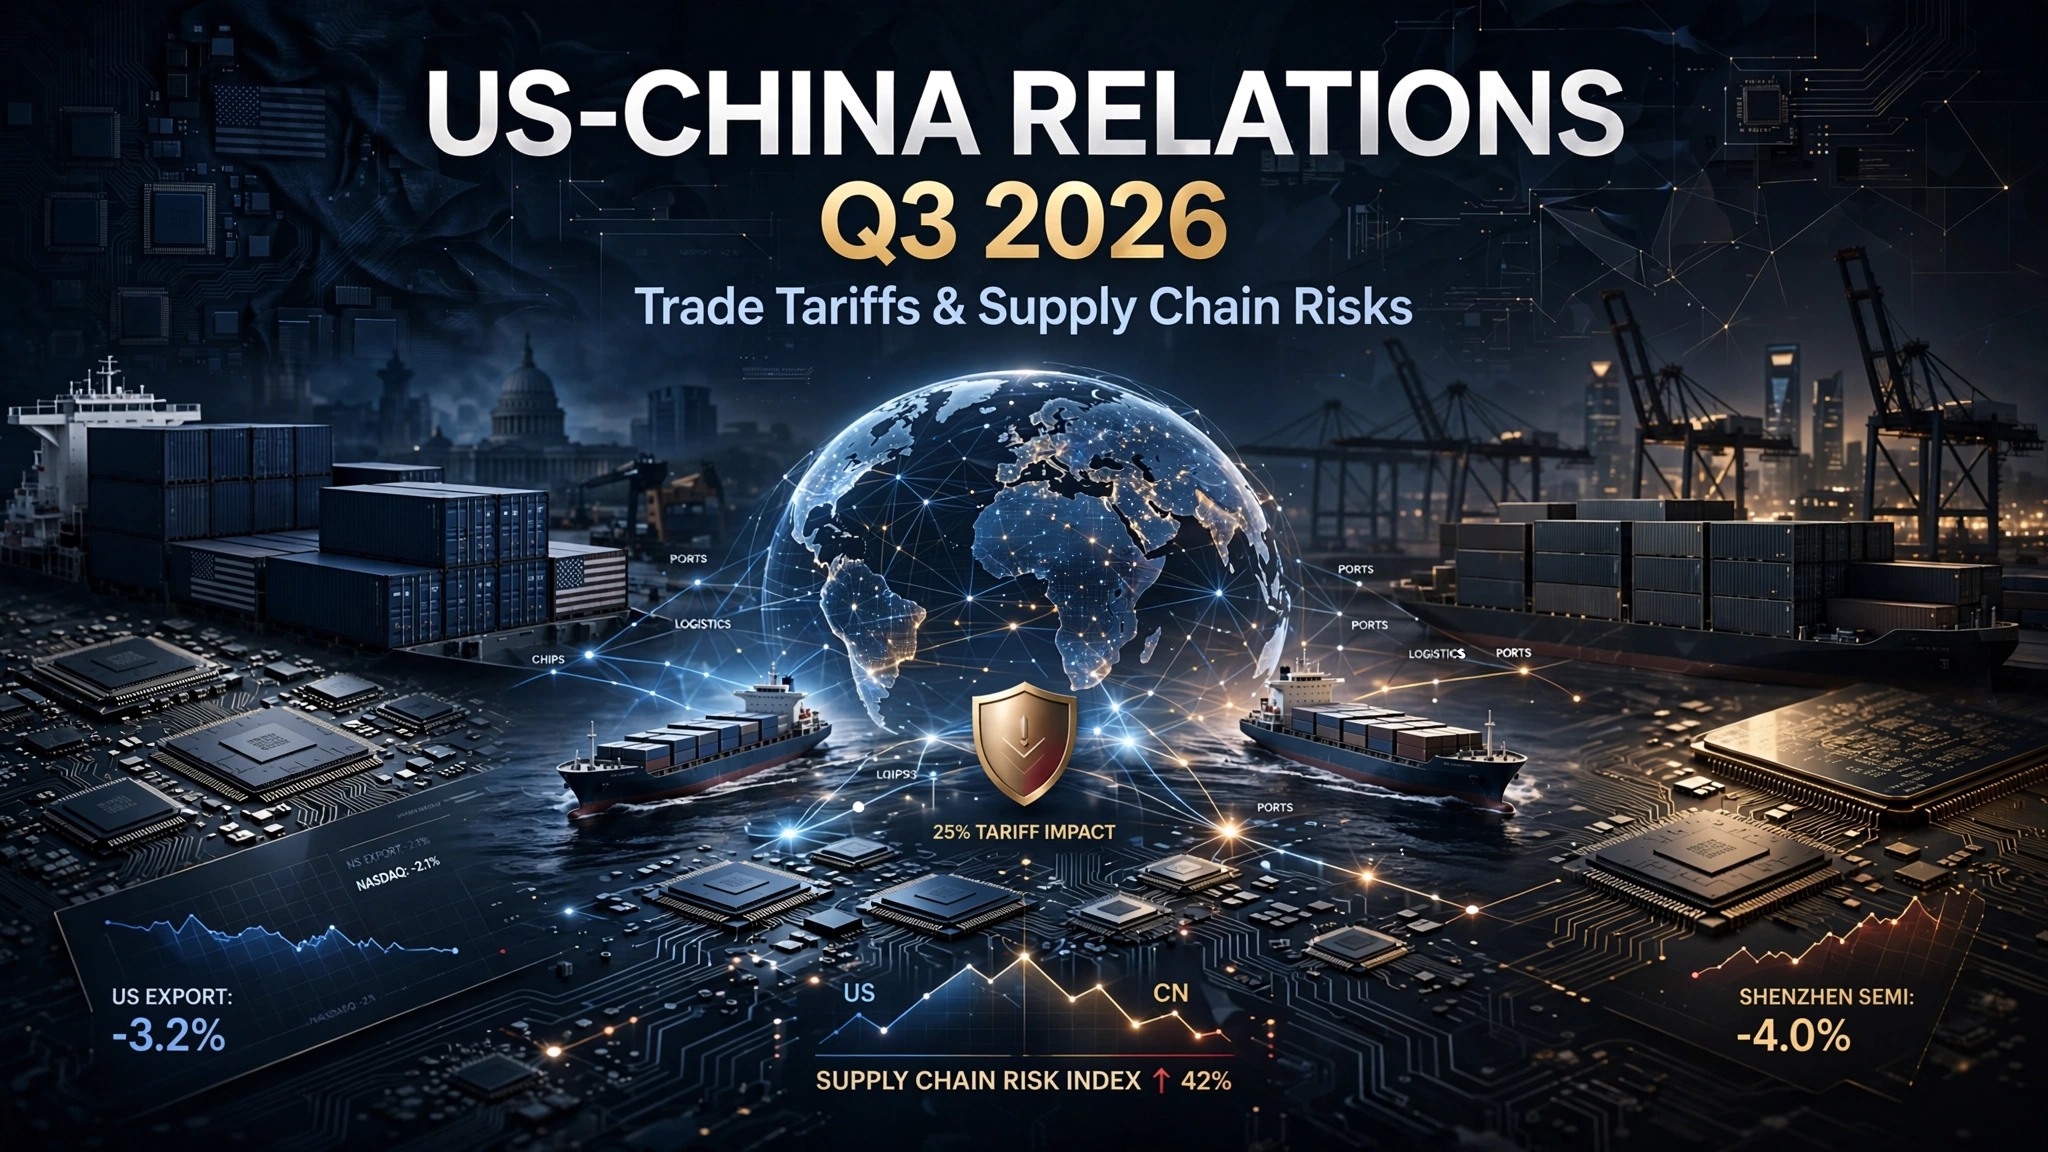
Q3 2026 finds the US-China relationship in a distinctly different posture than the tariff-escalation cycles of 2025. As of mid-2026, the US-China trade relationship is best described as a “tactical truce” — a state of managed friction where both nations maintain aggressive competitive postures while avoiding total economic decoupling. Unlike the optimistic expectations surrounding the 2020 Phase One agreement, today’s reality reflects a fundamental shift toward “de-risking” and “friend-shoring” strategies reshaping global logistics patterns.
That truce has institutional grounding. President Trump and President Xi Jinping appear to have maintained a fragile truce in the trade war following their May 2026 summit in Beijing, though experts say complete decoupling of the world’s two biggest economies remains unlikely, with high tariffs, rare earth restrictions, and tech export controls remaining major sticking points. The two leaders shared a vision of building “a constructive relationship of strategic stability” to bring enhanced certainty and predictability to the global economy — with the agreed approach to restore stability being “managed trade” through a board of trade to manage bilateral trade in non-sensitive goods, reduced tariff and non-tariff barriers in selective sectors, and Chinese commitments to purchase US aircraft and address US concerns about critical mineral supplies.
The Tariff Stack: Complex, Layered, and Legally Contested
Understanding the actual tariff burden on US-China trade in Q3 2026 requires unpacking a genuinely complex, multi-layered structure. The blended effective US tariff on Chinese imports stood around 33% in May 2026, stacked across four layers: MFN (~3.4%), Section 301 (7.5-25%), IEEPA fentanyl (20%), and the reciprocal tariff (currently 10% during a truce extension) — though some HS codes covering EVs, batteries, and solar clear 145%.
That legal architecture was upended mid-year by the judiciary. On February 20, 2026, the Supreme Court ruled that the President cannot use IEEPA to impose tariffs. President Trump subsequently lifted such tariffs and imposed a 10% global tariff for 150 days under Section 122 of the Trade Act instead. This ruling forced a structural pivot in how the administration constructs its China tariff policy — shifting weight toward Section 301 and Section 122 authorities, which carry different procedural and duration constraints than the IEEPA framework the administration had relied on.
The November 2025 Truce Framework Still Shapes Q3 2026
Under the trade agreement, the US halved the 20% fentanyl-related tariff to 10% and extended Section 301 tariff exclusions through November 2026, while China pledged to suspend retaliatory tariffs on US agricultural and food products. The US also agreed to suspend implementation of the new BIS “Affiliates Rule” for one year until November 9, 2026, and China agreed to “take appropriate measures” to resume semiconductor manufacturing and exports of legacy chips, suspending for one year its October 2025 export control measures on rare earth materials — though the status of its earlier April 2025 controls remains ambiguous.
That November 10, 2026 expiration date is the single most important near-term calendar event for anyone tracking US-China trade risk through Q3 and into Q4 2026 — nearly every major concession in the current truce is time-limited to that date.
The Structural Shift: From Tariffs to Supply Chain Architecture
The most consequential Q3 2026 development is not a new tariff announcement but a change in strategic focus. Washington has been steadily moving to revamp supply chains away from China — after taking US levies on China up past 100% at their peak, the administration’s efforts to reset the economic relationship have lately focused on a different set of tools. In early 2026, the United States convened dozens of countries and hosted two separate ministerial meetings on critical minerals, signalling that the policy centre of gravity has moved from bilateral tariff brinkmanship toward multilateral supply chain realignment.
The scale of the underlying reallocation is historically significant. The recalibration of supply chains has been so profound that US imports from China have returned to near-2001 levels — the year China entered the World Trade Organization — with research showing companies were already positioned to adjust to tariff levels well before the most recent escalations.
Comparative Table: US-China Trade Relationship, Late 2025 vs. Q3 2026
| Dimension | Late 2025 | Q3 2026 |
|---|---|---|
| Overall posture | Active tariff escalation | “Tactical truce” / managed competition |
| Primary tariff legal basis | IEEPA (executive emergency powers) | Section 122 / Section 301 (post-Supreme Court ruling) |
| Blended effective tariff rate | Higher, more volatile | ~33% (as of May 2026), layered across four mechanisms |
| Policy focus | Tariff rate negotiation | Critical-minerals diplomacy, supply chain diversification |
| US imports from China | Declining | Near 2001 (pre-WTO-accession-era) levels |
| Key expiration date to watch | N/A | November 9-10, 2026 (multiple truce provisions expire) |
Why It Matters: Sector-Specific Supply Chain Exposure
The blended tariff figures conceal enormous sector variation, and that variation is where the real corporate risk-management work lies. The technology sector has been hit hardest, with tariffs on components forcing abrupt sourcing shifts and catalysing a wave of investment in domestic fabrication, though dependence on Asian supply chains remains a persistent challenge. Automakers have been compelled to redesign supply routes, absorbing some extra costs via price adjustments while facing longer lead times and increased inventory holding that strain margins. Retailers in consumer goods and apparel have explored new sourcing from Bangladesh, India, and Central America, but price volatility and inconsistent quality control remain problematic.
For investors and supply chain planners, the practical takeaway is that “US-China trade risk” is no longer a single macro variable — it is a sector-specific, product-code-specific exposure that requires granular mapping rather than a single blended-tariff assumption.
What to Do Next
- Calendar the November 9-10, 2026 expiration dates explicitly — the Affiliates Rule suspension, Section 301 exclusions, and reciprocal tariff terms are all time-limited to this window, making it the highest-probability point for renewed volatility.
- Map exposure at the HS-code level, not the country level — with some categories facing 145% effective rates while the blended average sits near 33%, country-level tariff assumptions materially understate risk for EV, battery, and solar-linked supply chains.
- Track critical-minerals diplomacy as a leading indicator of the next phase of US trade strategy — the shift from tariff brinkmanship to allied-country mineral-supply coordination signals a more durable structural approach than tariff negotiation alone.
- Monitor the Supreme Court’s IEEPA ruling’s downstream effects on the administration’s remaining tariff toolkit, since Section 301 and Section 122 authorities carry different procedural constraints than the now-invalidated IEEPA approach.
- Treat “near-2001 levels” of US-China import volume as a durable baseline, not a cyclical dip — the scale of supply chain reallocation documented by Harvard Business School research suggests this is structural rather than temporary.
FAQ
What is the current effective tariff rate on Chinese imports to the US?
The blended effective US tariff on Chinese imports stood around 33% as of May 2026, stacked across four layers — MFN, Section 301, the IEEPA fentanyl tariff, and the reciprocal tariff — though specific categories like EVs, batteries, and solar can face rates as high as 145%.
Did the Supreme Court block Trump’s China tariffs?
Partially. On February 20, 2026, the Supreme Court ruled that the President cannot use the International Emergency Economic Powers Act to impose tariffs, prompting a shift to a 10% global tariff under Section 122 of the Trade Act instead. Section 301 tariffs, which rest on separate legal authority, remain largely intact.
When does the current US-China trade truce expire?
Multiple key provisions expire around the same date. The suspension of the BIS “Affiliates Rule” runs until November 9, 2026, and the suspension of heightened tariffs on Chinese imports is set to run until November 10, 2026 — making that window the most significant near-term risk point for the relationship.
Discover more from The Economy
Subscribe to get the latest posts sent to your email.
Key Takeaways
- GCC economies are projected to grow 4.6% in 2026, up from 4.1% in 2025, outpacing the broader MENA average, driven by early OPEC+ production-cut reversals and strong non-oil sector expansion.
- Emerging markets broadly are entering 2026 “from a position of renewed strength,” supported by a weakening US dollar, improving fundamentals, and broadening country and sector leadership beyond pure technology plays.
- Gulf equities and bonds staged a rapid, near-V-shaped recovery from the 2026 Middle East war shock, with MENA bonds recovering to within 1% of pre-war levels within weeks.
- India’s growth is expected to moderate only modestly, from above 7% in 2025 to roughly 6.4% in 2026 — still among the highest growth rates globally and a structural anchor for South Asian EM allocation.
- “South-South” capital flows — Asian and Gulf sovereign wealth capital investing directly into other emerging markets — are providing a new buffer against Western capital flight during shocks.
A Rebound Built on Genuine Fundamentals, Not Just Relief
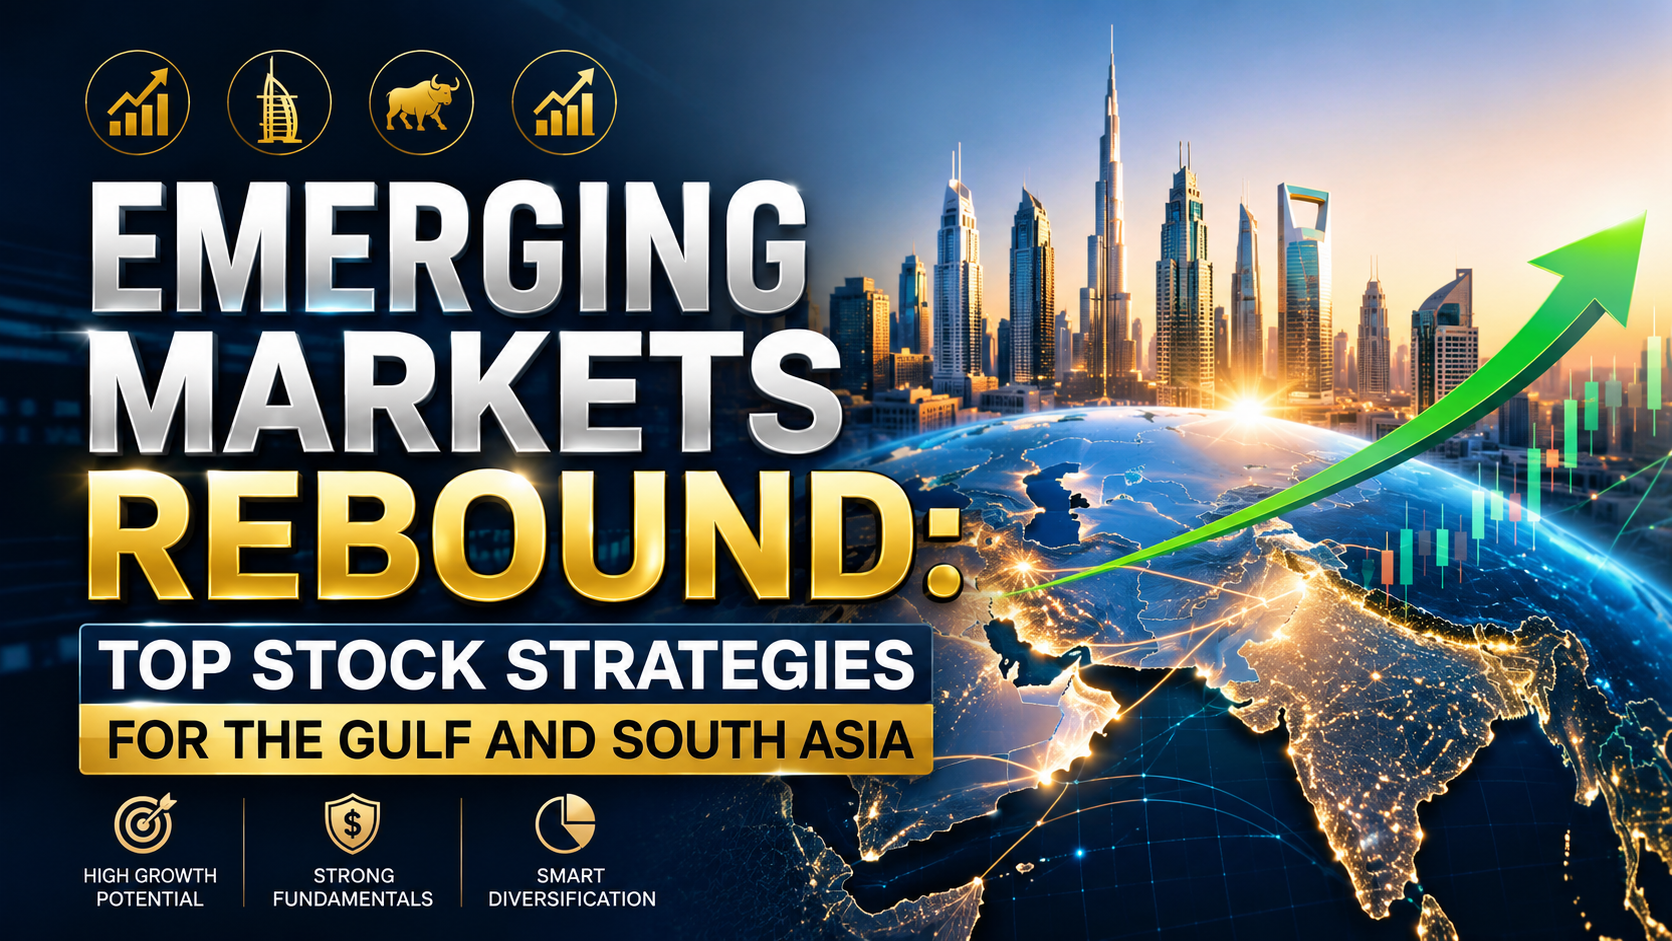
Unlike prior emerging-market rallies driven primarily by a weaker dollar or a single catalyst, the 2026 EM rebound rests on a broader fundamental base. Emerging markets equities enter 2026 supported by a weaker US dollar, improving fundamentals, and broad country and sector leadership — the opportunity set has broadened beyond technology, with durable growth drivers emerging across AI infrastructure, power, defence, healthcare, and advanced manufacturing. Improving macro conditions, narrowing valuation gaps, and still-light investor positioning suggest continued scope for capital reallocation toward high-quality EM companies across regions.
With global investor portfolios heavily concentrated in US mega-caps after years of leadership by a small number of very large companies, 2026 offers scope for EMs to play a more prominent role in portfolios — a softer US dollar, likely if the Federal Reserve cuts rates further, can further improve EM financial conditions and enhance returns through currency appreciation.
The Gulf: From Volatility to Recovery
The GCC’s 2026 story has been one of resilience under real stress rather than a smooth climb. Growth fundamentals were strong entering the year: the Gulf Cooperation Council is expected to grow 4.1% in 2025 and accelerate to 4.6% in 2026, a pace exceeding the broader MENA average, supported by early reversal of OPEC+ production cuts, with Saudi Arabia and the UAE — which hold most spare capacity — benefiting the most. Oil sector growth is forecast at 4.9% in 2025 and 6.0% in 2026, while non-oil sectors are expected to expand 4.0%.
That trajectory was tested directly by the Middle East war. Gulf equity markets rebounded after days of battering as oil retreated from a peak of nearly $120 a barrel following signals the Iran conflict might be resolving, with Dubai’s benchmark DFM General Index jumping over 3% in a single session and Dubai Islamic Bank up more than 7% after a prior sharp decline. The recovery proved durable rather than a brief relief bounce. By April, JPMorgan had raised its 2026 year-end S&P 500 target to 7,600 from 7,200, driven by stronger technology and AI sector expectations, with global risk appetite spilling over directly into emerging markets including the GCC and amplifying the regional rebound.
Fixed income told the same story of resilience. The Bloomberg USD Aggregate MENA Bond Index fell about 4% from late February to its March low, but has since recovered most of those losses to sit just 1% below its pre-war level — a near-V-shaped recovery consistent with the trajectory of other global risk assets, unsurprising given that regional fixed income is a high-quality segment of emerging markets.
IPO Market: The Missing Piece Finally Returning
After a disappointing 2025, when GCC IPO activity slipped to a four-year low with just 42 listings and total proceeds falling to $5.8 billion — the weakest showing in five years, down almost 55% from 2024 — the UAE is shaping up as the focal point of a GCC IPO revival in 2026, with a strong pipeline of large, diversified offerings expected to restore depth and confidence to regional equity markets. A returning IPO pipeline is often the clearest signal that institutional confidence, not just retail risk appetite, has genuinely returned to a market.
South Asia and Broader EM: Divergence Within Strength
Not every large emerging market is accelerating equally, and that divergence is the key allocation insight for 2026. Growth is likely to slow modestly in some of the largest EMs — particularly China, India, and Brazil — while others rebound after a difficult 2025. India’s GDP growth is likely to moderate from above 7% in 2025 to roughly 6.4% in 2026, still among the highest growth rates globally, while ASEAN economies, especially Vietnam, Malaysia, Indonesia, and the Philippines, have benefited from supply chain diversification and domestic demand resilience.
Markets such as India, Mexico, Indonesia, and parts of the Gulf stand to benefit from domestic demand strength and reform momentum, while East Asian tech-based economies — especially South Korea and Taiwan — remain indispensable to global technology supply chains, with a central axis of 2026 EM investing being the divergence between China and the rest of EM.
The Corporate Governance Tailwind
A less-covered but structurally important driver of the 2026 EM rally is a wave of shareholder-friendly corporate reform across Asia. A wave of regulatory-driven initiatives is reshaping corporate behaviour across Asia, aimed at improving profitability, boosting return on equity, and divesting non-core assets — Korea is a prime example, with at least 150 Korean companies since February 2024 having filed multi-year plans promising tighter capital discipline, bigger cash returns, and clearer growth stories, with similar programmes underway in China, Taiwan, and Southeast Asia. This governance-driven re-rating is a distinct and more durable return driver than commodity-price or currency tailwinds alone.
Comparative Table: 2026 Growth and Market Trajectories by Region
| Region/Market | 2025 Growth | 2026 Growth (Projected) | Key Driver |
|---|---|---|---|
| GCC (Gulf) | 4.1% | 4.6% | OPEC+ output reversal, non-oil diversification |
| India | >7% | ~6.4% | Still-elevated but moderating domestic demand |
| China | Slightly higher | Just under 5% | Exports offsetting housing drag |
| ASEAN (Vietnam, Malaysia, Indonesia, Philippines) | Resilient | Continued benefit | Supply chain diversification |
| South Korea/Taiwan | Strong | Central to AI/semiconductor supply chains | Global tech-cycle exposure |
Why It Matters: The South-South Capital Buffer
A structural shift worth flagging for risk assessment is the emergence of intra-EM capital flows as a genuine stabiliser during shocks. Increasing “South-South” investment — where cash flows from pools such as Asia’s growing wealth or deep-pocketed Gulf sovereign wealth funds — has provided a buffer for some economies, most notably Egypt, with such investors less likely to abandon emerging markets during stress: funds and excess capital being produced in Asia are increasingly being invested in other markets, marking a genuine shift in EM capital dynamics.
This matters directly for portfolio construction: EM assets that were once purely dependent on Western institutional flows — and therefore vulnerable to rapid Western risk-off sentiment — now have a second, structurally different capital source that behaves differently during a crisis.
What to Do Next
- Overweight GCC exposure selectively around the returning IPO pipeline — a deep, diversified 2026 UAE listing calendar is a genuine confidence signal, not just a cyclical oil-price story.
- Distinguish India’s moderation from a genuine slowdown — 6.4% growth remains among the highest globally and reflects normalisation from an unusually strong 2025, not structural weakness.
- Favour markets benefiting from supply chain diversification (Vietnam, Malaysia, Indonesia) as a distinct thesis from pure domestic-demand plays.
- Track Korean-style corporate governance reform as a repeatable, exportable template — similar shareholder-return programmes in China, Taiwan, and Southeast Asia could re-rate valuations independent of macro growth trends.
- Treat South-South capital flows as a genuine risk-reduction factor, not just a diversification footnote, when assessing which EM economies can weather the next geopolitical shock with less capital-flight risk.
FAQ
Are Gulf markets a good emerging-market investment after the 2026 Middle East war? The evidence suggests resilience rather than lasting damage. MENA bonds made a near-V-shaped recovery, ending within 1% of pre-war levels within weeks, and a strong 2026 GCC IPO pipeline, led by the UAE, signals restored institutional confidence following 2025’s four-year-low listing activity.
Is India still an attractive emerging-market growth story in 2026?
Yes, though growth is moderating from an unusually high base. India’s GDP growth is likely to moderate from above 7% in 2025 to roughly 6.4% in 2026 — still among the highest growth rates globally.
What is driving the broader 2026 emerging-markets rally beyond the usual dollar-weakness story?
A wave of shareholder-friendly corporate governance reform across Korea, China, Taiwan, and Southeast Asia — improving profitability, boosting return on equity, and driving capital discipline — is a structural driver distinct from currency or commodity tailwinds.
Discover more from The Economy
Subscribe to get the latest posts sent to your email.

AI-Powered Training: The Next Multi-Billion Dollar Ecosystem in Fitness

BRICS Summit 2026: Economic Implications of the India-China Diplomatic Thaw

Emerging Market Debt: The Ripple Effect of China’s Sovereign Refinancing Role

Dropping Oil & Surging Gold: Navigating Safe-Haven Investments in Q3

2026 AI Stock Frenzy: How to Position Your Portfolio

The AI Disruption in Financial Risk Management: Moving Beyond Record Banking Profits

The Rise of Green Aviation: Balancing High Fuel Prices with Sustainable Infrastructure

US-China Relations in Q3 2026: Trade Tariffs and Supply Chain Risks

Emerging Markets Rebound: Top Stock Strategies for the Gulf and South Asia

Tackling the 2026 Global Food Crisis: Policy Shifts and Market Speculation

Post-Quantum Encryption in Banking: The Next Frontier in Cybersecurity Investments

The Financial Cost of Sanctions: Afghanistan’s Economy 5 Years Under the Taliban

Supply Chain Fragmentation: 10 Trends Reshaping Global Trade This Year

The 2026 Aviation Boom: Investing in Airline Stocks as Passenger Traffic Surges

China Politburo July 2026: Stimulus Signals Explained

Russia Fuel Shortages 2026: Inside a Cracking War Economy

Top 15 Financial Stocks for Investment in PSX

State Farm’s $5B Dividend 2026: Who Qualifies & Payout Dates

Pakistan Passed Its Third IMF Review

SpaceX Stock Lockup Expiration Explained: Why $123B in Shares Could Hit the Market

Pakistan IMF Program 2026: Inside the Push Toward an Interest-Free Economy

Andy Burnham, UK Gilts and Mortgages: July 2026 Explainer

Russia Oil Revenue 2026: How Sanctions on Rosneft and Lukoil Are Draining the War Chest

Pakistan’s 2026 Monsoon Floods Threaten Fragile Economic Recovery as Inflation Nears 9%

Russia Oil Revenue 2026: The Iran War Windfall and What a Hormuz Deal Means for Moscow

Gold Price 2026: Why Bullion Has Fallen 25% From Its January Record High

Canada US Trade War 2026: Inside Carney’s Push to Cut Ties With Trump’s Tariffs

Russia’s Budget Deficit Blew Past Its Full-Year Target in Three Months
-

 Markets & Finance8 months ago
Top 15 Stocks for Investment in 2026 in PSX: Your Complete Guide to Pakistan’s Best Investment Opportunities
-

 Analysis6 months ago
Johor’s Investment Boom: The Hidden Costs Behind Malaysia’s Most Ambitious Economic Surge
-

 Analysis6 months ago
Top 10 Stocks for Investment in PSX for Quick Returns in 2026
-

 Analysis7 months ago
Brazil’s Rare Earth Race: US, EU, and China Compete for Critical Minerals as Tensions Rise
-

 Banks7 months ago
Best Investments in Pakistan 2026: Top 10 Low-Price Shares and Long-Term Picks for the PSX
-

 Investment8 months ago
Top 10 Mutual Fund Managers in Pakistan for Investment in 2026: A Comprehensive Guide for Optimal Returns
-

 Global Economy8 months ago
Pakistan’s Export Goldmine: 10 Game-Changing Markets Where Pakistani Businesses Are Winning Big in 2025
-

 Asia8 months ago
China’s 50% Domestic Equipment Rule: The Semiconductor Mandate Reshaping Global Tech