
Markets & Finance
JS-SEZ Master Plan 2026: Southeast Asia’s Boldest Economic Bet
The Johor-Singapore SEZ master plan is reshaping Southeast Asia’s tech map. Data centres, semiconductors, and the RTS Link are turning the JS-SEZ into 2026’s most compelling investment corridor.
There is a phrase that tends to get recycled at investment forums across Southeast Asia — the promise of a “win-win.” It rolls easily off the tongue and means almost nothing. So when Vinothan Tulisi, director of the Malaysian Investment Development Authority’s Singapore office, stood before a room of business leaders on April 13 and said, “We are not talking about a zero-sum game here,” you might have expected the usual polite scepticism. You would have been wrong.
The context was a dialogue jointly organised by the Singapore Press Club and the Johor Economic, Tourism and Cultural Office (Jetco) Singapore — a gathering convened to discuss the Johor-Singapore Special Economic Zone, or JS-SEZ. The topic was not just another bilateral handshake. The master plan for one of Asia’s most ambitious cross-border economic corridors is nearing public release, and the sectors generating the most heat — data centres and semiconductors — happen to be the same industries that geopolitics is frantically rewiring around the world.
This, as the bankers like to say, is not a coincidence.
What the JS-SEZ Master Plan Actually Says
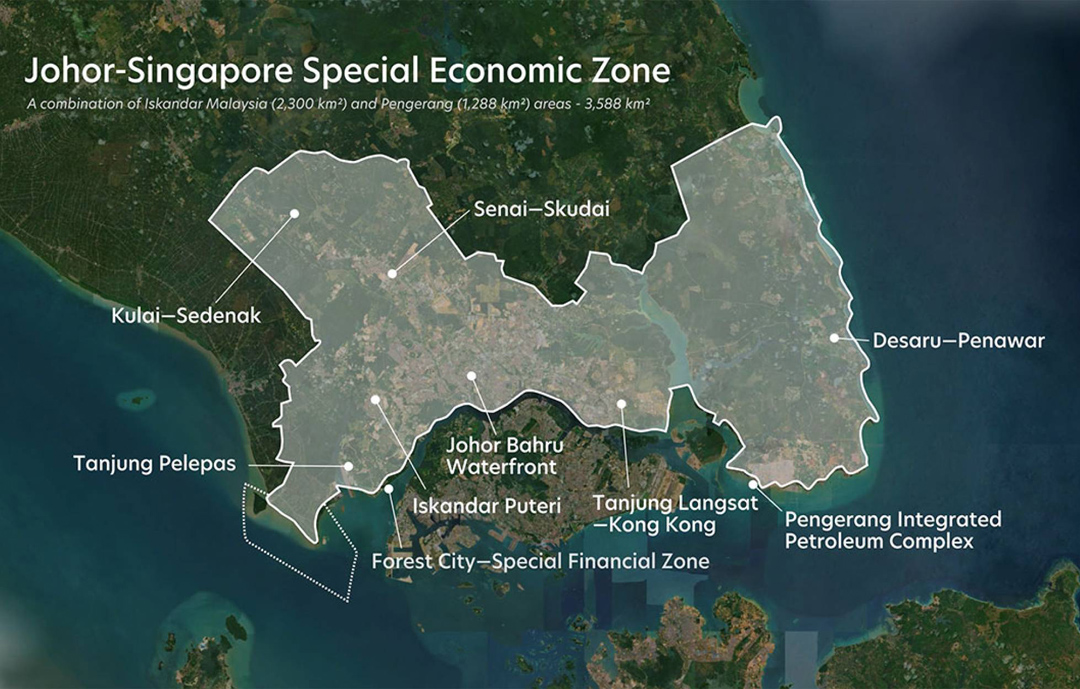
The JS-SEZ was formally signed on January 7, 2025, a bilateral agreement between Malaysia and Singapore to weave the southern Malaysian state of Johor into a seamless economic corridor with the city-state. The zone spans approximately 3,571 square kilometres — nearly five times the land area of Singapore itself — and targets accelerated growth across 11 key sectors, from advanced manufacturing and digital economy to logistics, green energy, and financial services.
The investment blueprint was launched on March 30, 2026 in Johor Bahru, the culmination of months of planning by Malaysia’s Ministry of Economy under Economy Minister Akmal Nasrullah Mohd Nasir. A more detailed master plan — the operational roadmap for all implementing parties — follows in parallel. The launch was originally scheduled for earlier in March, and the brief delay only sharpened the anticipation from investors watching closely from Hong Kong, Tokyo, Riyadh, and Silicon Valley.
The incentive architecture is striking. Companies qualifying under the JS-SEZ framework are eligible for a 5% corporate tax rate for up to 15 years in priority sectors including semiconductors, AI, medical devices, and advanced manufacturing. Knowledge workers who relocate to operate within the zone receive a 15% flat personal income tax rate for up to a decade — a figure designed explicitly to attract the Malaysian diaspora home from Singapore and to tempt expatriates who have long treated Johor as a dormitory suburb rather than a destination.
The application window runs until December 31, 2034. There is, in other words, real urgency to move.
Data Centres: The Sector That Started the Stampede
If any single industry has defined Johor’s transformation story over the past three years, it is data centres. As of late 2024, Johor hosts over 50 data centres, making it one of the largest concentrated hubs of digital infrastructure in all of Southeast Asia. Microsoft, Equinix, Princeton Digital Group, GDS International, ByteDance — these are not names that make speculative bets.
The arithmetic is straightforward. Singapore is land-constrained and power-hungry; data centre developers have been bumping against capacity ceilings in the city-state for years. Johor offers exactly what Singapore cannot: land priced at a fraction of Singapore’s rates, expanding power infrastructure, sufficient water resources, and — critically — fibre connectivity and proximity to Singapore’s subsea cable ecosystem. Rangu Salgame, CEO of Princeton Digital Group, captured the mood precisely when he told Fortune: “Johor is adding data centre capacity at a speed and scale I’ve not seen ever anywhere else.”
The JS-SEZ framework formalises and supercharges this dynamic. Under the bilateral agreement, companies can pursue what has been termed a “twinning” or “plus-one” strategy — maintaining high-value functions, client relationships, and financial operations in Singapore while building out the compute-heavy, land-intensive infrastructure in Johor. The SEZ makes that split operationally seamless in ways that previously required considerable regulatory navigation.
There are, however, friction points that the master plan must address candidly. In late 2025, Johor state authorities issued a temporary moratorium on new approvals for water-cooled data centres to protect local water supplies — a sensible constraint that nonetheless rattled investors who had been pencilling in aggressive build schedules. The pause is forcing a necessary technological pivot toward air-cooling and closed-loop liquid-cooling systems, aligning the region’s data infrastructure more closely with ESG requirements that institutional capital increasingly demands. It is a short-term headache that, managed well, could produce a greener, more sustainable data corridor than would otherwise have emerged.
Power grid strain is a related concern. Malaysia’s National Energy Transition Roadmap is integrating renewable energy commitments into the JS-SEZ framework, but AI-driven data centres are pushing global power demand up by roughly 20% annually, and Johor’s grid needs to keep pace. Early movers who lock in power capacity reservations now will be significantly advantaged.
Semiconductors: The Geopolitical Play
Here is where the JS-SEZ story gets genuinely interesting — and where the master plan’s strategic intelligence will be judged by history.
The global semiconductor supply chain is fracturing. What analysts at The Edge Malaysia have called the bifurcation into “Blue Silicon” and “Red Silicon” — a US-aligned and China-aligned chip world — is creating acute pressure on every country that has built its economic model on neutral, export-driven chip manufacturing. Malaysia currently handles approximately 13% of global chip assembly, testing, and packaging. Its semiconductor exports have surged — rising nearly 20% year-on-year between January 2025 and January 2026, with integrated circuits comprising 32% of total export value. That is both an extraordinary achievement and a vulnerability.
Prime Minister Anwar Ibrahim has framed Malaysia’s strategic position explicitly: the country offers a “neutral and non-aligned location” for companies that need to manufacture chips without being conscripted into one geopolitical bloc or another. Malaysia’s National Semiconductor Strategy targets a cumulative investment of RM500 billion (approximately US$118 billion), with RM25 billion in public support phased across multiple stages. By early 2025, more than RM63 billion in private investment had already been secured.
The JS-SEZ turbocharges this ambition by placing Johor — with its land, its lower-cost labour pool, and its direct connection to Singapore’s engineering talent and financial capital — at the centre of a cross-border semiconductor corridor. The zone’s cleanroom-ready industrial parks, including the 745-acre Sedenak Tech Park and the 509-acre Nusajaya Tech Park, are designed to support exactly the kind of controlled-environment manufacturing that chip assembly and advanced electronics require.
The risk, as several analysts have noted with considerable candour, is that Malaysia cannot simultaneously court US hyperscalers and deepen ties with Chinese chip firms without eventually being forced to choose. Washington’s scrutiny of technology transfer flows through ASEAN is intensifying. Johor’s data centre build-out has already attracted both American giants (Microsoft, Equinix) and Chinese players (ByteDance, GDS), operating in the same geography under what is currently a comfortable ambiguity. Whether that ambiguity remains comfortable through the remainder of this decade is, frankly, the most important geopolitical question the JS-SEZ master plan does not yet fully answer.
The RTS Link: Infrastructure as Economic Destiny
No honest account of the JS-SEZ can proceed without addressing the project that binds the entire vision together: the Johor Bahru–Singapore Rapid Transit System Link.
The RTS Link is a 4-kilometre rail shuttle connecting Bukit Chagar station in Johor Bahru with Woodlands North station in Singapore, with a journey time of approximately five minutes. By April 2026, the project has surged past 90% completion, with passenger operations targeted to commence by end-2026 and full launch by January 2027. The first driverless train arrived in Woodlands for demonstration on February 4, 2026, and the Land Transport Authority of Singapore has confirmed the project remains on schedule.
The system’s numbers are worth dwelling on. Peak capacity is 10,000 passengers per hour in each direction, with trains running every 3.6 minutes during peak periods. Expected daily ridership upon opening is 40,000 commuters — a figure projected to grow to 140,000 in the long term, absorbing at least 35% of the current human traffic at the Johor–Singapore Causeway, one of the world’s most congested land border crossings. Fares will be set between MYR 15.50 and MYR 21.70, or roughly S$5–S$7 per journey — affordable enough to make daily cross-border commuting a genuine lifestyle option, not an executive perk.
What the RTS Link does, in economic terms, is collapse the psychological distance between two cities that are physically separated by a single strait. Today, the Causeway crossing — jammed with lorries, motorcycles, and commuters — can take anywhere from 30 minutes to several hours. Five minutes changes everything. It allows a Singaporean engineer to live in Johor (where a three-bedroom condominium costs a fraction of its Singapore equivalent), work in a Johor-based manufacturing facility, and still attend a Friday evening client dinner in Singapore’s CBD. It enables a Johor-based SME to pitch investors in Singapore in the morning and be back at the factory floor by afternoon.
This is not theoretical. Singapore-based firms have already committed more than S$5.5 billion (approximately RM19 billion) to the JS-SEZ since the agreement was signed. Johor recorded RM27.4 billion in foreign direct investment in the first quarter of 2025 alone — an astonishing RM24 billion increase compared to the same period in 2024. The RTS Link, when it opens, will accelerate that trajectory further. Logistics operators, talent recruiters, and property developers are already pricing this in.
The Talent Gap: The Problem Nobody Wants to Discuss Loudly
There is a risk embedded in the JS-SEZ’s most optimistic projections that tends to be relegated to footnotes in investor presentations: talent shortages.
A Singapore Business Federation survey found that the majority of Singaporean companies citing difficulties in Johor named manpower challenges as their primary obstacle — specifically, problems with employment pass issuance and sourcing technically skilled workers. Johor’s population of 4.1 million is growing faster than Singapore’s, which is promising for future workforce depth. But the specialised skills required by semiconductor fabs, hyperscale data centres, and AI infrastructure simply cannot be conjured by policy decrees and tax incentives alone.
The Johor Talent Development Council (JTDC) has responded with “train and place” programmes specifically targeting the data centre and semiconductor sectors, aligning university and TVET outputs with investor needs. Malaysia has also launched an ASEAN Framework for Integrated Semiconductor Supply Chain (AFISS) to coordinate regional specialisation, with each member state playing a defined role. These are necessary and welcome initiatives. But the honest timeline for building a deep engineering talent base measured in years and cohorts, not quarters.
The 15% flat personal income tax for knowledge workers is an intelligent piece of the solution — a targeted offer to Singapore-resident Malaysians and regional expatriates to plant roots on the Johor side of the corridor. If the RTS Link makes the commute trivial, and the tax rate makes the economics compelling, the draw of Johor’s dramatically lower cost of living could make the talent equation work faster than sceptics anticipate. The Ibrahim Technopolis (IBTEC), a 7,300-acre innovation sandbox designed to be Asia’s largest, will be critical in anchoring this talent cluster through shared facilities and collaborative infrastructure for SMEs and multinationals alike.
A Complementary Ecosystem, Not a Rival One
The panellists at the April 13 Singapore Press Club dialogue kept returning to a concept that deserves to be the intellectual frame for the entire JS-SEZ project: complementarity. The zone works not because Johor is trying to replicate Singapore — that would be absurd — but because each side brings precisely what the other lacks.
Singapore contributes: world-class financial infrastructure, global legal and regulatory credibility, a deep pool of multinational corporate headquarters, sophisticated logistics operations, and unmatched connectivity to international capital markets. Johor contributes: four times Singapore’s land area, significantly lower operational costs (the median monthly wage in Johor remains roughly one-seventh of Singapore’s), an expanding energy grid, robust water resources, and room for the kind of industrial-scale infrastructure that simply cannot be built in a city-state of 728 square kilometres.
As Knight Frank Malaysia’s executive director Amy Wong Siew Fong observed, this proposition is compelling precisely because “both Malaysia and Singapore governments have demonstrated strong commitment to streamlined governance, transparency and collaboration” — giving investors the institutional confidence that the framework will not unravel under a change of government or a bilateral diplomatic temperature shift.
This bilateral maturity is itself underappreciated. Malaysia–Singapore relations have historically oscillated between warm cooperation and pointed friction over water agreements, airspace, and maritime boundaries. The fact that both governments have committed to a single transshipment permit system for land-based cargo (down from two), are rolling out QR code-based passport-free clearance at land checkpoints, and have jointly legislated the CIQ arrangements for the RTS Link — all signal an institutional seriousness that is genuinely new.
The SiJoRi Region and the Larger Vision
Zoom out far enough, and the JS-SEZ is one piece of a larger mosaic: the SiJoRi region — Singapore, Johor, and Riau Islands — a triangular economic zone that has been a concept since the 1990s but is only now acquiring the infrastructure and policy architecture to function as an integrated unit.
Nomura’s analysts wrote in December 2025 that they expect Malaysia’s economy to grow by 5.2% in 2026, driven in substantial part by JS-SEZ-related investment momentum. Malaysia captured 32% of Southeast Asia’s AI funding in recent years — a remarkable share for a country that the global tech press still largely associates with semiconductor assembly rather than frontier AI infrastructure.
If the master plan executes as designed, if the RTS Link delivers its passenger numbers, if the power grid keeps pace with data centre demand, and if the talent pipeline matures within five years rather than ten — the SiJoRi region has a credible claim to becoming Southeast Asia’s premier AI, semiconductor, and digital infrastructure corridor. Not the only one. Penang, Batam, and the Klang Valley all have serious ambitions. But the combination of bilateral institutional depth, geographic proximity to Singapore, and the sheer concentration of committed capital makes the Johor corridor distinctive.
The Verdict: Masterstroke, With Caveats
The JS-SEZ is not a magic wand. The master plan’s critics — and they are not wrong — point to execution risks that are real and stubborn: talent shortages that take a generation to address, power and water constraints that require infrastructure investment at a pace politics often struggles to sustain, regulatory alignment challenges across two sovereign systems with different legal traditions, and a geopolitical tightrope walk on semiconductors that could become dramatically less comfortable if US export control enforcement sharpens its focus on Malaysia.
But the critics tend to underestimate something equally real: the quality of the bilateral institutional commitment this time around. The RTS Link, nearly complete, is a physical manifestation of political will. The tax framework, legally anchored until 2034, provides the kind of certainty that long-term industrial investment demands. And the timing — with global chip supply chains scrambling for neutral, reliable geography amid the US-China technology cold war — is, for once, genuinely in Malaysia’s favour.
Vinothan Tulisi was right on April 13. This is not a zero-sum game. Done well, the JS-SEZ represents something Southeast Asia rarely produces: a bilateral economic relationship where both partners are structurally stronger together than apart, and where the geopolitical moment is aligned with their comparative advantages rather than working against them.
The master plan is on the table. The train is nearly ready. The capital is circling. What the SiJoRi region does with this convergence of factors — that is the story the next decade will tell.
Discover more from The Economy
Subscribe to get the latest posts sent to your email.


On July 15, 2026, during a routine Chinese foreign ministry press briefing, spokesperson comments took on unusual significance for global energy and trade watchers: Beijing strongly criticized recent US sanctions measures affecting Cuba and, more consequentially, proposed US legislation specifically targeting major purchasers of Russian energy, according to sanctions-tracking analysis from law firm Steptoe. The pairing of Cuba sanctions criticism with concern over Russian-energy-buyer legislation is not coincidental — both represent the kind of secondary sanctions architecture that could eventually be extended to reach China’s own energy trade.
Why China has reason to be worried
China has emerged as one of the largest buyers of discounted Russian crude since 2022, alongside India, as Moscow redirected exports away from European markets closed off by sanctions. That trading relationship has functioned largely outside direct US sanctions exposure because existing measures have focused on Russian entities, vessels, and price-cap compliance rather than directly penalizing the buying countries themselves. Proposed legislation targeting “major purchasers of Russian energy” would represent a meaningful escalation — shifting from supply-side sanctions on Russia to demand-side sanctions on Russia’s customers, a category in which China is unambiguously the largest player.
The broader sanctions context this fits into
This is not an isolated legislative proposal. The EU Council has separately been expanding its own sanctions lists to include entities active in Russia’s energy sector, specifically firms producing automated control systems for oil and gas infrastructure — a sector the EU explicitly identifies as a substantial source of Russian government revenue, with designated entities subject to asset freezes and travel bans. That EU action, combined with the US legislative proposal China is objecting to, suggests a coordinated Western push in mid-2026 toward tightening the demand side of Russian energy sanctions after several years of focusing primarily on supply-side measures — price caps, shipping insurance restrictions, and tanker interdiction — that CREA’s own monthly tracking has repeatedly shown to be only partially effective.
Why demand-side sanctions would be harder for China to absorb than supply-side measures
China’s exposure to a demand-side sanctions regime differs meaningfully from Russia’s own exposure to supply-side measures. Russia has adapted to supply-side sanctions through shadow-fleet shipping, price discounting, and using non-sanctioned intermediary buyers — mechanisms that work precisely because the penalty falls on specific vessels, entities, or transactions rather than on the buying country’s broader economy. A US measure targeting “major purchasers” as a category would be far harder for China to route around through the kind of intermediary and shadow-fleet workarounds Russia itself has relied on, since it would target China’s status as a buyer directly rather than any specific transaction or vessel.
The timing question: why July 2026 specifically
The proposed legislation surfaces at a moment when Russian oil revenues are themselves in flux — recovering somewhat due to the Iran-war-driven price spike after falling to some of their lowest levels since the 2022 invasion earlier in 2026. A US Congress moving to tighten sanctions on Russia’s energy customers at precisely the moment Iran-war-driven prices are already inflating Russian oil revenue suggests lawmakers are attempting to prevent Moscow’s accidental windfall from becoming a durable financing lifeline — a goal that requires closing the demand-side gap that has persisted throughout the supply-side sanctions era to date.
What China’s public criticism signals diplomatically
Beijing’s decision to criticize the proposal publicly, rather than simply lobbying against it through diplomatic channels, is itself a signal. Chinese foreign ministry statements on sanctions issues are typically measured and procedural; explicit public criticism paired with a separate objection to Cuba sanctions suggests Beijing is framing this as part of a broader pattern of what it characterizes as unilateral US extraterritorial sanctions overreach, a framing China has used consistently in disputes over technology export controls and is now extending to energy trade.
What comes next
The practical test will be whether the proposed legislation advances through Congress with enough bipartisan and administration support to become binding policy, or whether it remains a negotiating lever — a credible threat used to extract concessions from China on other fronts (trade, technology, Taiwan) without ever being formally enacted. Given the scale of China’s Russian energy imports and the diplomatic and economic disruption a genuine demand-side sanctions regime would cause, most sanctions analysts view near-term full enactment as unlikely, though the legislative threat itself already appears to be shaping Chinese diplomatic posture.
Discover more from The Economy
Subscribe to get the latest posts sent to your email.

Global oil markets are unwinding one of the sharpest supply shocks in decades as tanker traffic resumes through the Strait of Hormuz following a US-Iran memorandum of understanding, with the US Energy Information Administration sharply cutting its price forecasts even as a fresh flare-up of hostilities in early July underscored how fragile the de-escalation remains.
Prices Fall Fast From Their Peak
The Brent crude spot price averaged $85 per barrel in June, down $22 from May and a full $32 below the April 2026 peak, before falling below $70 a barrel on 1 July — roughly back to levels last seen when the conflict began in late February, according to the US Energy Information Administration’s July Short-Term Energy Outlook. The reversal followed a memorandum of understanding signed by the United States and Iran on 18 June to end hostilities and reopen the strait, which had been effectively closed since 28 February.
The EIA has responded by sharply revising its forecasts lower, now expecting Brent to average $74 a barrel in the third quarter of 2026 — $27 below its prior month’s forecast — with prices sliding further to an average of $65 in 2027 as continued inventory builds push the market into surplus. Crude oil output and trade flows are expected to return to near pre-conflict levels by year-end, with most shut-in production restored by early 2027.
Supply Rebounded Sharply, But Remains Below Pre-War Levels
Global oil supply rebounded by 4.1 million barrels per day to 98.8 million barrels per day in June as Gulf production partially recovered, though total output remained roughly 9.4 million barrels per day below pre-war levels, according to the International Energy Agency’s July Oil Market Report. Refined product cracks and margins surged to four-year highs in early July even as crude prices fell, reflecting continued tightness in refined fuel markets — a reminder that easing crude prices do not immediately translate into cheaper diesel or jet fuel.
A Chokepoint That Cannot Easily Be Replaced
The scale of what was briefly disrupted is difficult to overstate. Roughly a quarter of the world’s seaborne oil trade and nearly 20% of global liquefied natural gas trade normally passes through the 21-mile-wide strait, bound largely for major Asian economies including China, India, Japan, and South Korea, according to analysis published by the University of Wisconsin Law School. At the height of the disruption, tanker traffic through the strait plunged by roughly 90% as shippers suspended transit amid insurance withdrawals and direct Iranian threats to commercial vessels — a shutdown most Gulf producers other than Saudi Arabia and the UAE have no practical pipeline alternative to absorb.
Volatility Has Not Fully Disappeared
The recovery has not been linear. Brent crude jumped more than 4% in mid-July as the US and Iran traded fresh attacks over control of the waterway, extending a 9.6% two-day gain that pushed prices to a one-month high near $86 a barrel, according to Al Jazeera. That episode illustrated how quickly the market’s improved footing can reverse, and why analysts continue to flag the risk of renewed escalation as the single biggest wildcard for the second half of 2026.
Why This Matters Across Every Market
The oil-price swing has been the connective macro thread running through this year’s coverage of markets from the UK (where gilt yields spiked on energy-driven inflation fears) to Dubai (where trade and banking data have proven resilient despite renewed volatility) to Pakistan (where fuel and fertiliser costs have compounded flood-driven food inflation). The EIA’s downward price revision offers relief to energy-importing economies across Asia and Europe, but the events of early July are a reminder that the underlying geopolitical settlement remains fragile rather than final.
What to Watch
The EIA’s next Short-Term Energy Outlook, due 11 August, will be the first full month of data reflecting whether the June memorandum of understanding is holding or eroding. Markets will also be watching for any further flare-ups around the strait, as well as the pace at which shut-in Gulf production capacity is restored heading into 2027.
Discover more from The Economy
Subscribe to get the latest posts sent to your email.
Malaysia posted its biggest trade surplus on record and second-quarter GDP growth of 5.8% in 2026, yet its stock market has stubbornly refused to rally — a disconnect that is puzzling investors even as the country climbs global competitiveness rankings and hosts record investor turnout at its largest retail investing event.
Record Growth Meets a Muted Market
Malaysia’s economy expanded 5.8% year-on-year in the second quarter of 2026, underpinning what former senior investment banker Ian Yoong Kah Yin describes as one of the most competitive economies globally, buoyed by the country’s largest-ever trade surplus, according to reporting in The Star. Yet with the exception of the semiconductor and plantation sectors, Yoong notes that many shares on Bursa Malaysia remain undervalued relative to that underlying strength — a gap he summarised memorably: “It’s like we held a party and no one came.”
The disconnect comes even as Hong Leong Investment Bank upgraded Malaysia’s full-year 2026 growth forecast to 4.7% from 4.5%, citing stronger-than-expected performance in the electrical and electronics sector alongside resilient domestic demand, according to BusinessToday. Household loans grew 5.2% year-on-year and credit card spending rose 10.2%, signalling that consumer demand remains a genuine pillar of growth rather than a statistical artefact of export strength alone.
A Competitiveness Ranking Jump — and a Retail Investing Boom
Malaysia’s underlying reform story has been validated externally. The country climbed eight places to rank 15th among 70 economies in the 2026 IMD World Competitiveness Ranking, its best showing in recent years, following an 11-place jump the year before, according to The Star. Economists attribute the climb to policy reforms improving government and business efficiency, streamlined investment approvals, accelerated digitalisation, and stronger fiscal management.
Retail investor enthusiasm, meanwhile, appears robust even if institutional capital has been slower to follow. INVEST Fair 2026, Malaysia’s largest retail investment event, drew an expected 20,000 visitors across more than 70 hours of programming at Kuala Lumpur’s Mid Valley Exhibition Centre in July, according to event coverage on TradingView. Separately, a survey of more than 3,500 active users by digital wealth platform Versa found that 70% of respondents would prioritise investing over debt repayment or emergency savings if they received a sudden windfall, according to The Star — evidence of a pronounced retail “investment reflex” even amid broader questions about household financial resilience.
Fixed Income Is Where the Real Money Is Flowing
While equities lag, Malaysia’s fixed income market tells a different story. Employees Provident Fund chief investment officer Mohamad Hafiz Kassim told the Sasana Symposium 2026 that Malaysia is “punching above its weight” on global fixed income indexes, drawing outsized capital allocation given interest rate and yield differentials between Malaysian Government Securities and US Treasuries — a dynamic occurring even as the ringgit has remained notably stable, according to The Star. Speakers at the same event pointed to the broader global shift toward passive investing as a structural tailwind Malaysia is well-positioned to capture with continued policy follow-through.
What Explains the Equity Gap
Analysts point to several possible explanations for the growth-market disconnect: persistent foreign investor caution tied to regional and Middle East-driven geopolitical risk, a valuation overhang from prior years, and sector concentration that leaves broad indices under-exposed to the semiconductor and technology names actually capturing AI-linked investment flows. Whatever the cause, the gap represents either an opportunity for value-focused investors or a warning sign that Malaysia’s headline growth figures are not yet translating into corporate earnings momentum broad enough to move the market.
What to Watch
The second half of 2026 will test whether Malaysia’s fixed income strength and competitiveness gains eventually pull equity valuations upward, or whether the stock market’s caution proves to be the more accurate signal about underlying corporate health. Continued data centre and semiconductor investment, alongside any further IMD-style competitiveness validation, will be key catalysts to track.
Discover more from The Economy
Subscribe to get the latest posts sent to your email.

Pakistan’s $10bn US Facility Request: Inside the New Gulf Capital Triangle

China Criticizes US Bill Targeting Russian Oil Buyers — Why It Matters

Nvidia’s H200 Chips Are Finally Reaching China — In Numbers Too Small to Matter Yet

Oil Prices Fall as Strait of Hormuz Reopens: 2026 Update

Malaysia GDP Growth vs Stock Market: The 2026 Disconnect

Singapore MAS Tightens Policy as GDP Growth Hits 5.7%

Fed Holds Rates Under Warsh as Trump Rolls Out New Tariffs

Indonesia Financial Hub 2026: Can It Rival Singapore, Dubai?

Russia Fuel Shortages 2026: Inside a Cracking War Economy

China Politburo July 2026: Stimulus Signals Explained

Andy Burnham, UK Gilts and Mortgages: July 2026 Explainer

Pakistan’s 2026 Monsoon Floods Threaten Fragile Economic Recovery as Inflation Nears 9%

Pakistan Gulf Investment Outflows 2026: Peace Deal Stakes Explained

Canada Trade Diversification 2026: China, Indonesia, UAE Deals Explained

AI Bubble Warning 2026: Why BIS, IMF and Bank of England Fear a Market Crash

Russia Bans Diesel Exports 2026: Global Fuel Market Impact Explained

Gold Price Forecast 2026: Fed’s July 29 Decision and Record Central Bank Buying Explained

Strait of Hormuz Blockade 2026: Oil Prices Surge 9% as US-Iran Conflict Reignites

Private Credit Warning: Most BDCs Turn Unprofitable in 2026, Reuters Finds

IMF Cuts Pakistan Growth Forecast, Raises Inflation to 8.4%

Gulf Capital Retreat From Pakistan 2026: UAE Loan Freeze & What It Means

Strait of Hormuz 2026: Why Markets Still Don’t Trust It’s Open

Down But Not Out: Inside the Slow Sinking of Russia’s War Economy

Chipmakers Just Lost 6.7% in Two Days: Inside the Great AI Trade Rotation

Pakistan Economy 2026: GDP Grows 3.7% as IMF Completes EFF Review Amid Middle East Risk

Pakistan IMF Deal 2026: Third Review Cleared, Budget 2026-27 and Inflation Outlook

US Jobs Report July 2026: Why Weak Payrolls Sent the Dow to a Record High

Global Stock Market Selloff 2026: Stagflation Fears Return as Iran Conflict Reignites
-

 Markets & Finance7 months ago
Top 15 Stocks for Investment in 2026 in PSX: Your Complete Guide to Pakistan’s Best Investment Opportunities
-

 Analysis5 months ago
Johor’s Investment Boom: The Hidden Costs Behind Malaysia’s Most Ambitious Economic Surge
-

 Analysis5 months ago
Top 10 Stocks for Investment in PSX for Quick Returns in 2026
-

 Analysis6 months ago
Brazil’s Rare Earth Race: US, EU, and China Compete for Critical Minerals as Tensions Rise
-

 Banks6 months ago
Best Investments in Pakistan 2026: Top 10 Low-Price Shares and Long-Term Picks for the PSX
-

 Investment7 months ago
Top 10 Mutual Fund Managers in Pakistan for Investment in 2026: A Comprehensive Guide for Optimal Returns
-

 Global Economy7 months ago
15 Most Lucrative Sectors for Investment in Pakistan: A 2025 Data-Driven Analysis
-

 Global Economy7 months ago
Pakistan’s Export Goldmine: 10 Game-Changing Markets Where Pakistani Businesses Are Winning Big in 2025