
Opinion
Oil Prices Soar Above $100 a Barrel. This Time, the World Changes With Them.

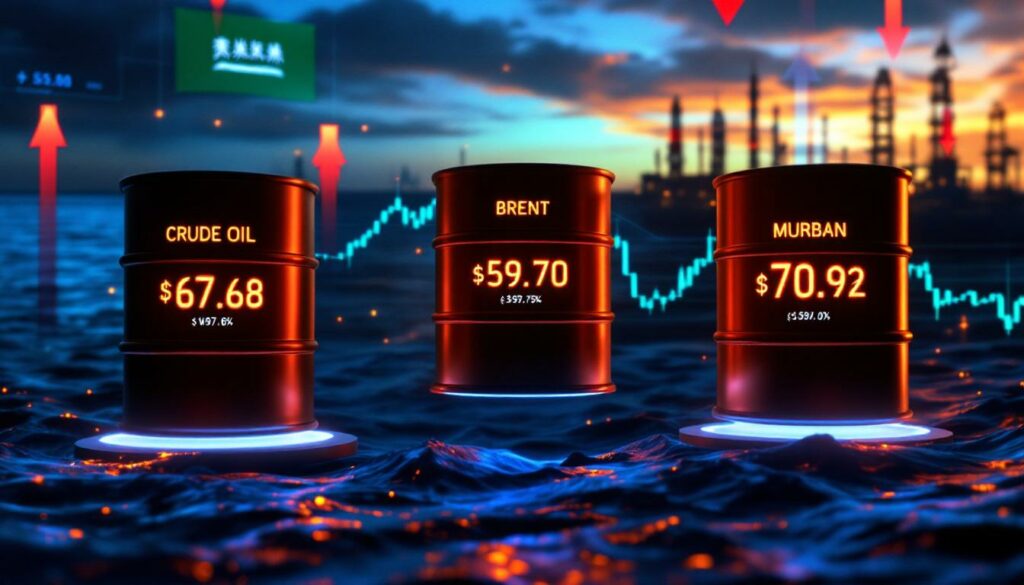
Live Prices — April 13, 2026
| Benchmark | Price | Change |
|---|---|---|
| Brent Crude | $102.80 | ▲ +7.98% |
| WTI | $104.88 | ▲ +8.61% |
| U.S. Gas (avg) | $4.12/gal | ▲ +38% since Feb. |
| Hormuz Traffic | 17 ships/day | ▼ vs. 130 pre-war |
As Brent crude clears $102 and WTI tops $104 in a single Monday session, the U.S. Navy prepares to blockade Iranian ports and a fragile ceasefire teeters on collapse. This is not a price spike. It is a civilisational stress test — and the global economy is failing it.
On the morning of April 13, 2026, the global economy received a message written in the price of crude oil. WTI futures for May delivery vaulted nearly 8% to $104.04 a barrel while Brent, the international benchmark, rose above $102 — the third time in six weeks that oil prices have soared above $100 a barrel. The catalyst was grimly familiar by now: the collapse of U.S.-Iran peace negotiations in Islamabad and President Donald Trump’s announcement that the U.S. Navy would begin blockading all maritime traffic entering or leaving Iranian ports, effective 10 a.m. Eastern Time. It was an extraordinary escalation. It was also, in many ways, entirely predictable.
What is not predictable — what no model, no spreadsheet, and no geopolitical risk matrix has successfully priced — is how long this goes on, how far it spreads, and what kind of global economy emerges on the other side. This is not just another oil price spike. The 1973 Arab oil embargo, the 1979 Iranian Revolution, the Gulf War shocks of 1990: historians will one day place the 2026 Hormuz Crisis in the same catalogue of civilisational economic ruptures. The difference is that this time, the chokepoint has not just been threatened — it has been functionally closed for six weeks, and the world’s largest naval power is now formally blockading it from both ends.
KEY FIGURES
- +55% — Brent crude rise since the Iran war began on Feb. 28, 2026
- 17 — Ships transiting Hormuz on Saturday, vs. 130+ daily pre-war
- $119 — Brent peak reached in early April 2026
- 30% — Goldman Sachs-estimated U.S. recession probability, up from 20%
The Anatomy of the Largest Oil Supply Disruption in History
The numbers are almost surreal in their severity. Before the U.S.-Israeli strikes on Iran began on February 28, the Strait of Hormuz — a 21-mile-wide channel between Iran and Oman — handled roughly 25% of the world’s seaborne oil and 20% of its LNG. More than 130 vessels transited daily. That flow has been reduced to a trickle. On Saturday, April 12, only 17 ships made the passage, according to maritime analytics firm Windward. The International Energy Agency has called the current disruption the largest supply shock in the history of the global oil market — a statement it does not make lightly. Production losses in the Middle East have been running at roughly 11 million barrels per day, with Goldman Sachs analysts warning they could peak at 17 million before any recovery begins.
Iran has not simply blockaded the strait — it has monetised it. Tehran began charging tolls of up to $2 million per ship for passage, a sovereign toll road carved from one of humanity’s most critical energy arteries. Oil industry executives have been lobbying Washington frantically to reject any deal that concedes Iran’s de facto control of the waterway. The Revolutionary Guards have warned that military vessels approaching the strait will be “dealt with harshly and decisively.” Iran’s Supreme Leader advisor Ali Akbar Velayati put it bluntly: the “key to the Strait of Hormuz” remains in Tehran’s hands.
And then came Sunday. After marathon talks in Islamabad collapsed — Vice President JD Vance citing Iran’s failure to provide “an affirmative commitment” to forgo nuclear weapons — President Trump posted to social media announcing a full naval blockade of Iranian ports. U.S. Central Command clarified the scope: all vessels from all nations, entering or leaving Iranian ports on the Arabian Gulf and Gulf of Oman, would be interdicted beginning Monday morning. Markets, already frayed, buckled immediately.
“Transit through the Strait of Hormuz remains restricted, coordinated, and selectively enforced. There has been no return to open commercial navigation.”
— Windward Maritime Intelligence, April 2026
Why Oil Prices Above $100 a Barrel Are Different This Time
Context, always context. When Brent crossed $100 in 2008, it was on the back of a commodity supercycle and voracious pre-crisis demand. When it briefly touched triple digits again in 2011 and 2022, those spikes were bounded by recoverable circumstances — Libyan disruption here, Russian invasion there. What defines the current oil price surge in 2026 is the combination of three factors that have never simultaneously aligned in the modern era: a total physical closure of the world’s most critical maritime chokepoint, an active military confrontation between the United States and Iran, and a global economy already weakened by years of tightening monetary policy and tariff escalation.
The physical-versus-paper market divergence alone should unnerve policymakers. While Brent futures trade around $102 this morning, physical crude barrels for immediate delivery have been trading at record premiums of approximately $150 a barrel in some grades. That is not a market in orderly price discovery. That is a market screaming that actual oil — the kind you put in a tanker, refine, and burn — is becoming genuinely scarce in ways that paper futures cannot fully capture.
Major Oil Supply Shocks: A Historical Comparison
| Event | Year | Peak Price Surge | Duration | % of Global Supply Affected |
|---|---|---|---|---|
| Arab Oil Embargo | 1973 | ~+400% (over 12 months) | ~5 months | ~7–9% |
| Iranian Revolution | 1979 | ~+150% | ~12 months | ~4% |
| Gulf War (Kuwait invasion) | 1990 | ~+130% | ~6 months | ~5% |
| Russia-Ukraine War | 2022 | ~+80% (Brent peak ~$139) | ~4 months peak | ~8–10% |
| 2026 Hormuz Crisis | 2026 | +55% in 6 weeks; Brent from $70 → $119 peak | Ongoing | ~20%+ (Hormuz total) |
The Economic Impact of Oil Over $100: A Global Reckoning
The cascade effects of sustained oil prices above $100 a barrel are no longer theoretical. They are unfolding in real time, and the transmission mechanisms differ sharply by geography.
The United States: Inflation, the Fed, and the $4-a-Gallon Problem
American motorists are paying an average of $4.12 per gallon at the pump — up 38% since the war began in late February. For a country where gasoline pricing is a leading indicator of presidential approval ratings, this creates an acute political problem for an administration that launched the military campaign in the first place. Goldman Sachs has raised its 12-month U.S. recession probability to 30%, up from 20% before the conflict began, and elevated its 2026 inflation forecast to roughly 3% — a figure that would make the Federal Reserve’s dual mandate look increasingly unachievable. The Fed now faces its least comfortable scenario: a supply-driven inflationary shock paired with slowing growth, a stagflationary bind that rate tools are poorly designed to address.
Europe: An Energy Crisis Stacked on an Energy Crisis
For Europe, the timing could scarcely be worse. The continent entered 2026 with gas storage at roughly 30% capacity following a harsh winter, and its dependence on Qatari LNG — which transits Hormuz — has proved a fatal vulnerability. Dutch TTF gas benchmarks nearly doubled to over €60/MWh by mid-March, while the European Central Bank postponed its planned rate reductions on March 19, raising its inflation forecast and cutting GDP projections simultaneously. The ECB now warns of stagflation for energy-dependent economies; UK inflation is expected to breach 5% this year. Germany and Italy — the continent’s industrial engines — face the real possibility of technical recession by year-end, with chemical and steel manufacturers already imposing surcharges of up to 30% on industrial customers.
Asia: The Quiet Crisis
Asia’s exposure is less discussed but arguably more profound. In 2024, an estimated 84% of crude flowing through Hormuz was destined for Asian markets. China, which receives a third of its oil via the strait, has been accumulating reserves and strategically holding its hand — but even a billion barrels of reserve buys only a few months of supply at normal consumption rates. India has dispatched destroyers to escort tankers, launching Operation Sankalp to evacuate Indian-flagged LPG carriers from the Gulf of Oman. Japan and South Korea, overwhelmingly dependent on Middle Eastern crude, have activated emergency reserve release programs. The ASEAN economies are, in the IMF’s language, experiencing a severe “terms-of-trade shock” that is accelerating currency depreciation and eroding import capacity across the region simultaneously.
Goldman Sachs and the Anatomy of a $120 Scenario
No institution has been more forensic in its scenario modelling than Goldman Sachs, and its language has grown progressively more alarming. In a note carried by Bloomberg last Thursday, Goldman warned that if the Strait of Hormuz remains mostly shut for another month, Brent would average above $100 per barrel for the remainder of 2026 — with Q3 averaging $120 and Q4 at $115. The bank’s lead commodity analyst Daan Struyven described the situation as “fluid,” which, in the measured language of Wall Street research, reads as genuinely alarming.
Wood Mackenzie’s analysis is blunter still: if Brent averages $100 per barrel in 2026, global economic growth slows to 1.7%, down from the pre-war forecast of 2.5%. At $200 oil — a figure that was science fiction six weeks ago and is now a tail risk in Barclays’ scenario models — global recession becomes mathematically inevitable, with the world economy contracting by approximately 0.5%. The most chilling detail in the Goldman note is the observation that even after the Strait reopens, oil prices will not fall quickly back to pre-war levels. The shock has forced markets to permanently reprice the geopolitical risk premium embedded in Persian Gulf production concentration. That repricing is already baked into long-dated oil forwards.
“If a resolution to the war proves unachievable, we expect Brent to trade upwards again, with higher prices and demand destruction ultimately balancing the market.”
— Wood Mackenzie Energy Analysts, April 2026
The Geopolitical Oil Crisis: Strait of Hormuz as the New Berlin Wall
There is a structural argument buried beneath the daily price moves that deserves serious attention, because it will outlast whatever ceasefire or deal eventually materialises. The Strait of Hormuz has always been the world’s single greatest energy chokepoint — a geographic accident that turned a narrow Persian Gulf passage into the jugular vein of the global industrial economy. What the 2026 crisis has done is demonstrate, for the first time at full operational scale, exactly how catastrophic its closure actually is. Energy planners and policymakers have long known this intellectually. They now know it viscerally, with $4-a-gallon gasoline and rationing notices.
The strategic consequences will be generational. Every major oil-importing nation is now conducting emergency reviews of its energy supply diversification posture. The U.S. shale industry — constrained in the near term to roughly 1.5 million additional barrels per day — will receive a decade of investment incentives. Saudi Arabia and the UAE, which have limited alternative pipeline capacity via Yanbu and Fujairah respectively (a combined ceiling of roughly 9 million barrels per day against Hormuz’s normal 20 million), will face enormous pressure to expand redundant infrastructure. The energy transition, already turbocharged by post-pandemic economics, now has a third accelerant: geopolitical necessity. When a single authoritarian government can threaten to collapse the global economy by closing a 21-mile strait, the case for renewable energy independence ceases to be an environmental argument. It becomes a national security imperative.
What Comes Next: Three Scenarios for the Oil Price Outlook
Markets are, at their core, probability machines. And right now, the probability distributions on oil price scenarios have never been wider or more consequential. Three plausible trajectories present themselves.
Scenario 1 — Negotiated resolution (base case, narrowing): The blockade and counter-blockade create sufficient economic pain on both sides — Iranian export revenues collapse while U.S. domestic inflation becomes a serious political liability — to force a resumption of talks. A deal that includes Iranian nuclear concessions and a Hormuz reopening could see Brent retreat toward $80–$85 by year-end, consistent with Goldman’s conditional base case. The window for this scenario is closing fast.
Scenario 2 — Frozen stalemate (elevated probability): The ceasefire technically holds but the Strait remains in Iran’s supervised pause — open to some nations, closed to others, with tolls, IRGC escorts, and constant threat of escalation. Oil prices trade in a $95–$115 range for the remainder of the year. Global growth slows to around 2%, the Fed and ECB remain paralysed between inflation and recession. This is the slow bleed scenario, and arguably the most likely.
Scenario 3 — Escalation (tail risk, but priced insufficiently): Limited U.S. strikes on Iran, which the Wall Street Journal reported Trump is actively considering, trigger Iranian retaliation against Gulf production infrastructure. Brent tests $150 or higher. Global recession is not a tail risk — it is a base case. The physical crude market, already pricing some grades at $150, would simply catch up to what it already knows.
A Final Word on What $100 Oil Actually Means
There is a tendency in financial commentary to treat $100-a-barrel oil as a number — a round, symbolic threshold that triggers algorithmic reactions and attention-grabbing headlines. But it is worth sitting with what it actually represents. Every barrel of oil that costs $104 instead of $70 is a transfer of wealth from oil-importing nations — from the factories of Germany, the commuters of Manila, the farmers of Brazil who depend on Hormuz-transited fertilizers — to a geopolitical conflict that most of the world’s population did not choose and cannot control.
The IEA has called this the largest oil supply disruption in the history of the global market. That distinction matters. Every previous shock eventually resolved — through diplomacy, demand destruction, technological substitution, or simple exhaustion. This one will too. But the world that emerges from the 2026 Hormuz crisis will be structurally different from the one that entered it: more fragmented in its energy supply chains, more accelerated in its renewable transition, more alert to the terrifying leverage embedded in a 21-mile waterway that sits entirely within Iranian territorial reach.
When they write the history of how the world finally, truly moved beyond its dependence on Middle Eastern oil, the chapter title may well be: April 2026.
Discover more from The Economy
Subscribe to get the latest posts sent to your email.


Two of the world’s most authoritative economic institutions have published starkly different verdicts on the global economy in 2026 — and the gap between them tells you more about the state of the world than either number alone. The IMF’s most recent projection puts global growth at 3.0% for 2026. The World Bank, using a different methodology and a more pessimistic read on the Middle East war’s fallout, puts the same year at 2.5% — the weakest rate since the COVID-19 pandemic. Understanding why these two numbers diverge is essential for anyone allocating capital across the world’s largest economies in the second half of 2026.
The IMF’s Case: Resilience Interrupted, Not Broken
The IMF entered 2026 with genuine optimism. Its January 2026 World Economic Outlook Update projected 3.3% global growth for the year — a small upward revision from October 2025 — crediting technology investment, fiscal and monetary support, and private-sector adaptability for offsetting ongoing trade-policy disruption.
The outbreak of war in the Middle East on February 28 forced a rapid downward revision. The April 2026 World Economic Outlook, titled pointedly “Global Economy in the Shadow of War,” cut the 2026 forecast to 3.1%, warning that a longer or broader conflict, a reassessment of AI-driven productivity expectations, or renewed trade tensions could weaken growth significantly further. By the July 2026 update, the figure had settled at 3.0% for 2026, rising to 3.4% in 2027 — a forecast the IMF frames as “broadly unchanged cumulatively” from April, arguing that AI-driven demand lifting technology-integrated economies is offsetting the war’s drag on energy importers.
IMF global growth revisions through 2026:
| Report Date | 2026 Projection | 2027 Projection | Key Framing |
|---|---|---|---|
| January 2026 | 3.3% | 3.2% | “Steady amid Divergent Forces” |
| April 2026 | 3.1% | 3.2% | “Shadow of War” |
| July 2026 | 3.0% | 3.4% | “Crosscurrents of War and Technology” |
The World Bank’s Case: The Weakest Growth Since COVID
The World Bank’s Global Economic Prospects report tells a more sobering story. Its June 2026 edition cut global growth to 2.5% for 2026, down from 2.9% in 2025 — explicitly the lowest rate since the onset of the COVID-19 pandemic. Forecasts for two-thirds of the world’s economies were downgraded relative to the World Bank’s own January 2026 report, which had initially projected 2.6% growth for the year.
World Bank Group Chief Economist Indermit Gill did not mince words in the report’s foreword, warning per the World Bank’s own press release that the 2020s remain on track to be the weakest decade for global growth since the 1960s, and that “virtually half of all developing economies have failed since 2019 to advance on the most rudimentary promise of development: narrowing the income gap with the world’s most prosperous economies.”
World Bank global growth revisions:
| Report Date | 2026 Projection | Context |
|---|---|---|
| January 2026 | 2.6% | Up from June 2025 forecast, driven by U.S. strength |
| June 2026 | 2.5% | Lowest since COVID-19; Middle East war impact |
| 2027 (June forecast) | 2.8% | Still 0.4pp below 2010s average |
Why the Numbers Don’t Match: Methodology, Not Disagreement on Facts
The roughly half-a-percentage-point gap between the IMF’s 3.0% and the World Bank’s 2.5% is not really a disagreement about the war’s severity — both institutions cite the same core shock. It reflects different weighting of technology-driven offsetting growth versus energy-importer drag, and different treatment of emerging-market vulnerability. The World Bank’s framing emphasizes that growth in low-income countries (LICs) is expected to reach 5.4% in 2026, 0.3 percentage points lower than previous forecasts specifically because of the conflict, with real per-capita GDP growth across LICs averaging only about 2.7% through 2026–28 — insufficient, in the Bank’s own assessment, to meaningfully reduce poverty.
Breaking Down the Big Economies
Both institutions converge more closely at the country level than at the global aggregate, which is instructive for investors trying to translate the headline debate into portfolio decisions.
2026 growth projections by major economy/bloc:
| Economy/Bloc | Projection | Source |
|---|---|---|
| United States | 2.2%–2.4% | World Bank (2.2%) / IMF (2.4%) |
| Advanced economies (aggregate) | 1.7%–1.8% | IMF |
| GCC states | 4.4% | World Bank |
| MENAP region (incl. Pakistan) | 3.6% | World Bank |
| Low-income countries | 5.4% | World Bank / IMF |
| Global (IMF) | 3.0% | IMF, July 2026 |
| Global (World Bank) | 2.5% | World Bank, June 2026 |
The United States is the one major economy where both institutions agree growth is holding up better than expected, with the World Bank crediting the U.S. for roughly two-thirds of its own upward revision to global growth back in January — before the war reversed some of that optimism. Gulf Cooperation Council economies are the other standout, benefiting directly from elevated oil prices even as the same conflict drags down oil-importing peers.
Inflation: The Shared Warning
Both reports converge on inflation risk. The IMF’s April 2026 outlook explicitly modeled inflation rising to 4.4% globally under its reference war scenario, a sharp reversal from the disinflation trend of 2024–25. The World Bank similarly flagged that headline inflation expectations have risen broadly across emerging markets and developing economies, with local-currency bond yields and external spreads remaining elevated in commodity-importing nations specifically because of the conflict’s pass-through to energy and food costs.
What This Means for Asset Allocation
The practical takeaway from the IMF-World Bank gap is that “global growth” is now a genuinely bimodal concept in 2026: technology-exposed and energy-exporting economies are outperforming, while energy-importing emerging markets and low-income countries are absorbing a disproportionate share of the war-driven slowdown. A portfolio built around a single “global growth” assumption risks missing this bifurcation entirely — the more useful lens for 2026 is regional and sectoral, not aggregate.
Final Verdict
The IMF’s 3.0% and the World Bank’s 2.5% are not competing predictions so much as two honest readings of the same uncertain war-affected environment, filtered through different modeling emphasis. What both institutions agree on matters more than where they diverge: growth in 2026 is meaningfully weaker than it would have been absent the Middle East conflict, inflation risk has returned after two years of disinflation, and the burden of the shock is falling disproportionately on energy-importing emerging markets rather than being evenly distributed. Investors and policymakers should treat both the 3.0% and 2.5% figures as bookends of a realistic range rather than seeking a single “correct” number — and should watch the IMF’s next scheduled update for whether the numbers converge toward the optimistic or pessimistic end as the war’s duration becomes clearer.
Discover more from The Economy
Subscribe to get the latest posts sent to your email.
Six months into the war between the United States, Israel, and Iran, one pattern has become unmistakable to energy traders: every reported ceasefire has been followed, sooner or later, by a fresh escalation. What started as a limited conflict on February 28, 2026, has evolved into the most disruptive geopolitical shock to global oil supply since Russia’s invasion of Ukraine — and as of September 2026, it is still actively reshaping energy markets, shipping routes, and inflation forecasts worldwide.
The Ceasefire-and-Relapse Cycle
The conflict has produced at least three distinct ceasefire announcements since February, and none has held for more than a few weeks. In April 2026, a US-Iran arrangement briefly reopened the Strait of Hormuz and sent oil plunging below $100 a barrel, as reported by Euronews. Gold, which had surged as a safe haven, still traded near $4,750 an ounce that same week as investors openly doubted the truce would last, according to Trading Economics — key disputes remained unresolved and the Strait stayed effectively closed even after the announcement.
That skepticism proved warranted. By September 2026, oil had round-tripped decisively higher. Brent crude surpassed $100 a barrel for the first time in nearly six weeks after fresh attacks on oil facilities and tankers, settling at $97.89 before jumping 2.4% to $100.29, with WTI gaining to $94.77, according to reporting carried by the Washington Times. The proximate trigger: the U.S. military struck five Iranian tankers in response to attempted missile attacks on a Navy warship, while Iranian-backed Houthi forces ignited fires at Saudi Arabian oil facilities.
Oil price trajectory during the conflict:
| Date | Brent Crude | Context |
|---|---|---|
| Mar 21, 2026 | ~$106.77 | Fifth straight weekly gain amid escalation |
| Mar 20, 2026 | Forecast warning of $180+ | Saudi Aramco officials warned WSJ of extreme scenario |
| Apr 8, 2026 | Below $100 | Ceasefire announcement, Strait reopening pledge |
| Sept 7, 2026 | $97.31 | Six-week high; Iran vows to strike energy infrastructure |
| Sept 9, 2026 | $100.29 | Attacks on tankers and Saudi refineries |
| Sept 11, 2026 | ~$100, +9% week | Diplomatic talks announced on Hormuz shipping |
Why the Strait of Hormuz Is the Real Story
The Strait of Hormuz is the fulcrum of this entire crisis. Roughly 20% of the world’s oil supply passes through this chokepoint, including about half of Asia’s oil imports and a quarter of its LNG imports, according to TD Economics. Since the war began, fighting has halted most shipping through the strait, and — critically — markets have stopped believing repeated U.S. government proclamations that reopening is imminent. As one energy analyst told Marketplace, “The Strait of Hormuz won’t be what it was before. Now, we understand that Iran can and will block it.”
The physical impact on trade flows has been severe. Oil shipments out of the Middle East are running roughly 65% below year-ago levels, and the cost of shipping crude to Asia on the largest tankers has hit a record high, per the same Marketplace reporting. The United Arab Emirates has responded by actively building alternative export routes and trade corridors to avoid having its energy exports “held hostage” by the conflict, a senior UAE presidential adviser confirmed to Reuters in early September.
Demand Destruction Is Now the Dominant Theme
While supply disruption drove the initial price spike, the market’s focus by September 2026 has shifted decisively toward demand destruction. The International Energy Agency sharply lowered its 2026 global oil demand outlook, forecasting a contraction of 2.5 million barrels per day — the largest annual decline since the COVID-19 pandemic — as higher prices and tighter supply weigh on consumption, according to Trading Economics. OPEC has cut its own demand-growth forecast for a fifth consecutive month. Both organizations now agree that sustained triple-digit oil is actively destroying the demand it was created by.
OPEC+ itself has opted for caution rather than aggressive supply response, keeping its October output policy unchanged at its early-September meeting, pending agreement on new quotas before any further steps, Reuters reported.
The Inflation and Consumer Pass-Through
The war’s inflationary impact has already shown up in hard data. U.S. gasoline prices surged in March 2026 to an EIA-reported average of $3.638 per gallon, the highest since September 2023, with AAA data showing the national average briefly topping $4.02 per gallon — a monthly jump described by Trading Economics as exceeding even the spikes following Hurricane Katrina and Russia’s 2022 invasion of Ukraine. Euro-area inflation jumped to 2.5% in the same window, well above the European Central Bank’s 2% target, driven almost entirely by the energy component.
Who is most exposed:
| Category | Exposure | Why |
|---|---|---|
| Asian oil importers (Japan, India, Pakistan, China) | Very high | ~50% of Asia’s oil, 25% of LNG via Hormuz |
| European energy consumers | High | Already strained post-Russia diversification |
| Gulf oil exporters (Saudi, UAE, Qatar) | Mixed | Higher prices offset by direct attack risk on infrastructure |
| U.S. consumers | Moderate-high | Domestic production buffers some but not all of the shock |
| Global shipping/logistics | High | Record tanker rates, rerouting costs |
Diplomatic Off-Ramps Being Tested
The most significant near-term catalyst for de-escalation is the diplomatic track around Strait of Hormuz shipping management. Top diplomats from the six-member Gulf Cooperation Council were scheduled to meet their Iranian counterpart to negotiate a possible temporary arrangement for managing transit through the strait, according to Trading Economics. Iranian state media separately indicated Tehran would meet Gulf states in Oman for related talks. Markets have priced in modest optimism around these talks — crude paused its rally and settled near $100 on the news — but given the track record of failed ceasefires since February, traders are treating any de-escalation as tactical rather than durable until physical shipping data confirms a sustained reopening.
Final Verdict
The “ceasefire economics” of the 2026 Middle East war have proven to be a recurring, not a resolving, phenomenon: each truce has produced a short-lived relief rally in oil and a corresponding dip in inflation expectations, followed by renewed escalation that erases the gains. As of September 2026, Brent and WTI sit near six-week highs above $90–100, the Strait of Hormuz remains functionally impaired, and both the IEA and OPEC now forecast the sharpest demand contraction since the pandemic. For investors and policymakers, the actionable conclusion is that oil-price volatility itself — not a stable higher or lower price level — is the defining condition of this market, and near-term direction hinges almost entirely on whether the current Gulf-Iran diplomatic track produces a verifiable, physically confirmed reopening of shipping lanes rather than another rhetorical ceasefire.
Discover more from The Economy
Subscribe to get the latest posts sent to your email.
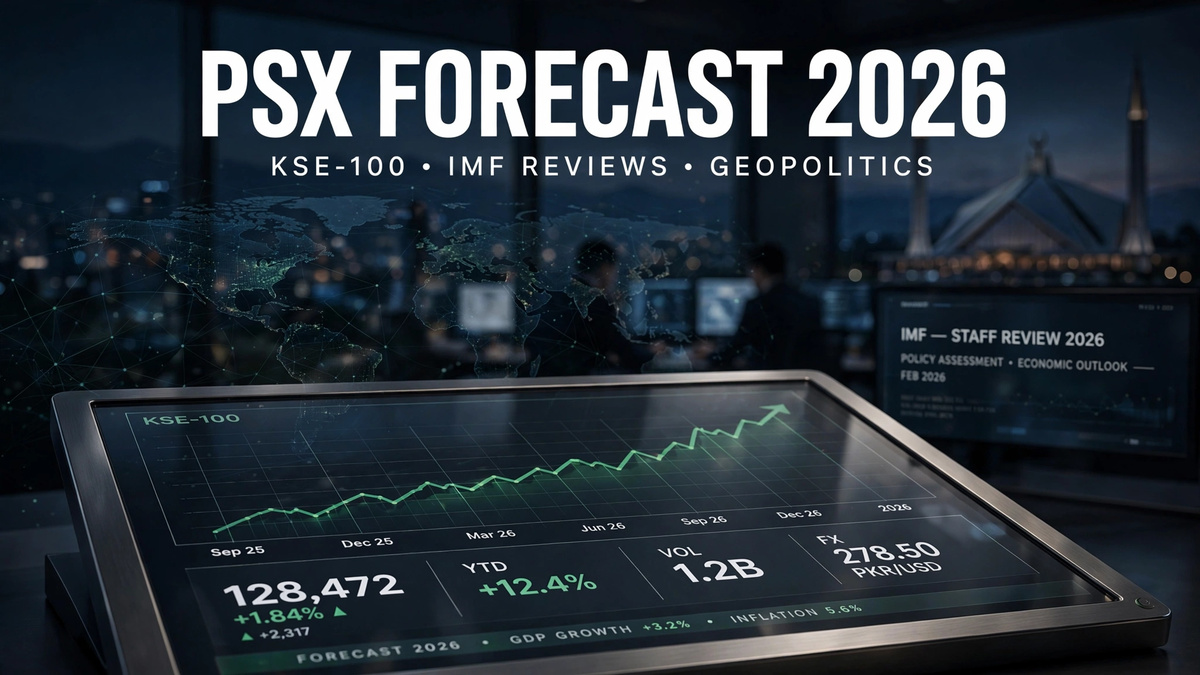
The KSE-100 Index just delivered its third consecutive year as the best-performing major asset class available to Pakistani investors — a 44% rupee-terms gain in FY2026 that outpaced gold, real estate, and fixed income. Yet the same index spent the back half of that fiscal year lurching between rallies triggered by IMF tranche approvals and sell-offs triggered by missile strikes 2,000 kilometers away. For domestic and expat investors weighing exposure to Pakistan’s frontier equity market, the story of 2026 is a tug-of-war between genuine macroeconomic reform and a regional war that keeps interrupting it.
FY26 in Numbers: A Historic Rally, Delivered in Two Very Different Halves
The KSE-100 closed FY2026 (ended June 30) at 180,302 points, a 44% gain in rupee terms and 46% in U.S. dollar terms, according to year-end reports from AKD Research and Topline Securities cited by Profit Pakistan Today. Stack that on top of FY24 and FY25, and the index has delivered a cumulative 335% return in rupee terms — 347% in dollar terms — over three straight years, driven by policy continuity, macroeconomic stabilization, record trading volumes, and Pakistan’s return to international debt markets.
But the FY26 rally was not a straight line. As Business Recorder reported, the first half of FY26 (July–December 2025) delivered a 39% gain, driven by improving economic indicators despite flood-related disruptions. The second half turned sharply volatile: the index touched an intra-period high of 189,167 on January 23, 2026, before the outbreak of the Middle East war in late February triggered a sustained bout of selling that erased much of the gain before a partial recovery into fiscal year-end.
KSE-100 FY26 timeline:
| Period | Level/Move | Driver |
|---|---|---|
| H1 FY26 (Jul–Dec 2025) | +39% | Macro stability, IMF program progress |
| Jan 23, 2026 | Intra-period high: 189,167 | Pre-war peak |
| Feb 28, 2026 | War begins | Middle East conflict onset |
| April 2026 | +14,251 points (+9.6%) to 162,994 | US–Iran ceasefire optimism (short-lived) |
| May 2026 | IMF approves $1.2bn tranche (May 8) | Sentiment recovery |
| June 30, 2026 (FY26 close) | 180,302 | Full-year: +44% |
| September 2026 | ~170,000–171,000 range | Renewed oil shock, Houthi attacks on Saudi facilities |
The IMF Program: Pakistan’s Structural Anchor
Unlike prior boom-bust cycles on the PSX, the FY26 rally has an institutional anchor: Pakistan’s ongoing IMF Extended Fund Facility (EFF) and Resilience and Sustainability Facility (RSF) programs. Pakistan cleared its second and third EFF/RSF reviews in December 2025 and May 2026 respectively, unlocking total disbursements of roughly $4.8 billion, according to Profit Pakistan Today’s FY26 wrap-up.
The next test is imminent. An IMF staff mission was expected to arrive in Pakistan around September 23, 2026, to conduct the fourth EFF review and third RSF review, covering the $7 billion EFF and $1.4 billion RSF programs, according to the Express Tribune. For FY27, the IMF has set an underlying primary balance target of 2% of GDP and an FBR tax revenue target of Rs15.3 trillion — both of which will be closely watched by the market as proxies for continued program compliance.
Pakistan’s external buffers have also strengthened materially. Total liquid foreign exchange reserves rose 5.3% week-on-week to $23.7 billion as of early September 2026, with State Bank of Pakistan reserves at $18.3 billion, pushing import cover up to 2.74 months from 2.56 months, per Tribune reporting. Remittances have been an unsung support: workers’ remittances hit a record $4.3 billion in May 2026, helping the rupee and easing external-account pressure even as the trade balance absorbed a higher energy import bill.
Geopolitics: The Recurring Interruption
Every rally attempt on the PSX in 2026 has been vulnerable to the same external shock: Middle East oil-price spikes. AKD Research’s own commentary has been explicit that “a constructive resolution to ongoing geopolitical tensions remains the key near-term catalyst for direction, with any easing in oil prices expected to trigger a recovery,” as noted in Profit Pakistan Today’s May 2026 outlook.
That pattern has persisted into September. As of the most recent trading sessions, Houthi assaults on Saudi energy facilities pushed crude oil prices higher, weighing directly on investor sentiment on the PSX, according to the Express Tribune’s latest market wrap. A six-member Gulf Cooperation Council bloc was reported to be considering direct talks with Iranian officials over the future of the Strait of Hormuz — a diplomatic track that, if successful, would be the single biggest near-term catalyst for a PSX re-rating, given how tightly correlated the index has become to global crude benchmarks.
Valuation and 2026 Targets
Despite the rally, brokerages continue to argue Pakistani equities remain undervalued relative to history. The KSE-100 was trading at a price-to-earnings ratio of roughly 6.9x as of April 2026, against a longer-run historical average closer to 8.0x, according to AKD Research commentary cited by Profit Pakistan Today.
Brokerage KSE-100 targets for December 2026:
| Brokerage | Target Level | Implied Framing |
|---|---|---|
| Topline Securities | 203,000 | Base case, ~13% total return from mid-2026 levels |
| AKD Research | 263,800 | Bull case, contingent on sustained reform and oil relief |
| Trading Economics (conservative model) | 155,000–156,000 | Short-term stability scenario |
Sector-level positioning matters as much as the index target. Banking (UBL, HBL, Meezan Bank), oil and gas exploration (OGDC, PPL), fertilizers, and cement have been flagged repeatedly by local brokerages as the highest-upside sectors heading into FY27, benefiting respectively from a still-elevated (though easing) policy rate, higher global energy prices, and continued infrastructure and construction demand.
Final Verdict
The KSE-100’s FY26 performance confirms that Pakistan’s macro reform story — anchored in a credible, disbursing IMF program, strengthening FX reserves, and record remittance inflows — is real and durable. But 2026 has also demonstrated that the index’s near-term direction is now a leveraged bet on Middle East de-escalation as much as on domestic policy execution. For frontier-market investors, the base case remains constructive: single-digit trailing P/E multiples, an IMF anchor into FY27, and a currency backed by improving reserves argue for continued exposure. The tactical risk to monitor closely is the September 23 IMF mission outcome and any material escalation around the Strait of Hormuz, either of which could swing the index by double-digit percentages within weeks.
Discover more from The Economy
Subscribe to get the latest posts sent to your email.

Crypto Daily Outlook: Bitcoin, Altcoins, and the Future of Decentralized Finance

Anthony Scaramucci’s Crypto Prediction: Why MicroStrategy’s Move Is Bitcoin’s “iPhone Moment”

Best Dividend Stocks 2026: European & Asian Blue Chips

World Bank & IMF Reports 2026: Why the “3% Growth” Consensus Is Actually a Debate

Elon Musk’s Boring Company Hits $23B Valuation After UAE-Led $3 Billion Series D

Middle East War Economics 2026: Oil Prices & Energy Markets

PSX Forecast 2026: KSE-100, IMF Reviews & Geopolitics

Asian Markets Outlook 2026: China, Japan & Singapore Stocks

Global Economy 2026: IMF Growth, Inflation & Private Credit

Current Account Deficit (CAD) : Causes and Impact

Balance of Payments (BOP)

The Falkland Islands Dispute: Sovereign Wealth, Offshore Drilling, and Market Impacts

Gross Domestic Product (GDP): Nominal vs. Real

What is Inflation and the Consumer Price Index (CPI)?

State Farm’s $5B Dividend 2026: Who Qualifies & Payout Dates

US-China Relations in Q3 2026: Trade Tariffs and Supply Chain Risks

Gold’s Wild 2026: From a Record $5,600 Peak to a 24% Crash and Back Toward $4,500

Oil Surges as Strait of Hormuz Traffic Collapses Again

The Rocket That Won’t Quit: Inside SpaceX’s Falcon 9 Launch Machine

Bank of England Set to Hold Rates Through Year-End, Reuters Poll Shows

SpaceX Starship Flight 14: First Orbital Attempt & Starlink V3 Launch Explained

The 2026 Crypto Regulatory Shift: What It Means for Institutional Investors

AI Chip Stocks 2026: The Best Semiconductor Investments Beyond Marvell

Retail Earnings Week: What Home Depot, Target & Walmart Reveal

AI-Powered Training: The Next Multi-Billion Dollar Ecosystem in Fitness

Top 30 Stocks for Investment in PSX for Massive ROI in 2026

Russia’s Black Sea Oil Exports Fall for a Fifth Straight Week

Tween Back-to-School Trends 2026: What’s Driving the $85B Season
-

 Markets & Finance8 months ago
Top 15 Stocks for Investment in 2026 in PSX: Your Complete Guide to Pakistan’s Best Investment Opportunities
-

 Analysis7 months ago
Johor’s Investment Boom: The Hidden Costs Behind Malaysia’s Most Ambitious Economic Surge
-

 Analysis7 months ago
Top 10 Stocks for Investment in PSX for Quick Returns in 2026
-

 Analysis7 months ago
Brazil’s Rare Earth Race: US, EU, and China Compete for Critical Minerals as Tensions Rise
-

 Banks8 months ago
Best Investments in Pakistan 2026: Top 10 Low-Price Shares and Long-Term Picks for the PSX
-

 Investment8 months ago
Top 10 Mutual Fund Managers in Pakistan for Investment in 2026: A Comprehensive Guide for Optimal Returns
-

 Global Economy9 months ago
15 Most Lucrative Sectors for Investment in Pakistan: A 2025 Data-Driven Analysis
-

 Global Economy9 months ago
Pakistan’s Export Goldmine: 10 Game-Changing Markets Where Pakistani Businesses Are Winning Big in 2025