
Analysis
Alabama Is Powering Its Startup Boom Through Community and Investment

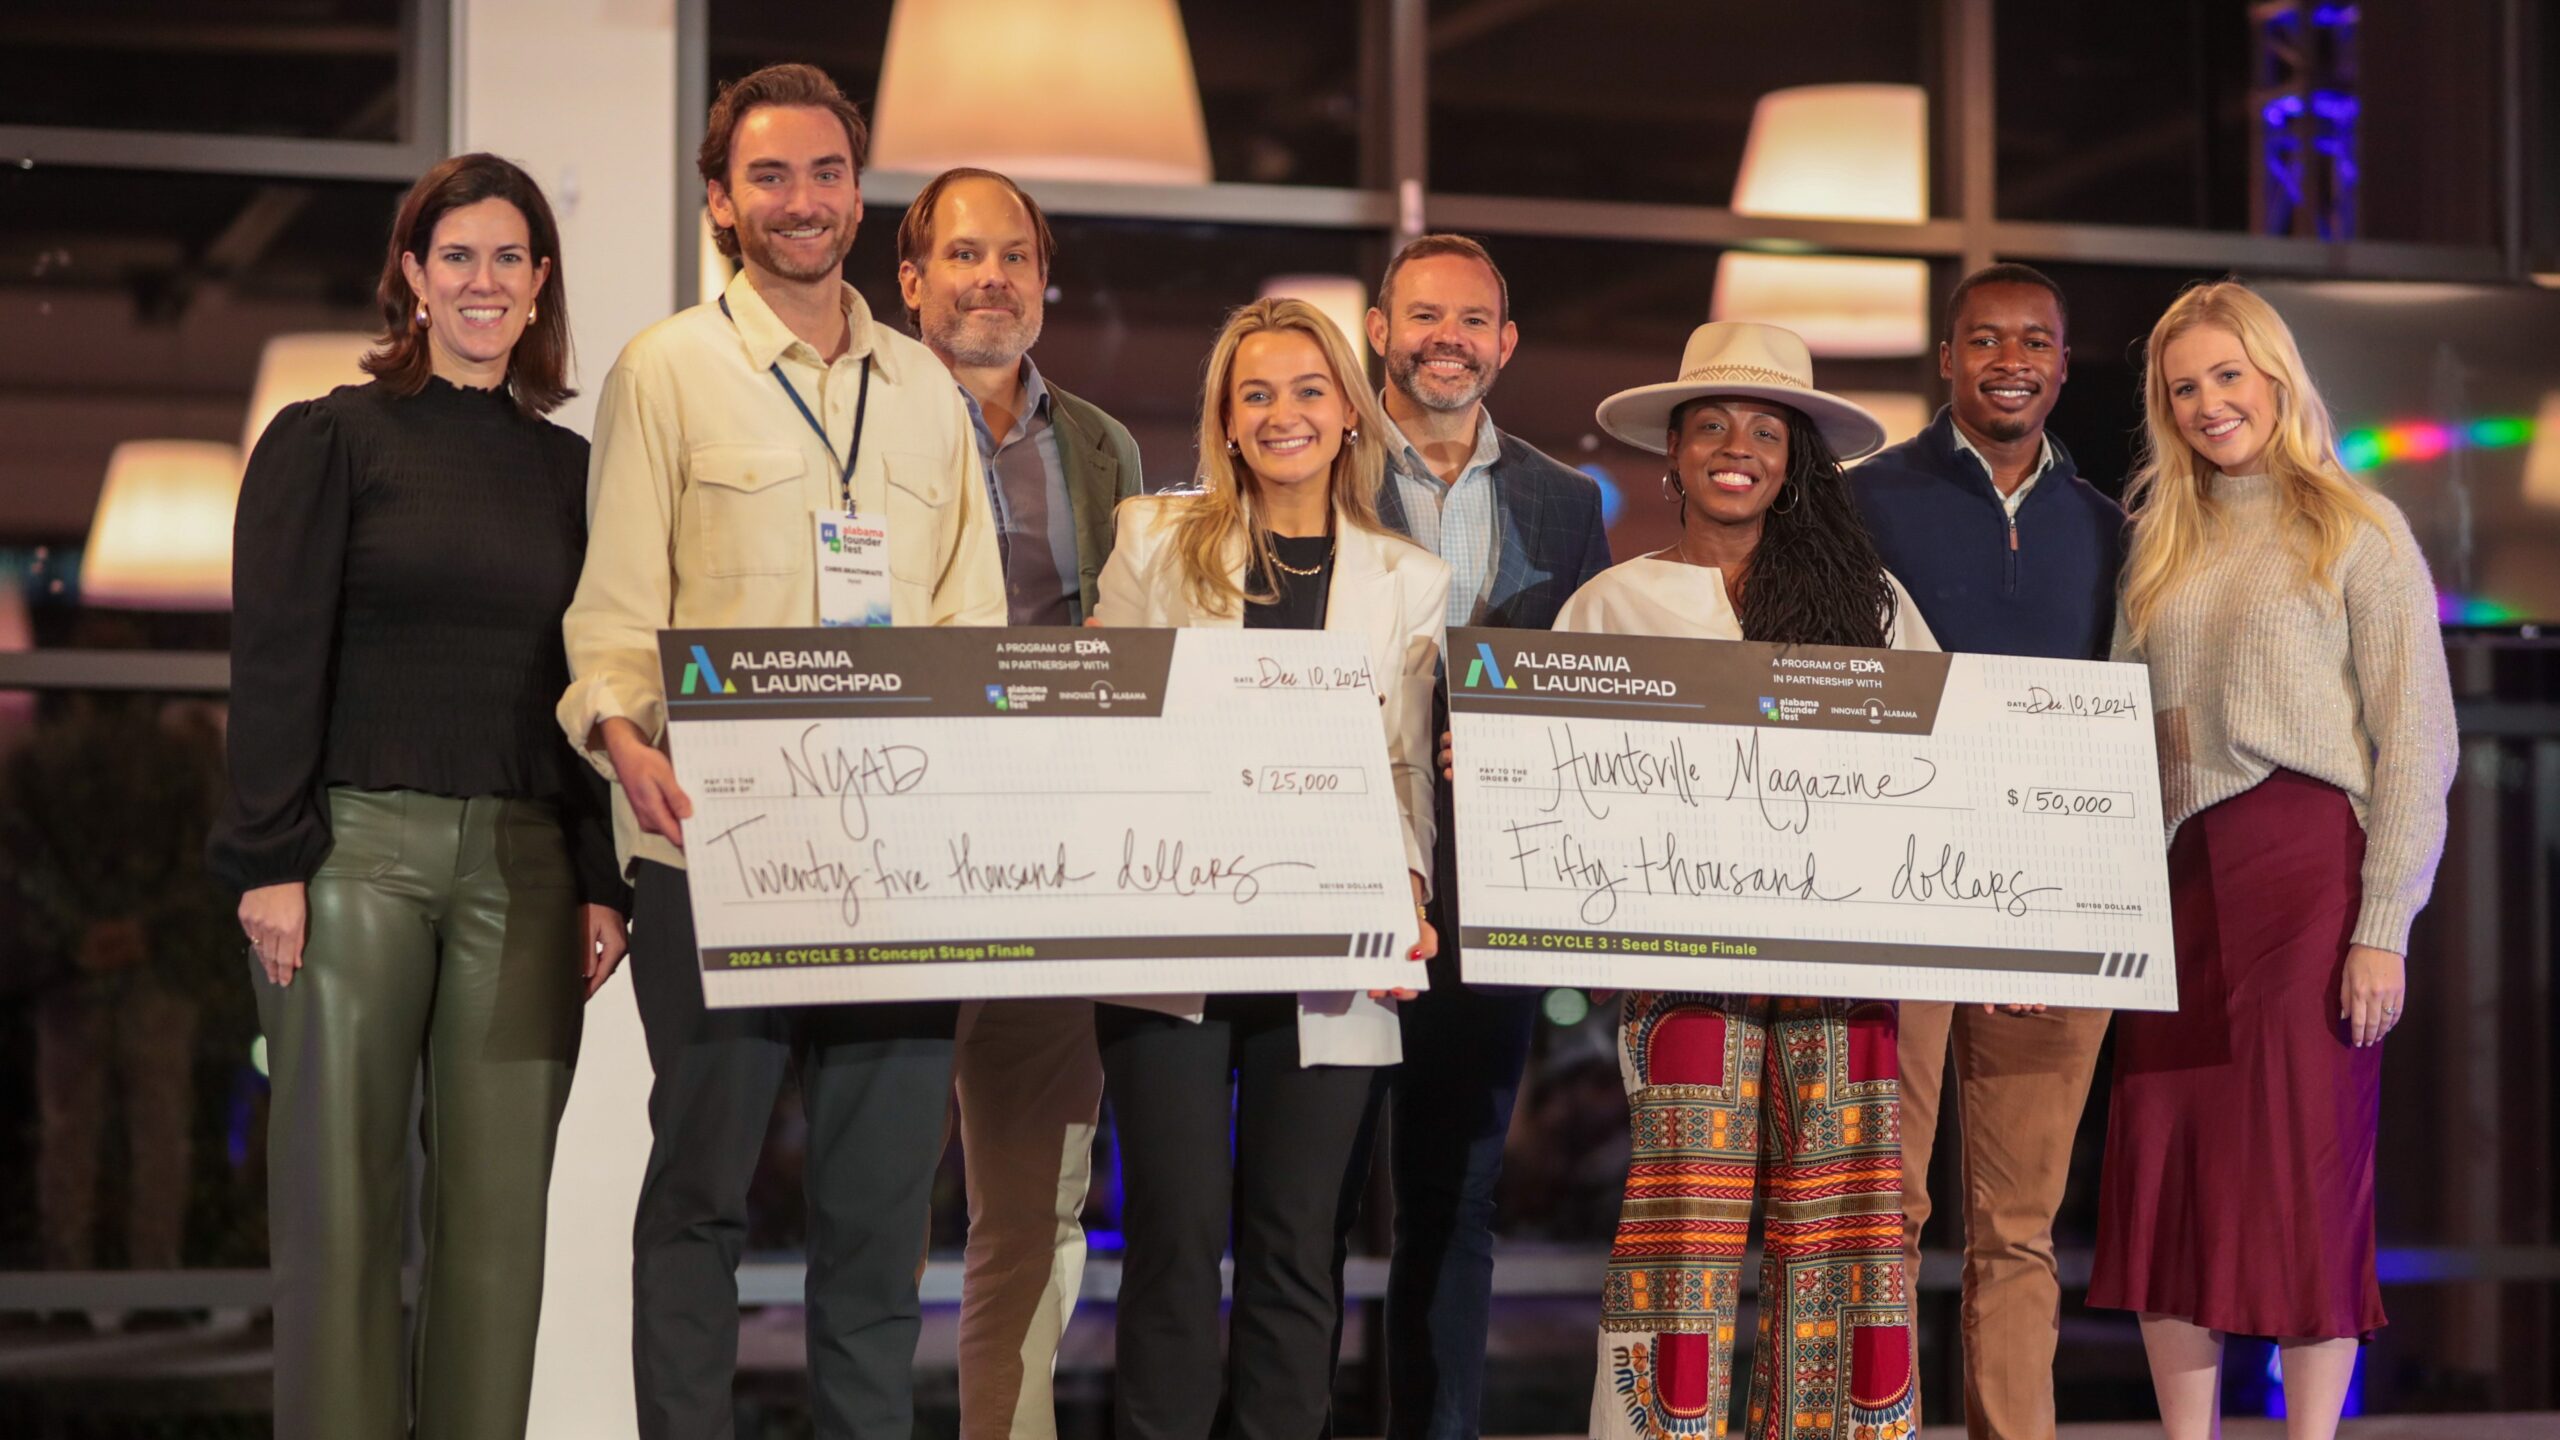
The Alabama startup boom is not an accident. It is not a fluke of geography, a windfall from a single anchor tenant, or the kind of frothy exuberance that tends to inflate and collapse in coastal corridors. It is, instead, the deliberate consequence of a deceptively simple idea: that founders, not capital, should sit at the center of an innovation ecosystem—and that when a state wraps itself around its entrepreneurs rather than the other way around, extraordinary things happen.
In two decades covering regional innovation from Tel Aviv to Tallinn and from Nairobi to Nashville, I have rarely encountered a model as coherent—or as replicable—as the one quietly assembling itself across Alabama. As U.S. venture capital continues its uneven recovery (the Q4 2025 PitchBook-NVCA Venture Monitor describes a market where “deal counts rose, multiple high-profile IPOs dominated headlines, and AI attracted a record amount of capital,” yet half of all venture dollars flowed into just 0.05% of deals), the geography of opportunity is shifting in ways most investors have not yet fully priced. Alabama is ahead of that curve.
1. Why a Founder-First Ecosystem Is Alabama’s Secret Weapon
The phrase “founder-first” is overused in startup circles. It tends to mean little beyond a firm’s marketing deck. In Alabama, it describes operational reality.
The Economic Development Partnership of Alabama (EDPA) anchors this philosophy through Alabama Launchpad, a program that has invested more than $6 million in early-stage companies—a portfolio now valued collectively at $1 billion. That’s a return profile that would turn heads in any fund memo. But the numbers alone miss the point. What Alabama Launchpad offers that Sand Hill Road cannot is proximity—a white-glove approach to connecting founders with the right resource at the right inflection point, rather than a transactional relationship governed by ownership percentages.
“We want to offer our founders white-glove service when it comes to connecting you with the resources that are right for you and your team at that time,” said Audrey Hodges, director of communications and talent at the EDPA, at the 2025 Inc. 5000 Conference & Gala in Phoenix.
This sounds simple. It is, in fact, quite rare. The Kauffman Foundation has long documented the friction that kills promising startups—not market failure, but navigational failure: the inability to find the right mentor, the right loan program, the right workforce development partner at the critical moment. Alabama has engineered its ecosystem explicitly to eliminate that friction.
The result is a startup environment that punches well above its weight class. Birmingham’s Innovation Depot, the Southeast’s largest tech incubator, provides the physical and institutional scaffolding. Auburn University’s New Venture Accelerator has launched more than 50 businesses that have attracted over $47 million in venture investment and created more than 370 jobs. The University of Alabama’s EDGE incubator anchors Tuscaloosa. And HudsonAlpha Institute for Biotechnology in Huntsville is spinning out life-science ventures at a pace that would surprise most biotech observers outside the Southeast.
Together, these nodes form what urban economists call a “distributed innovation geography”—a web of hubs rather than a single megalopolis. It is, not coincidentally, exactly the structure that the Brookings Institution has advocated as the most resilient model for regional innovation growth.
2. How Alabama Is Closing the Capital Gap—and Making It Stick
Identifying the problem is easy. Alabama’s startup funding landscape faced a structural deficit that is common to nearly every non-coastal state: a shallow pool of local venture capital, reluctant institutional investors, and the persistent gravitational pull of San Francisco and New York on promising founders and their companies.
The solution Alabama chose is, I would argue, one of the most architecturally sophisticated public-private capital strategies in the United States today.
At its core sits Innovate Alabama—the state’s first public-private partnership expressly focused on growing the innovation economy. Funded through a U.S. Department of the Treasury award of up to $98 million via the State Small Business Credit Initiative (SSBCI), Innovate Alabama has constructed a multi-layered capital stack: the LendAL program extends credit to small businesses through private-lending partnerships; InvestAL provides high-match equity investments both directly into startups and through trusted local venture funds; and a network of supplemental grants, tax incentives, and accelerator partnerships rounds out the toolkit.
What makes this architecture genuinely distinctive is not the instruments themselves—development finance has existed for decades—but the conditions attached to the capital. Charlie Pond, executive director of Alabama SSBCI at Innovate Alabama, is explicit: “We built that into our agreement with Halogen Ventures and other funds—that the money has to go to Alabama companies.” The vision, he adds, is generational: “This isn’t a one-time $98 million into the ecosystem and then we’re done. We want this to be around for a long time.”
This structural insistence that returns stay in Alabama—recycling capital back into the ecosystem rather than flowing to coastal LPs—is precisely the mechanism that differentiates Alabama’s model from the well-intentioned but often extractive pattern of outside capital flowing briefly through secondary markets before departing.
Innovate Alabama has already made 17 direct investments under the InvestAL program, with companies ranging from biotech and life sciences to AgTech and professional services. Through partnerships with gener8tor Alabama and Measured Capital—two VC firms with deep local roots and a mandate to reinvest in-state—the program is deploying a fund-of-funds strategy designed to build durable capital density. To date, 179 Alabama startups have graduated from gener8tor programs, securing nearly $80 million in follow-on funding.
In June 2025, Innovate Alabama went further still: it launched the Venture Studio and Fund in partnership with Harmony Venture Labs, a Birmingham-based company that supports new enterprises. The studio begins not with capital but with problems—industry challenges identified through deep fieldwork, then matched with founders and early investment. The Innovate Alabama Venture Studio and Fund aims to launch 10 new companies and attract $10 million in venture capital by 2028 and hopes to generate millions in economic impact across the state.
Compare this to what the NVCA’s 2025 Yearbook documents at the national level: median fund size outside California, New York, and Massachusetts was just $10 million—less than half the overall U.S. median of $21.3 million. Despite the substantial dry powder available, with $307.8 billion in capital ready to be deployed, investors have been holding off due to market uncertainty. Alabama is not waiting for that capital to find its way south on its own. It is building the infrastructure to attract, generate, and retain it locally.
3. The SmartWiz Test: Why Alabama Founders Are Choosing to Stay
No story captures the Alabama startup model more vividly—or more movingly—than SmartWiz.
Five Auburn University students, bonded through fraternity life and a shared frustration with the misery of tax preparation, spent years building a platform that compresses a four-hour tax return process into roughly 20 minutes. They are Tevin Harrell, Olumuyiwa Aladebumoye, Jordan Ward, Justin Robinson, and Bria Johnson—a team of tech entrepreneurs and tax professionals who founded SmartWiz in 2021 in Birmingham and have quickly emerged as one of only 16 IRS-approved tax software providers worldwide.
Their journey through Alabama’s ecosystem reads like a case study in coordinated public-private support: $50,000 in early seed funding through the Alabama Launchpad program; $500,000 from Innovate Alabama’s SSBCI; and additional investments from Techstars Los Angeles, Google, and entertainer Pharrell Williams.
Then came the test. The company’s commitment to Birmingham was tested when it was offered the opportunity to relocate to Los Angeles with $3 million in funding for its latest investment round, but SmartWiz chose to remain and expand in Alabama.
“We respectfully turned down that $3 million and came back to Alabama,” COO Aladebumoye said at the Inc. 5000 panel. “That’s where we ran into the SSBCI grant.” The grant helped close the seed round on Alabama’s terms.
The decision was not sentimental. It was strategic. Alabama’s workforce development agency AIDT is providing services valued at $780,000 to support SmartWiz’s expansion, and the City of Birmingham and Jefferson County are providing local job-creation incentives totaling a combined $231,000. SmartWiz plans to create 66 new jobs over the next five years, with an average annual salary of $81,136, and the growth project is projected to have an economic impact of $9.6 million over the next 20 years.
Harrell’s framing of this choice cuts to the heart of Alabama’s competitive proposition: “As a business owner, people are your biggest investment.” What Alabama offers, in his telling, is not just cheaper real estate or lower burn rates—though both matter—but a community of support that a relocated startup in Los Angeles could not replicate at any price.
This is what I would call the SmartWiz Test: when a founder turns down three times their current raise to stay in your ecosystem, you have built something real.
4. Talent, Training, and the Infrastructure of Retention
Founder retention is the Achilles heel of every emerging startup ecosystem. Build a great company in Memphis or Montgomery and the conventional wisdom says that as soon as you raise a serious round, you will relocate to be near your investors, your acqui-hire targets, and your talent pool. Alabama is systematically dismantling that logic.
The Alabama Industrial Development Training (AIDT) program—operating through the Department of Commerce—offers startup founders customized recruitment and training support tied directly to job-creation milestones. Unlike generic workforce programs, AIDT works with each company to identify the specific skill sets its workforce will need as it scales. It is, in effect, a bespoke talent pipeline that adjusts to the startup’s roadmap rather than forcing the startup to adjust to the market.
Innovate Alabama’s Talent Pilot Program extends this model by funding bold, scalable solutions to Alabama’s broader workforce challenge—paid internships, STEM acceleration, and work-based learning programs designed to keep the state’s best graduates in-state.
The effects are measurable. Birmingham was designated one of 31 federal Tech Hubs—the only city in the Southeast to receive the distinction—positioning it for substantial federal investment in innovation infrastructure. HudsonAlpha has made Huntsville a nationally recognized node in the biotech talent network. Auburn and the University of Alabama together generate a pipeline of engineering and business graduates increasingly likely, because of programs like Alabama Launchpad, to start companies at home rather than migrate to coastal markets.
The Brookings Institution’s research on growth centers makes this point with precision: talent retention is not primarily a question of amenities or wages. It is a question of opportunity density—the number of high-quality, high-growth companies and institutions concentrated in a geography. Alabama is deliberately thickening that density.
5. A Global Blueprint: What Alabama Can Teach the World
In covering innovation ecosystems across four continents, I keep returning to a structural insight that Alabama is proving with empirical force: the most resilient startup ecosystems are not the largest or the best-capitalized. They are the most coherent—the ones where state policy, private capital, university research, incubation infrastructure, and founder community all pull in the same direction at the same time.
Israel’s famed startup ecosystem—often held up as the gold standard for a small geography punching above its weight—succeeded not because Israeli venture capital was particularly sophisticated in the early years, but because of deliberate public-private coordination, military-derived talent pipelines, and a cultural insistence that founders stay and build at home. The Yozma program, launched in 1993, used a government fund-of-funds to catalyze private VC—exactly the structural logic behind Alabama’s InvestAL. Alabama is, in important respects, attempting something analogous: using public capital not to replace private investment but to de-risk and attract it.
Estonia’s digital transformation—a country of 1.3 million people that became a global model for e-governance and startup density—succeeded through the same coordinated coherence, not through the sheer volume of capital. Rwanda’s innovation push in Kigali, East Africa’s most deliberate attempt to build a technology economy from the top down, draws the same lesson: intentionality and ecosystem design matter more than proximity to existing capital pools.
What Alabama has that many of these comparators lacked in their early stages is something harder to engineer: community. The panel at the Inc. 5000 conference kept returning to this word, and it deserves examination. Community, in the Alabama startup context, means something specific: a network of founders, investors, educators, and state officials who know each other, refer to each other, and take responsibility for each other’s success. It is the opposite of the anonymous, transaction-driven culture of Silicon Valley at scale.
“The barrier to entry to succeed in Alabama,” as one panelist put it at the Inc. 5000 conference, “is just your willingness to hustle.” That framing deserves to be taken seriously. In San Francisco, the barrier to entry is, increasingly, a warm introduction to a partner at a top-decile firm, a Stanford pedigree, and the financial runway to survive eighteen months without a paycheck. Alabama’s model—meritocratic, community-anchored, and deliberately inclusive—is not only more equitable. It may, over time, prove more durable.
SmartWiz was founded by five Black entrepreneurs from Auburn. They were backed by Pharrell Williams’ Black Ambition Prize, the Google for Startups Black Founders Fund, and a state ecosystem that met them where they were rather than requiring them to relocate to access capital. That is not incidental to Alabama’s model. It is central to it.
6. The 2026 Moment: Why Now Matters
U.S. venture capital is at a genuine inflection point. As 2026 begins, optimism is cautiously returning—the IPO window has begun to open, secondaries have gained acceptance as a critical liquidity outlet, and early-stage investing is regaining strength. The concentration problem that has plagued the market—half of all venture dollars went into just 0.05% of deals in 2025—creates a structural opening for ecosystems that have been building patiently, without depending on the mega-rounds that define and distort coastal markets.
Alabama has been building exactly that. Its $98 million SSBCI deployment is not finished. Its Venture Studio has barely begun. Its pipeline of university-trained founders is expanding. And critically, its brand as a founder-friendly ecosystem is gaining the kind of national visibility—through the Inc. 5000 stage, through SmartWiz’s headline-making story, through Innovate Alabama’s increasingly sophisticated capital architecture—that attracts the next wave of entrepreneurs and investors.
The Innovate Alabama Venture Studio’s goal of launching 10 new companies and attracting $10 million in venture capital by 2028 is modest by coastal standards. It is transformative by the standards of what secondary markets have historically been able to achieve. And if Innovate Alabama’s track record holds—if the $6 million invested through Alabama Launchpad continues to compound toward and beyond its current $1 billion portfolio valuation—the returns will be impossible to ignore.
There is a moment in the development of every successful regional ecosystem when it tips from “interesting experiment” to “self-reinforcing flywheel.” The exits create the angels. The angels fund the next cohort. The wins attract talent. The talent attracts the next round of capital. Observers who watched Austin in 2010 or Miami in 2019 know this pattern well. Alabama, in 2026, looks poised for exactly that transition.
Opinion: Alabama Is Writing the Next Chapter of American Innovation
The coastal consensus in American venture capital holds, implicitly if not always explicitly, that innovation is a product of density—of the accidental collisions that happen when enough smart, ambitious people are crammed into San Francisco or Manhattan. There is truth in this. There is also, increasingly, evidence that it is incomplete.
Density without coherence produces exclusion. It produces the housing crisis that is bleeding talent out of San Francisco. It produces the founder burnout that has come to define the “move fast and break things” generation. It produces ecosystems that are brilliant at the top and fragile everywhere else.
Alabama is demonstrating an alternative. Not a rejection of density, but a designed coherence—a deliberate alignment of capital, community, training, policy, and founder support that creates the conditions for high-growth companies to start, scale, and stay. The fact that Alabama can offer this while also offering a cost structure that extends a startup’s runway by twelve to eighteen months compared to the Bay Area is not a side benefit. It is a competitive advantage of the first order.
For policymakers in secondary markets from the American Midwest to Southeast Asia, Alabama’s model contains a clear set of replicable principles: anchor public capital to local returns; build incubation infrastructure before trying to attract outside investors; treat founders as the customer of the ecosystem rather than as the raw material; invest relentlessly in talent retention; and understand that community is not a soft amenity—it is the operating system on which everything else runs.
The future of American innovation does not belong exclusively to Silicon Valley. It belongs to the places that figure out, as Alabama is figuring out, that the best investment a region can make is not in a single unicorn but in the conditions that make unicorns possible—and that make founders choose to stay and build them at home.
The magic of Alabama, ultimately, is not in the dollar amounts or the portfolio valuations, impressive as they are. It is in a group of five Auburn graduates turning down a $3 million check to fly back home to Birmingham, walk into Innovation Depot, and build something the world has not seen before.
That is what a real startup ecosystem looks like. And the rest of the country—and the world—should be paying attention.
Discover more from The Economy
Subscribe to get the latest posts sent to your email.



Navigating Mortgage and Loan Refinancing in a High-Yield Environment
Global public debt crossing critical thresholds has kept central bank policies volatile, resulting in fluctuating US Treasury yields throughout 2026. For homeowners and commercial property holders burdened by previous high-interest borrowing cycles, finding optimal refinance windows has become a high-stakes financial puzzle. Stalled disinflation and stubborn employment numbers mean rate cuts are incremental, requiring borrowers to act with precision.
Timing your mortgage or commercial loan refinance in this environment requires a deep understanding of yield curve movements and lender risk appetites.
Decoding 2026 Refinance Dynamics
The 10-Year Treasury Yield Benchmark
Mortgage rates continue to track closely with the 10-year US Treasury yield. When macroeconomic anxiety spikes debt issuance, yields rise, tightening consumer borrowing capacity. Savvy borrowers monitor weekly Treasury auctions to lock in rates during brief dip windows.
Hybrid ARMs and Alternative Structures
With fixed rates remaining elevated, 7/1 and 10/1 adjustable-rate mortgages (ARMs) have surged in popularity. These products offer lower initial monthly payments, giving borrowers breathing room until central bank easing cycles fully materialize.
| Loan Product | Current Rate Range | Best For | Key Risk Factor |
| 30-Year Fixed Mortgage | 6.2% – 6.8% | Long-term predictability | Higher initial monthly outlay |
| 7/1 Hybrid ARM | 5.5% – 5.9% | Short-term ownership / flipping | Rate reset risk after year 7 |
| Commercial Refinance | 7.0% – 8.2% | Corporate asset restructuring | Strict DSCR lender covenants |
Actionable Steps for Successful Refinancing
To maximize your chances of securing favorable refinance terms in a volatile market, follow a disciplined preparation strategy.
Boost Your Credit Score Immediately: Lenders in 2026 are applying stringent credit tiering; a 20-point increase can drop your APR by a crucial quarter-point.
Shop Regional Credit Unions: Smaller financial institutions often offer portfolio loans with more flexible underwriting than major national banks.
Calculate the Break-Even Point: Ensure your total closing costs are recouped through monthly savings within 24 months of closing.
“Market Strategist View: Refinancing in 2026 is an exercise in opportunistic timing. Borrowers must maintain immaculate financial profiles ready to strike the moment Treasury yields dip.”
Mastering the complexities of today’s debt environment ensures you can successfully lower your debt service costs and protect your long-term financial stability.
Discover more from The Economy
Subscribe to get the latest posts sent to your email.

The days of pulling generic auto insurance quotes based purely on your zip code and age are officially over. In 2026, insurance comparison engines are powered entirely by generative AI and real-time telematics. These platforms digest thousands of live data points—ranging from your driving smoothness via connected vehicle sensors to real-time traffic congestion patterns—to generate hyper-personalized premiums instantly.
For consumers, this evolution represents both a massive opportunity for savings and a hidden trap for penalty pricing. Understanding how AI algorithms evaluate risk is essential for anyone looking to lower their monthly auto insurance premiums.
How AI Comparison Engines Evaluate Your Risk Profile
Behavioral Telematics and Connected Cars
Modern cars stream performance data directly to insurance aggregators. Generative AI models analyze braking sharpness, acceleration curves, cornering G-forces, and phone distraction metrics. Drivers who maintain smooth, defensive habits are rewarded with dynamic rate cuts of up to 40% compared to traditional rating tiers.
Predictive Traffic and Weather Modeling
AI tools now cross-reference your daily commute route with predictive weather and accident probability models. If your standard parking location or driving corridor has a statistically higher incidence of uninsured motorist claims, your quotes will reflect that hyper-local risk assessment.
| Comparison Factor | Traditional Rating Model | 2026 Generative AI Model | Impact on Premium |
| Mileage & Usage | Annual estimated odometer reading | GPS tracking & live trip duration | High (up to 35% savings) |
| Driving Behavior | MVR driving record & accidents | Real-time braking, speed, & G-force | Critical (determines tier) |
| Vehicle Tech | Make, model, and safety rating | ADAS calibration & repair cost data | Moderate |
Strategies to Lower Your AI-Driven Insurance Quote
To outsmart the algorithm and secure the lowest possible premium in 2026, drivers must proactively manage their digital footprint on insurance platforms.
Opt-In for Telematics Trial Periods: Many insurers offer immediate 15% discounts just for installing their driving app; let it track safe habits for 30 days to lock in permanent savings.
Scrub Unverified Public Records: Ensure your motor vehicle report is free of clerical errors that AI risk models misinterpret as reckless behavior.
Compare AI Aggregators: Use platforms that integrate multi-carrier API feeds rather than single-brand comparison sites to find the best risk-adjusted rate.
“Industry Note: AI-driven pricing rewards transparency and precision. Drivers who actively manage their telematics data consistently out-save those relying on legacy quote calculators.”
Embracing AI comparison tools allows savvy policyholders to customize coverage limits precisely to their driving habits, eliminating wasted premium spend while ensuring robust protection.
Discover more from The Economy
Subscribe to get the latest posts sent to your email.

Despite decades of bans and strict handling mandates, asbestos remains a silent killer across legacy manufacturing plants, shipyards, and modern green-energy infrastructure retrofits. In 2026, regulatory changes by the EPA and tightened occupational health standards have triggered a fresh wave of mesothelioma litigation. Manufacturers attempting to fast-track industrial transitions are encountering catastrophic oversight, exposing workers to legacy toxins and opening corporate parent companies to unprecedented liability.
Navigating a mesothelioma claim in 2026 requires understanding how modern industrial supply chains intersect with historical exposure. Trusts established decades ago are being audited under stricter transparency laws, altering payout ratios and accelerating fast-track settlements for terminally ill plaintiffs.
Modern Industrial Exposure Hotspots
Green Retrofitting and Renewable Energy Infrastructure
A primary source of 2026 asbestos exposure occurs during the decommissioning and retrofitting of older industrial facilities for renewable energy production. Workers insulating electrical grids, modernizing HVAC systems, or upgrading manufacturing floors frequently disturb encapsulated asbestos materials that were improperly documented or ignored during facility audits.
Automotive and Aerospace Supply Chains
With advanced manufacturing booming, workers handling specialized friction materials, gaskets, and heat shields face ongoing risks. Supply chain tracing has become more sophisticated, allowing legal teams to pinpoint exact corporate entities responsible for raw material distribution across multinational borders.
| Industry Sector | Primary Exposure Risk | Legal Venue / Trust | Avg. Claim Value Range |
| Green Energy Retrofit | Disturbed insulation, pipe lagging | Federal Tort / Manufacturer Trust | $1.2M – $3.5M |
| Shipbuilding & Marine | Boiler insulation, structural seals | Asbestos Bankruptcy Trusts | $800K – $2.4M |
| Automotive Manufacturing | Brake components, high-heat gaskets | Third-Party Product Liability | $600K – $1.8M |
Securing Maximum Compensation: Steps for Plaintiffs
Time is of the essence in mesothelioma cases. Plaintiffs and their families must act decisively to secure financial recovery before statutes of limitations expire.
Retain Specialized Counsel: Work exclusively with national mesothelioma law firms possessing deep historical databases of asbestos-containing products.
Audit Employment History: Document every job site, supervisor name, and equipment brand encountered throughout your career.
Expedite Medical Filings: Secure a formal pathological diagnosis quickly to qualify for expedited trust fund distribution and priority trial settings.
“Expert Insight: Modern asbestos litigation is no longer just about historical tracking; it is about holding modern corporations accountable for failing to conduct rigorous environmental safety audits before initiating industrial retrofits.”
By combining meticulous work history reconstruction with aggressive multi-trust filings, victims can secure substantial financial relief to cover specialized immunotherapy and family support.
Discover more from The Economy
Subscribe to get the latest posts sent to your email.

Crypto Daily Outlook: Bitcoin, Altcoins, and the Future of Decentralized Finance

Anthony Scaramucci’s Crypto Prediction: Why MicroStrategy’s Move Is Bitcoin’s “iPhone Moment”

Best Dividend Stocks 2026: European & Asian Blue Chips

World Bank & IMF Reports 2026: Why the “3% Growth” Consensus Is Actually a Debate

Elon Musk’s Boring Company Hits $23B Valuation After UAE-Led $3 Billion Series D

Middle East War Economics 2026: Oil Prices & Energy Markets

PSX Forecast 2026: KSE-100, IMF Reviews & Geopolitics

Asian Markets Outlook 2026: China, Japan & Singapore Stocks

Global Economy 2026: IMF Growth, Inflation & Private Credit

Current Account Deficit (CAD) : Causes and Impact

Balance of Payments (BOP)

The Falkland Islands Dispute: Sovereign Wealth, Offshore Drilling, and Market Impacts

Gross Domestic Product (GDP): Nominal vs. Real

What is Inflation and the Consumer Price Index (CPI)?

State Farm’s $5B Dividend 2026: Who Qualifies & Payout Dates

US-China Relations in Q3 2026: Trade Tariffs and Supply Chain Risks

Gold’s Wild 2026: From a Record $5,600 Peak to a 24% Crash and Back Toward $4,500

Oil Surges as Strait of Hormuz Traffic Collapses Again

The Rocket That Won’t Quit: Inside SpaceX’s Falcon 9 Launch Machine

Bank of England Set to Hold Rates Through Year-End, Reuters Poll Shows

SpaceX Starship Flight 14: First Orbital Attempt & Starlink V3 Launch Explained

The 2026 Crypto Regulatory Shift: What It Means for Institutional Investors

AI Chip Stocks 2026: The Best Semiconductor Investments Beyond Marvell

Retail Earnings Week: What Home Depot, Target & Walmart Reveal

AI-Powered Training: The Next Multi-Billion Dollar Ecosystem in Fitness

Top 30 Stocks for Investment in PSX for Massive ROI in 2026

Russia’s Black Sea Oil Exports Fall for a Fifth Straight Week

Tween Back-to-School Trends 2026: What’s Driving the $85B Season
-

 Markets & Finance8 months ago
Top 15 Stocks for Investment in 2026 in PSX: Your Complete Guide to Pakistan’s Best Investment Opportunities
-

 Analysis7 months ago
Johor’s Investment Boom: The Hidden Costs Behind Malaysia’s Most Ambitious Economic Surge
-

 Analysis7 months ago
Top 10 Stocks for Investment in PSX for Quick Returns in 2026
-

 Analysis7 months ago
Brazil’s Rare Earth Race: US, EU, and China Compete for Critical Minerals as Tensions Rise
-

 Banks8 months ago
Best Investments in Pakistan 2026: Top 10 Low-Price Shares and Long-Term Picks for the PSX
-

 Investment8 months ago
Top 10 Mutual Fund Managers in Pakistan for Investment in 2026: A Comprehensive Guide for Optimal Returns
-

 Global Economy9 months ago
15 Most Lucrative Sectors for Investment in Pakistan: A 2025 Data-Driven Analysis
-

 Global Economy9 months ago
Pakistan’s Export Goldmine: 10 Game-Changing Markets Where Pakistani Businesses Are Winning Big in 2025