
Markets & Finance
Best Dividend Stocks 2026: European & Asian Blue Chips


With the S&P 500 yielding a historically thin 1.2% and trading at a P/E above 31 following its 2025 rally, income-focused investors have been forced to look further afield. Europe and Asia’s blue-chip dividend payers are filling that gap — offering yields two to five times the U.S. benchmark, backed in many cases by decades of uninterrupted payout growth. Here is where the highest-quality income is actually sitting in 2026, and where headline yield is masking real risk.
Why U.S. Yields No Longer Cut It
The math is straightforward. As Sure Dividend notes, the S&P 500 closed out 2025 with a year-to-date total return of nearly 19%, pushing its price-to-earnings ratio above 31 and compressing yields across the board. Even reliable U.S. dividend growers now offer modest current income: NextEra Energy yields just 2.7% (though it is growing its payout at a 6% compound annual rate through 2028), Coca-Cola yields about 2.7%, and Mastercard — despite raising its dividend more than 9,500% since its first payment — yields a mere 0.7%, according to The Motley Fool. For investors who need current income rather than pure growth, that combination of high valuations and low yields has made the U.S. market a difficult place to build an income portfolio in 2026.
Europe: Insurance and Compounders Lead on Yield
European blue chips have emerged as the highest-conviction income allocation for 2026, according to screening data from Dividend Talk, which evaluates stocks on dividend safety, valuation, and long-term growth rather than headline yield alone.
Top European dividend stocks (verified June 17, 2026):
| Stock | Yield | Sector |
|---|---|---|
| Munich Re | 5.17% | Reinsurance |
| ASR Nederland | 5.15% | Insurance |
| Wolters Kluwer | 4.21% | Information services |
| Novo Nordisk | 4.10% | Pharmaceuticals |
| Fuchs Petrolub | — | Specialty lubricants |
| London Stock Exchange Group | — | Financial market infrastructure |
| Halma | — | Safety/health technology |
| RELX | — | Information/analytics |
| SAP | — | Enterprise software |
The critical distinction Dividend Talk draws is between yield and dividend safety. Munich Re, ASR Nederland, Wolters Kluwer, and Novo Nordisk all carry both an above-3.8% yield and a “Safe” or “Very Safe” internal safety rating, alongside multi-decade dividend records — meaning the yield is backed by durable free cash flow rather than a depressed share price masquerading as a bargain. That distinction matters most in the insurance names: Munich Re and ASR Nederland benefit structurally from higher reinsurance pricing following a run of costly global catastrophe years, giving their payouts unusually strong underlying support heading into 2026.
Asia: Banking and Semiconductor Leadership, With a Payout Caveat
Asian dividend stocks offer a different risk-reward profile, combining higher headline yields with more variable payout coverage. According to Analytics Insight’s 2026 Asia screen, DBS Group Holdings stands out with an estimated dividend yield of 5.4% to 6.1% — among the highest of any large-cap regional bank globally — supported by its wealth-management franchise, deep Southeast Asian deposit base, and digital banking scale.
Top Asian dividend stocks for 2026:
| Stock | Yield | Note |
|---|---|---|
| DBS Group Holdings | 5.4%–6.1% | Deep deposit base, wealth management scale |
| TSMC | Lower, growth-oriented | Semiconductor leadership, diversified cash flow |
| ITC | Moderate | Diversified conglomerate, business visibility |
| Anhui Heli | 3.3%–4.47% | Track payout coverage closely |
| Shibusawa Logistics | 3.3%–4.47% | Track payout coverage closely |
| Rheon | 3.3%–4.47% | Track payout coverage closely |
| Japan market payer (top-quartile yield) | ~4.0% | JPY 31/share; payout ratio 40.1% |
The caution flag in Asia sits with the smaller-cap names. Analytics Insight specifically flags that while stocks like Anhui Heli, Shibusawa Logistics, and Rheon offer attractive 3.3%–4.47% yields, investors need to verify free cash flow coverage before committing capital. One unnamed top-quartile Japanese dividend payer illustrates the risk clearly: its payout ratio of 40.1% suggests the dividend is covered by earnings but not comfortably by free cash flow, and its dividend history has been volatile over the past decade — a pattern that can quietly erode a portfolio’s income reliability even when the trailing yield looks attractive on a screener.
Building a 2026 Income Allocation: The Framework
The right approach for 2026 income investors is to treat yield as a starting filter, not a selection criterion. Analytics Insight’s own guidance is explicit: “investors should also consider key metrics such as payout ratio, free cash flow coverage, market position, and dividend consistency before investing” — a standard that immediately separates DBS, TSMC, and ITC (dependable large-cap options with strong business visibility) from the higher-yielding but less-established smaller names.
A practical due-diligence checklist before buying any high-yield stock in 2026:
- Payout ratio relative to earnings AND free cash flow — a dividend covered by earnings but not FCF is a warning sign, not a green light
- Dividend growth streak length — a multi-decade record (Novo Nordisk, RELX, SAP) filters out cyclical one-off high yields
- Sector tailwinds — European insurers are riding a hard reinsurance pricing cycle; Asian banks like DBS benefit from elevated regional rates and wealth inflows
- Currency exposure — unhedged EUR, SGD, and JPY dividend income introduces FX volatility that can offset or amplify the yield advantage over USD alternatives
Final Verdict
For income-focused investors priced out of a 1.2%-yielding, 31x-earnings S&P 500, Europe’s insurance and compounder names — led by Munich Re, ASR Nederland, Wolters Kluwer, and Novo Nordisk — currently offer the best combination of yield and safety available in developed markets. In Asia, DBS Group is the standout large-cap income name, while TSMC and ITC offer lower yields with stronger long-term visibility. The smaller Asian dividend payers can supplement a portfolio’s income but demand active monitoring of payout ratios rather than a buy-and-forget approach. The overarching 2026 lesson: geographic diversification into non-U.S. blue chips isn’t just a currency or growth play anymore — for income investors, it has become close to a necessity.
Discover more from The Economy
Subscribe to get the latest posts sent to your email.


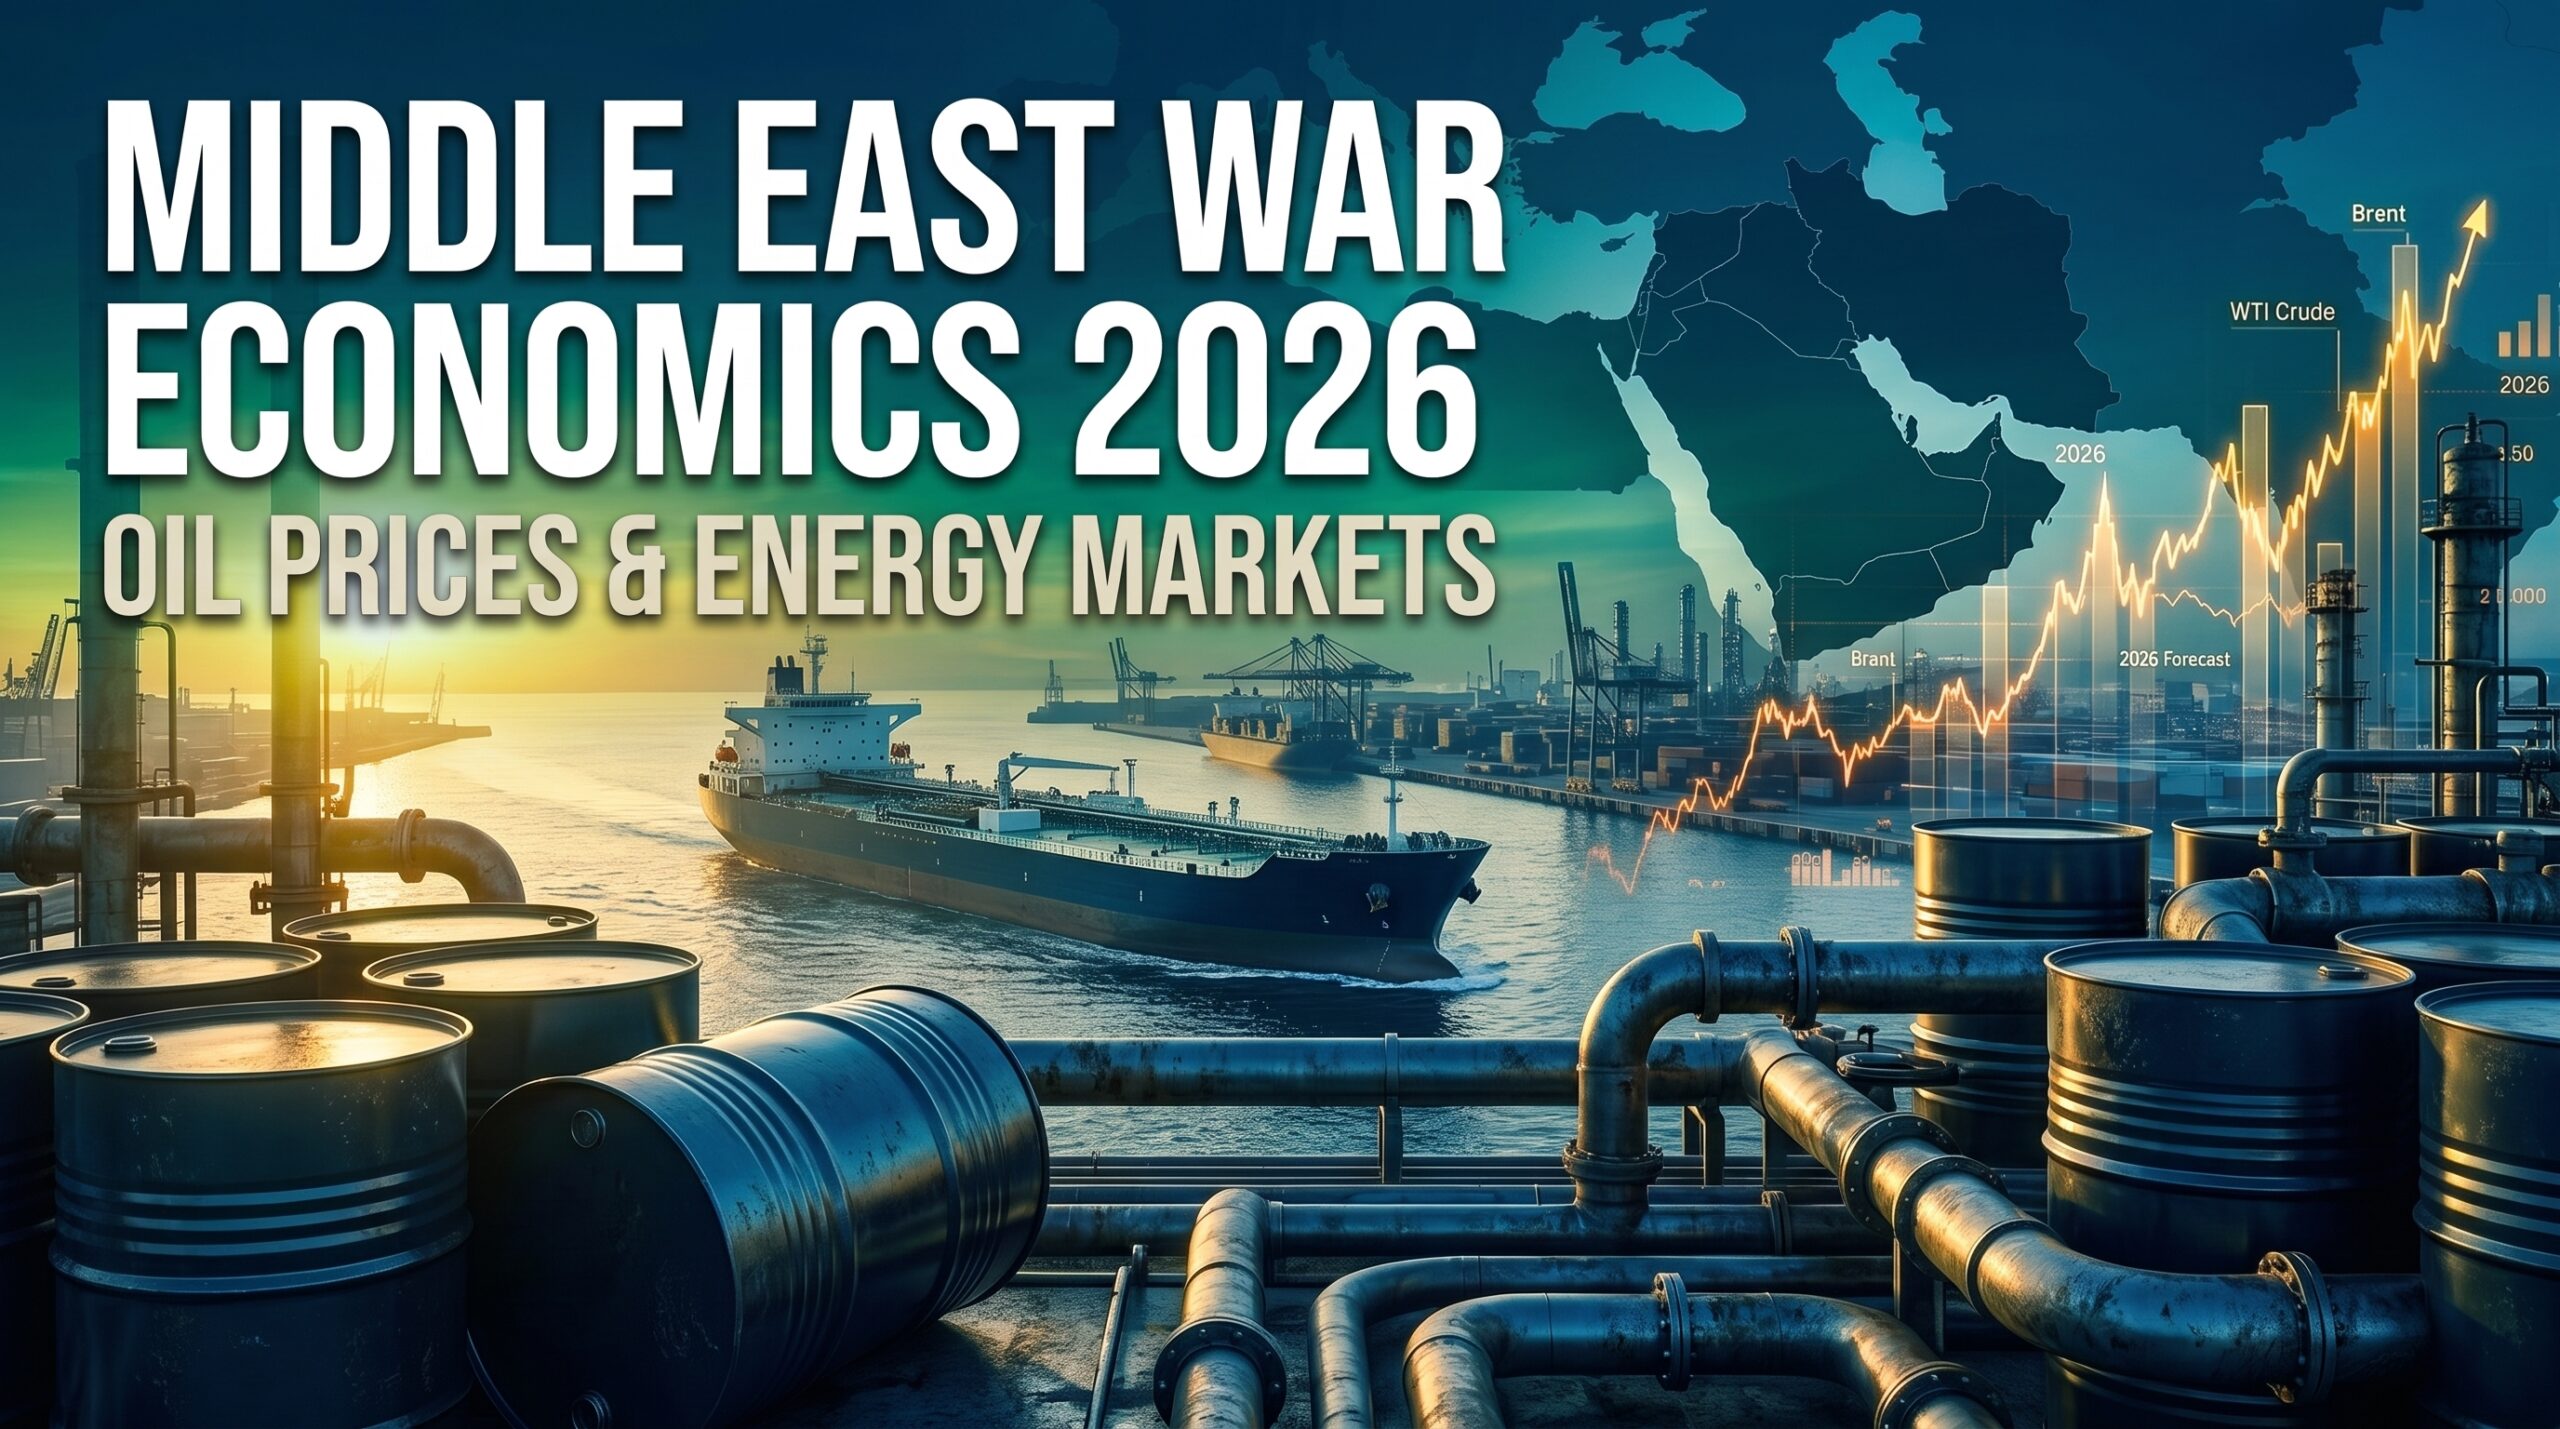
Six months into the war between the United States, Israel, and Iran, one pattern has become unmistakable to energy traders: every reported ceasefire has been followed, sooner or later, by a fresh escalation. What started as a limited conflict on February 28, 2026, has evolved into the most disruptive geopolitical shock to global oil supply since Russia’s invasion of Ukraine — and as of September 2026, it is still actively reshaping energy markets, shipping routes, and inflation forecasts worldwide.
The Ceasefire-and-Relapse Cycle
The conflict has produced at least three distinct ceasefire announcements since February, and none has held for more than a few weeks. In April 2026, a US-Iran arrangement briefly reopened the Strait of Hormuz and sent oil plunging below $100 a barrel, as reported by Euronews. Gold, which had surged as a safe haven, still traded near $4,750 an ounce that same week as investors openly doubted the truce would last, according to Trading Economics — key disputes remained unresolved and the Strait stayed effectively closed even after the announcement.
That skepticism proved warranted. By September 2026, oil had round-tripped decisively higher. Brent crude surpassed $100 a barrel for the first time in nearly six weeks after fresh attacks on oil facilities and tankers, settling at $97.89 before jumping 2.4% to $100.29, with WTI gaining to $94.77, according to reporting carried by the Washington Times. The proximate trigger: the U.S. military struck five Iranian tankers in response to attempted missile attacks on a Navy warship, while Iranian-backed Houthi forces ignited fires at Saudi Arabian oil facilities.
Oil price trajectory during the conflict:
| Date | Brent Crude | Context |
|---|---|---|
| Mar 21, 2026 | ~$106.77 | Fifth straight weekly gain amid escalation |
| Mar 20, 2026 | Forecast warning of $180+ | Saudi Aramco officials warned WSJ of extreme scenario |
| Apr 8, 2026 | Below $100 | Ceasefire announcement, Strait reopening pledge |
| Sept 7, 2026 | $97.31 | Six-week high; Iran vows to strike energy infrastructure |
| Sept 9, 2026 | $100.29 | Attacks on tankers and Saudi refineries |
| Sept 11, 2026 | ~$100, +9% week | Diplomatic talks announced on Hormuz shipping |
Why the Strait of Hormuz Is the Real Story
The Strait of Hormuz is the fulcrum of this entire crisis. Roughly 20% of the world’s oil supply passes through this chokepoint, including about half of Asia’s oil imports and a quarter of its LNG imports, according to TD Economics. Since the war began, fighting has halted most shipping through the strait, and — critically — markets have stopped believing repeated U.S. government proclamations that reopening is imminent. As one energy analyst told Marketplace, “The Strait of Hormuz won’t be what it was before. Now, we understand that Iran can and will block it.”
The physical impact on trade flows has been severe. Oil shipments out of the Middle East are running roughly 65% below year-ago levels, and the cost of shipping crude to Asia on the largest tankers has hit a record high, per the same Marketplace reporting. The United Arab Emirates has responded by actively building alternative export routes and trade corridors to avoid having its energy exports “held hostage” by the conflict, a senior UAE presidential adviser confirmed to Reuters in early September.
Demand Destruction Is Now the Dominant Theme
While supply disruption drove the initial price spike, the market’s focus by September 2026 has shifted decisively toward demand destruction. The International Energy Agency sharply lowered its 2026 global oil demand outlook, forecasting a contraction of 2.5 million barrels per day — the largest annual decline since the COVID-19 pandemic — as higher prices and tighter supply weigh on consumption, according to Trading Economics. OPEC has cut its own demand-growth forecast for a fifth consecutive month. Both organizations now agree that sustained triple-digit oil is actively destroying the demand it was created by.
OPEC+ itself has opted for caution rather than aggressive supply response, keeping its October output policy unchanged at its early-September meeting, pending agreement on new quotas before any further steps, Reuters reported.
The Inflation and Consumer Pass-Through
The war’s inflationary impact has already shown up in hard data. U.S. gasoline prices surged in March 2026 to an EIA-reported average of $3.638 per gallon, the highest since September 2023, with AAA data showing the national average briefly topping $4.02 per gallon — a monthly jump described by Trading Economics as exceeding even the spikes following Hurricane Katrina and Russia’s 2022 invasion of Ukraine. Euro-area inflation jumped to 2.5% in the same window, well above the European Central Bank’s 2% target, driven almost entirely by the energy component.
Who is most exposed:
| Category | Exposure | Why |
|---|---|---|
| Asian oil importers (Japan, India, Pakistan, China) | Very high | ~50% of Asia’s oil, 25% of LNG via Hormuz |
| European energy consumers | High | Already strained post-Russia diversification |
| Gulf oil exporters (Saudi, UAE, Qatar) | Mixed | Higher prices offset by direct attack risk on infrastructure |
| U.S. consumers | Moderate-high | Domestic production buffers some but not all of the shock |
| Global shipping/logistics | High | Record tanker rates, rerouting costs |
Diplomatic Off-Ramps Being Tested
The most significant near-term catalyst for de-escalation is the diplomatic track around Strait of Hormuz shipping management. Top diplomats from the six-member Gulf Cooperation Council were scheduled to meet their Iranian counterpart to negotiate a possible temporary arrangement for managing transit through the strait, according to Trading Economics. Iranian state media separately indicated Tehran would meet Gulf states in Oman for related talks. Markets have priced in modest optimism around these talks — crude paused its rally and settled near $100 on the news — but given the track record of failed ceasefires since February, traders are treating any de-escalation as tactical rather than durable until physical shipping data confirms a sustained reopening.
Final Verdict
The “ceasefire economics” of the 2026 Middle East war have proven to be a recurring, not a resolving, phenomenon: each truce has produced a short-lived relief rally in oil and a corresponding dip in inflation expectations, followed by renewed escalation that erases the gains. As of September 2026, Brent and WTI sit near six-week highs above $90–100, the Strait of Hormuz remains functionally impaired, and both the IEA and OPEC now forecast the sharpest demand contraction since the pandemic. For investors and policymakers, the actionable conclusion is that oil-price volatility itself — not a stable higher or lower price level — is the defining condition of this market, and near-term direction hinges almost entirely on whether the current Gulf-Iran diplomatic track produces a verifiable, physically confirmed reopening of shipping lanes rather than another rhetorical ceasefire.
Discover more from The Economy
Subscribe to get the latest posts sent to your email.
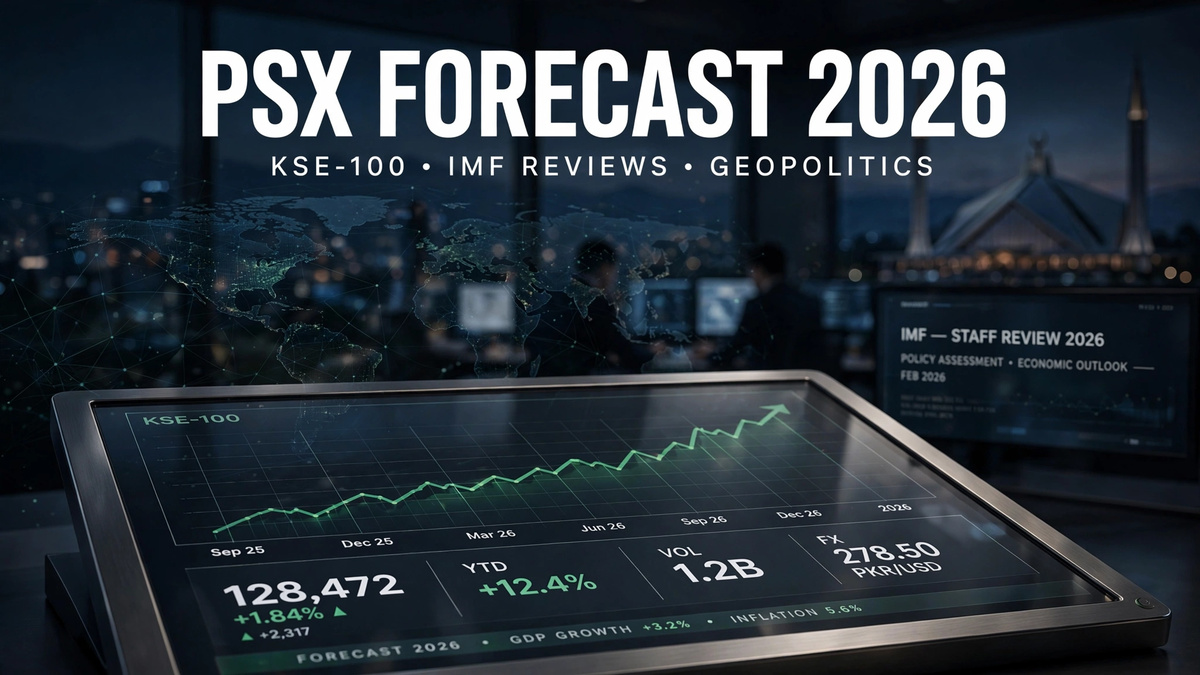
The KSE-100 Index just delivered its third consecutive year as the best-performing major asset class available to Pakistani investors — a 44% rupee-terms gain in FY2026 that outpaced gold, real estate, and fixed income. Yet the same index spent the back half of that fiscal year lurching between rallies triggered by IMF tranche approvals and sell-offs triggered by missile strikes 2,000 kilometers away. For domestic and expat investors weighing exposure to Pakistan’s frontier equity market, the story of 2026 is a tug-of-war between genuine macroeconomic reform and a regional war that keeps interrupting it.
FY26 in Numbers: A Historic Rally, Delivered in Two Very Different Halves
The KSE-100 closed FY2026 (ended June 30) at 180,302 points, a 44% gain in rupee terms and 46% in U.S. dollar terms, according to year-end reports from AKD Research and Topline Securities cited by Profit Pakistan Today. Stack that on top of FY24 and FY25, and the index has delivered a cumulative 335% return in rupee terms — 347% in dollar terms — over three straight years, driven by policy continuity, macroeconomic stabilization, record trading volumes, and Pakistan’s return to international debt markets.
But the FY26 rally was not a straight line. As Business Recorder reported, the first half of FY26 (July–December 2025) delivered a 39% gain, driven by improving economic indicators despite flood-related disruptions. The second half turned sharply volatile: the index touched an intra-period high of 189,167 on January 23, 2026, before the outbreak of the Middle East war in late February triggered a sustained bout of selling that erased much of the gain before a partial recovery into fiscal year-end.
KSE-100 FY26 timeline:
| Period | Level/Move | Driver |
|---|---|---|
| H1 FY26 (Jul–Dec 2025) | +39% | Macro stability, IMF program progress |
| Jan 23, 2026 | Intra-period high: 189,167 | Pre-war peak |
| Feb 28, 2026 | War begins | Middle East conflict onset |
| April 2026 | +14,251 points (+9.6%) to 162,994 | US–Iran ceasefire optimism (short-lived) |
| May 2026 | IMF approves $1.2bn tranche (May 8) | Sentiment recovery |
| June 30, 2026 (FY26 close) | 180,302 | Full-year: +44% |
| September 2026 | ~170,000–171,000 range | Renewed oil shock, Houthi attacks on Saudi facilities |
The IMF Program: Pakistan’s Structural Anchor
Unlike prior boom-bust cycles on the PSX, the FY26 rally has an institutional anchor: Pakistan’s ongoing IMF Extended Fund Facility (EFF) and Resilience and Sustainability Facility (RSF) programs. Pakistan cleared its second and third EFF/RSF reviews in December 2025 and May 2026 respectively, unlocking total disbursements of roughly $4.8 billion, according to Profit Pakistan Today’s FY26 wrap-up.
The next test is imminent. An IMF staff mission was expected to arrive in Pakistan around September 23, 2026, to conduct the fourth EFF review and third RSF review, covering the $7 billion EFF and $1.4 billion RSF programs, according to the Express Tribune. For FY27, the IMF has set an underlying primary balance target of 2% of GDP and an FBR tax revenue target of Rs15.3 trillion — both of which will be closely watched by the market as proxies for continued program compliance.
Pakistan’s external buffers have also strengthened materially. Total liquid foreign exchange reserves rose 5.3% week-on-week to $23.7 billion as of early September 2026, with State Bank of Pakistan reserves at $18.3 billion, pushing import cover up to 2.74 months from 2.56 months, per Tribune reporting. Remittances have been an unsung support: workers’ remittances hit a record $4.3 billion in May 2026, helping the rupee and easing external-account pressure even as the trade balance absorbed a higher energy import bill.
Geopolitics: The Recurring Interruption
Every rally attempt on the PSX in 2026 has been vulnerable to the same external shock: Middle East oil-price spikes. AKD Research’s own commentary has been explicit that “a constructive resolution to ongoing geopolitical tensions remains the key near-term catalyst for direction, with any easing in oil prices expected to trigger a recovery,” as noted in Profit Pakistan Today’s May 2026 outlook.
That pattern has persisted into September. As of the most recent trading sessions, Houthi assaults on Saudi energy facilities pushed crude oil prices higher, weighing directly on investor sentiment on the PSX, according to the Express Tribune’s latest market wrap. A six-member Gulf Cooperation Council bloc was reported to be considering direct talks with Iranian officials over the future of the Strait of Hormuz — a diplomatic track that, if successful, would be the single biggest near-term catalyst for a PSX re-rating, given how tightly correlated the index has become to global crude benchmarks.
Valuation and 2026 Targets
Despite the rally, brokerages continue to argue Pakistani equities remain undervalued relative to history. The KSE-100 was trading at a price-to-earnings ratio of roughly 6.9x as of April 2026, against a longer-run historical average closer to 8.0x, according to AKD Research commentary cited by Profit Pakistan Today.
Brokerage KSE-100 targets for December 2026:
| Brokerage | Target Level | Implied Framing |
|---|---|---|
| Topline Securities | 203,000 | Base case, ~13% total return from mid-2026 levels |
| AKD Research | 263,800 | Bull case, contingent on sustained reform and oil relief |
| Trading Economics (conservative model) | 155,000–156,000 | Short-term stability scenario |
Sector-level positioning matters as much as the index target. Banking (UBL, HBL, Meezan Bank), oil and gas exploration (OGDC, PPL), fertilizers, and cement have been flagged repeatedly by local brokerages as the highest-upside sectors heading into FY27, benefiting respectively from a still-elevated (though easing) policy rate, higher global energy prices, and continued infrastructure and construction demand.
Final Verdict
The KSE-100’s FY26 performance confirms that Pakistan’s macro reform story — anchored in a credible, disbursing IMF program, strengthening FX reserves, and record remittance inflows — is real and durable. But 2026 has also demonstrated that the index’s near-term direction is now a leveraged bet on Middle East de-escalation as much as on domestic policy execution. For frontier-market investors, the base case remains constructive: single-digit trailing P/E multiples, an IMF anchor into FY27, and a currency backed by improving reserves argue for continued exposure. The tactical risk to monitor closely is the September 23 IMF mission outcome and any material escalation around the Strait of Hormuz, either of which could swing the index by double-digit percentages within weeks.
Discover more from The Economy
Subscribe to get the latest posts sent to your email.
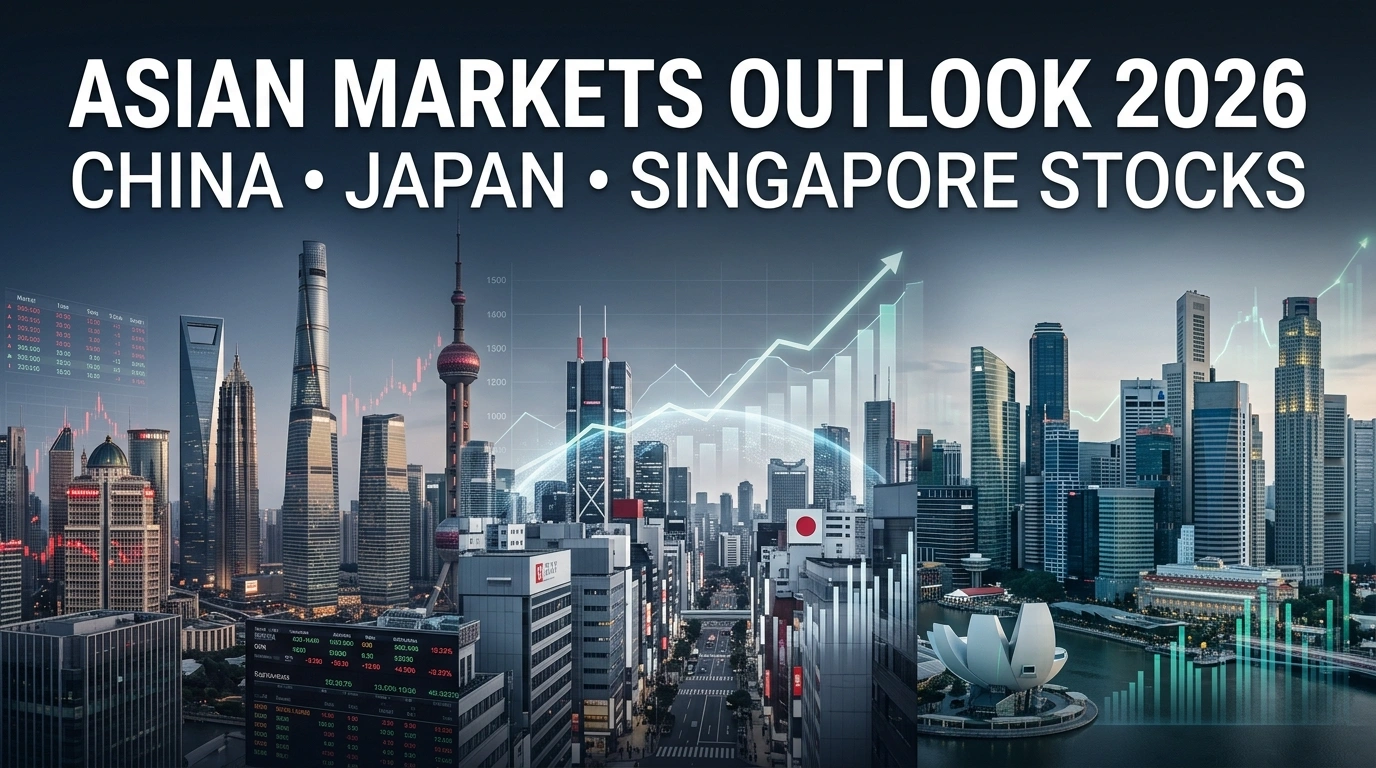
Asia’s three most-watched equity stories in 2026 are pulling in different directions at once. China is finally seeing inflation stir after years of near-deflation. Japan’s Nikkei 225 is riding a semiconductor-driven boom to fresh highs. And Singapore’s Straits Times Index, after touching record territory in January, is now absorbing the same oil-price shock rattling markets worldwide. For investors positioning across the region, understanding why these three markets are diverging matters more than any single index level.
China: Inflation Wakes Up, But It’s an Export Story, Not a Consumption Story
China’s consumer price data has moved from a source of deflation anxiety to a genuinely two-sided story. According to Trading Economics, headline CPI climbed to 0.8% year-on-year in August 2026, up from July’s six-month low of 0.5%, in line with market estimates. Core inflation — stripping out food and energy — rose 1.0% year-on-year, its highest reading in six months.
China inflation trajectory, 2026:
| Month | Headline CPI (YoY) | Core CPI (YoY) | PPI (YoY) |
|---|---|---|---|
| June | 1.0% | — | — |
| July | 0.5% | 0.9% | — |
| August | 0.8% | 1.0% | 3.8% |
The composition matters more than the headline. Non-food inflation accelerated on the back of a sharp jump in transport costs — up 2.5% year-on-year in August versus just 0.4% in July — a direct pass-through from higher global energy prices tied to the Middle East conflict. Food prices, by contrast, fell for a fifth straight month as pork prices remained depressed amid oversupply, per Trading Economics data. Producer prices, which had been negative for over three years, jumped 3.8% year-on-year in August as higher energy and metals costs flowed through industrial supply chains.
The more consequential number for investors sits outside the CPI basket entirely: according to Investing.com, China’s August exports surged 25% year-on-year, with high-tech exports up 42.9% over the first eight months of 2026. China’s growth engine in 2026 is externally driven and AI-hardware-dependent, not a story of reviving domestic consumption — a distinction that should shape sector selection for anyone trading Chinese equities on a China-recovery thesis.
Japan: The Nikkei’s AI-Chip Supercycle
Japan’s equity market has been the standout performer of the region. The Nikkei 225 closed at 67,524.06 on August 11, 2026, up 0.83% on the session, with the broader Topix gaining 0.94% to 4,139, according to CNBC’s market coverage. The rally has been driven almost entirely by semiconductor and AI-infrastructure names rather than a broad-based domestic recovery.
The chip rally has regional reach: South Korea’s SK Hynix rose 3.6% and Samsung Electronics gained 0.8% in the same session tracked by Investing.com, alongside gains for Kioxia and TDK, even as legacy consumer-electronics names like Sony slipped. The catalyst was a fresh wave of AI infrastructure spending signals, including a custom AI chip partnership between Intel, Qualcomm, and Amazon, which reinforced investor conviction that hyperscaler capital expenditure is still accelerating rather than plateauing.
Key Asia-Pacific tech-linked movers (August 2026 session):
| Stock/Index | Move | Driver |
|---|---|---|
| Nikkei 225 | +0.83% to 67,524 | AI/semiconductor demand |
| Kospi | +1.5% (session); +3.68% (separate session, to 6,579) | Chip exports, GDP beat |
| SK Hynix | +3.6% | AI memory chip demand |
| Samsung Electronics | +0.8% | AI memory chip demand |
| Hang Seng | -0.2% to -0.98% | Regional risk-off, oil |
South Korea’s broader economy is corroborating the equity story: GDP grew 0.6% quarter-on-quarter in Q2 2026, beating the 0.2% consensus forecast, with semiconductor exports cited as the primary driver, according to the same Investing.com report. For investors, the read-through is that Japan and Korea’s 2026 equity strength is a leveraged bet on continued global AI capex — a factor that makes both markets more correlated to U.S. hyperscaler earnings than to their own domestic macro conditions.
Singapore: From Record Highs to Oil-Price Headwinds
Singapore told a different story earlier in the year. The Straits Times Index (STI) hit a record high of 4,895 in January 2026, extending gains as Singapore’s economy grew 4.8% in 2025 (accelerating from 4.4% in 2024) and non-oil domestic exports rose 4.8%, comfortably beating official forecasts, according to Trading Economics. The Monetary Authority of Singapore kept policy steady through that rally even as it nudged up its inflation forecast range to 1–2% for the year.
That momentum has since faded. By September 2026, the STI was among the region’s weaker performers, losing 0.6% in a single session as oil-driven inflation concerns spread across Asian equities, per Investing.com — a reminder that Singapore’s trade- and finance-heavy index remains highly exposed to global energy shocks and regional risk sentiment even when domestic fundamentals hold up.
Singapore blue-chip drivers to watch:
- Financials (DBS, OCBC, UOB): most sensitive to regional rate expectations and capital-markets activity
- REITs: benefit from any stabilization in global rate-cut expectations, hurt by energy-driven inflation surprises
- Trade-linked names (Jardine Matheson, Seatrium): direct exposure to shipping and Strait of Hormuz disruption risk
Cross-Market Read for Investors
The three markets are not moving independently — they are three expressions of the same global forces. China’s export-led inflation pickup, Japan and Korea’s chip-driven rally, and Singapore’s vulnerability to oil-price spikes all trace back to two dominant 2026 themes: the AI infrastructure buildout and the Middle East energy shock. A portfolio overweight to Japanese and Korean semiconductor supply chains captures the AI upside; a portfolio concentrated in Singapore financials or Southeast Asian trade proxies carries more direct exposure to the downside risk of a prolonged Strait of Hormuz disruption.
Final Verdict
Asia in 2026 rewards selectivity over broad regional exposure. Japan and South Korea’s AI-chip supercycle remains the highest-conviction structural trade in the region, supported by hard export and GDP data, not just sentiment. China’s inflation uptick is real but externally driven, meaning a bet on Chinese consumer-discretionary recovery is premature. Singapore, for all its 2025 strength, now functions as a barometer of regional oil-shock sensitivity rather than a pure growth play — useful as a hedge indicator, but not currently the region’s highest-conviction long.
Discover more from The Economy
Subscribe to get the latest posts sent to your email.

Best Dividend Stocks 2026: European & Asian Blue Chips

World Bank & IMF Reports 2026: Why the “3% Growth” Consensus Is Actually a Debate

Elon Musk’s Boring Company Hits $23B Valuation After UAE-Led $3 Billion Series D

Middle East War Economics 2026: Oil Prices & Energy Markets

PSX Forecast 2026: KSE-100, IMF Reviews & Geopolitics

Asian Markets Outlook 2026: China, Japan & Singapore Stocks

Global Economy 2026: IMF Growth, Inflation & Private Credit

Current Account Deficit (CAD) : Causes and Impact

Balance of Payments (BOP)

The Falkland Islands Dispute: Sovereign Wealth, Offshore Drilling, and Market Impacts

Gross Domestic Product (GDP): Nominal vs. Real

What is Inflation and the Consumer Price Index (CPI)?

US-China Trade Competition 2026: Supply Chain Relocation Guide

Oil Prices Break $100 in 2026: Middle East Conflict & Energy Markets

State Farm’s $5B Dividend 2026: Who Qualifies & Payout Dates

US-China Relations in Q3 2026: Trade Tariffs and Supply Chain Risks

Gold’s Wild 2026: From a Record $5,600 Peak to a 24% Crash and Back Toward $4,500

Oil Surges as Strait of Hormuz Traffic Collapses Again

The Rocket That Won’t Quit: Inside SpaceX’s Falcon 9 Launch Machine

Bank of England Set to Hold Rates Through Year-End, Reuters Poll Shows

SpaceX Starship Flight 14: First Orbital Attempt & Starlink V3 Launch Explained

The 2026 Crypto Regulatory Shift: What It Means for Institutional Investors

AI Chip Stocks 2026: The Best Semiconductor Investments Beyond Marvell

Retail Earnings Week: What Home Depot, Target & Walmart Reveal

AI-Powered Training: The Next Multi-Billion Dollar Ecosystem in Fitness

Russia’s Black Sea Oil Exports Fall for a Fifth Straight Week

Top 30 Stocks for Investment in PSX for Massive ROI in 2026

Tween Back-to-School Trends 2026: What’s Driving the $85B Season
-

 Markets & Finance8 months ago
Top 15 Stocks for Investment in 2026 in PSX: Your Complete Guide to Pakistan’s Best Investment Opportunities
-

 Analysis7 months ago
Johor’s Investment Boom: The Hidden Costs Behind Malaysia’s Most Ambitious Economic Surge
-

 Analysis7 months ago
Top 10 Stocks for Investment in PSX for Quick Returns in 2026
-

 Analysis7 months ago
Brazil’s Rare Earth Race: US, EU, and China Compete for Critical Minerals as Tensions Rise
-

 Banks8 months ago
Best Investments in Pakistan 2026: Top 10 Low-Price Shares and Long-Term Picks for the PSX
-

 Investment8 months ago
Top 10 Mutual Fund Managers in Pakistan for Investment in 2026: A Comprehensive Guide for Optimal Returns
-

 Global Economy9 months ago
15 Most Lucrative Sectors for Investment in Pakistan: A 2025 Data-Driven Analysis
-

 Global Economy9 months ago
Pakistan’s Export Goldmine: 10 Game-Changing Markets Where Pakistani Businesses Are Winning Big in 2025