
Opinion
SpaceX pitches investors $1.8tn valuation in historic IPO

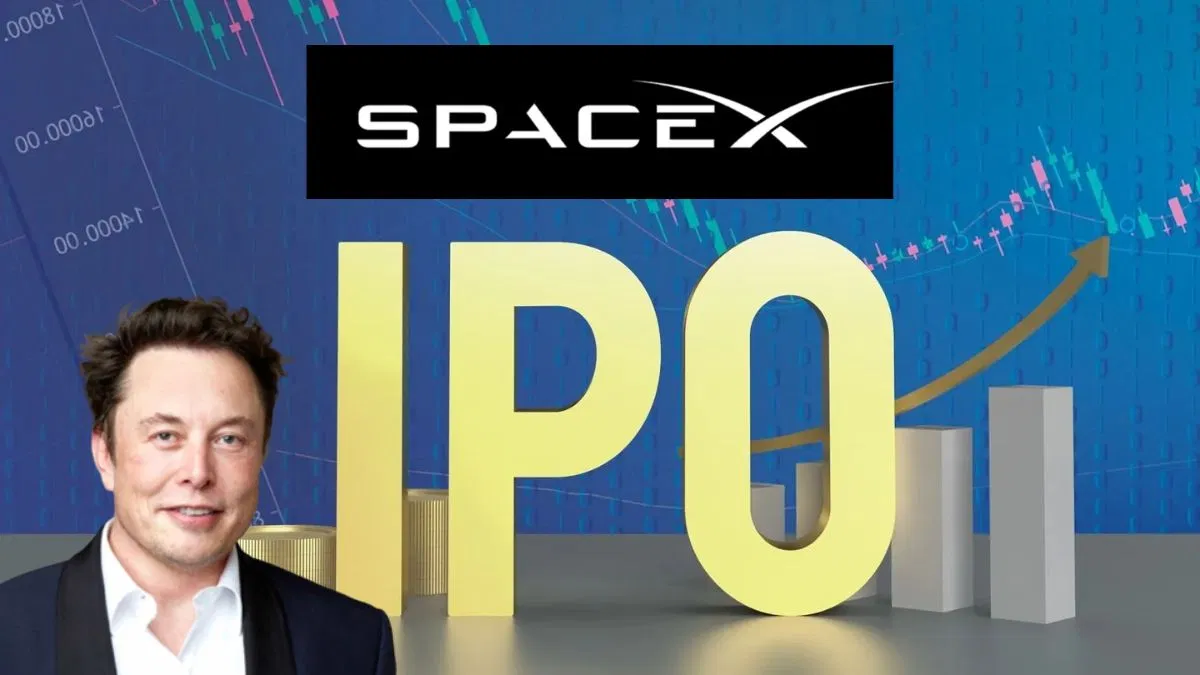
Wall Street has historically priced aerospace like heavy manufacturing—capital intensive, heavily regulated, and grindingly slow. Elon Musk is demanding they price it like software. On a rainy Tuesday in Manhattan this week, SpaceX executives began socializing a public offering that would value the company at $1.8 trillion. It is a staggering figure that would instantly make the launch provider the fourth most valuable public company on Earth, leapfrogging Amazon and Meta. The pitch relies on a fundamental reclassification of what SpaceX actually is: not just a rocket builder, but the sole gatekeeper to the low-Earth orbit economy.
The timing of this liquidity event is entirely deliberate. Institutional appetite for monopoly-grade tech infrastructure has rarely been higher, and SpaceX currently operates without a viable commercial peer. Last year, the company launched 80 percent of all global payload mass to orbit. That operational dominance is translating into extreme financial leverage. According to a recent analysis of aerospace capital markets by Morgan Stanley, the broader space economy is projected to hit $1 trillion in annual revenue by 2040, yet SpaceX’s internal models suggest they will capture the vast majority of that value much sooner. Traditional telecom operators are already ceding ground to Starlink’s direct-to-cell capabilities. Meanwhile, legacy defense contractors are scrambling to match the sheer cadence of the Falcon 9 program. Yet, asking public market investors to swallow a $1.8 trillion market capitalization requires suspending traditional valuation metrics. It is an exercise in pricing a future where humanity’s orbital infrastructure is owned by a single commercial entity.
The Financial Architecture of Orbital Monopoly
The sheer scale of the proposed SpaceX IPO valuation has forced investment banks to aggressively rewrite their risk models. When Gwynne Shotwell, SpaceX’s president and chief operating officer, sat down with syndicate desks on Tuesday, she did not lead with rockets. She led with internet subscriber retention rates. The pitch document, a heavily watermarked 40-page deck, frames the company’s launch vehicle division as a loss-leading delivery mechanism for its true profit engine: the Starlink satellite constellation.
By owning both the delivery trucks (Falcon 9 and Starship) and the cargo (Starlink), SpaceX has insulated itself from the volatile pricing cycles that typically plague commercial spaceflight. They are operating a vertically integrated telecom monopoly, built in an environment where no competitor can afford the shipping costs. It is this structural advantage that underpins the math. According to telecommunications sector reporting by Bloomberg, Starlink alone is projected to generate $22 billion in high-margin, recurring revenue this fiscal year, with gross margins approaching 70 percent.
A traditional price-to-earnings multiple would never yield $1.8 trillion from those figures alone. Instead, the lead underwriters are applying software-as-a-service multiples to a hardware-heavy industrial firm. They argue that once the super-heavy Starship is fully operational, the marginal cost to launch an additional payload drops to near zero. Every new proprietary satellite launched adds pure margin.
This narrative is crucial because retail and institutional buyers alike are effectively being asked to fund a Mars colonization program disguised as a telecommunications offering. The company’s latest financial disclosures, quietly leaked to the Financial Times ahead of the roadshow, reveal that research and development spending for the Starship program consumed nearly $4 billion in free cash flow last year. The SEC filing mechanics currently being drafted include unprecedented lock-up periods for early venture backers, ensuring the stock price does not collapse under sudden insider liquidity.
Investors are not buying a finished product; they are buying an infrastructure monopoly in its aggressive growth phase. Shotwell’s message to Wall Street was starkly clear: you either own the rails to the orbital economy, or you miss the next century of industrial expansion. The $1.8 trillion price tag is simply the toll for entry.
The Synthetic Hedge and the Starlink Spin-off
To understand the architecture of this deal, one must conceptually separate the launch vehicles from the data networks. For years, analysts speculated about a dedicated Starlink spin-off, assuming Musk would eventually isolate the highly profitable internet service from his capital-devouring deep space ambitions. Retaining Starlink within the parent company for the public offering completely alters the investment thesis. It creates a synthetic hedge: earthly cash flows subsidizing interplanetary risk.
Why is SpaceX valued so high?
SpaceX is valued at an unprecedented premium because it holds a functional monopoly on global orbital access while simultaneously operating a high-margin global telecommunications network. By controlling both the launch infrastructure and the world’s largest satellite constellation, the company captures total ecosystem profits that traditional aerospace competitors simply cannot access.
That vertical integration warrants the structural interpretation of SpaceX as an apex predator in the tech sector, rather than a mere aerospace contractor. If Boeing or Lockheed Martin fail to secure a government launch contract, their revenue suffers a direct, isolated blow. If SpaceX loses a contract, they simply pivot that rocket to launch their own revenue-generating assets.
This creates a flywheel effect that public markets have never seen in heavy industry. The more satellites Starlink operates, the lower the latency and higher the bandwidth, which drives aggressive subscriber growth. The revenue from those subscribers directly funds the mass production of Starship in South Texas. Starship, in turn, allows Starlink to deploy massive next-generation satellites that legacy rockets physically cannot carry.
It is a closed-loop economy. The capital markets are being asked to price a company that controls its entire supply chain from raw aluminum to orbital broadband signals. By avoiding a Starlink spin-off, Musk forces investors to buy into the totality of the vision. You cannot simply purchase the predictable cash flows of the internet provider; you must also finance the volatile, explosion-prone reality of the super-heavy lift program.
Still, the initial institutional demand suggests Wall Street is entirely willing to accept these aggressive terms. The scarcity of comparable mega-cap assets leaves portfolio managers with little choice. To be underweight in commercial space over the next decade is to risk missing a macroeconomic shift akin to the rollout of the commercial internet in the late 1990s.
Sovereign Market Shockwaves
The downstream consequences of a $1.8 trillion SpaceX public offering will violently reshape the defense and telecommunications sectors. We are already witnessing the initial tremors in sovereign bond markets and defense procurement strategies in Washington and Brussels. If a single private American corporation commands a market capitalization larger than the GDP of South Korea, the geopolitical balance of power begins to warp around it.
For policymakers, the IPO forces an uncomfortable reckoning. The United States government, specifically the Department of Defense, relies heavily on SpaceX for its most critical national security payloads. A publicly traded SpaceX introduces a rigid new fiduciary dynamic. The company will be legally bound to maximize shareholder value, a mandate that could inevitably clash with the strategic military interests of the Pentagon. How does an asset manager price the risk of the US government nationalizing a launch pad during a geopolitical crisis?
The telecommunications industry faces an even more immediate existential threat. Traditional undersea cable operators and legacy cell tower networks suddenly find themselves competing against an entity with access to near-infinite, zero-interest capital from the public markets. According to recent data compiled by the International Telecommunication Union, the global shift toward space-based direct-to-device internet could strip up to 15 percent of high-margin rural and enterprise revenue from terrestrial carriers within five years.
That sudden loss of revenue will trigger massive, debt-fueled consolidation among ground-based telecom providers. They simply cannot afford the capital expenditure required to build competing satellite constellations when SpaceX charges them retail prices for launch, but charges its internal Starlink division wholesale.
What follows, however, is a profound shift in how venture capital deploys funding in the broader aerospace sector. For the past decade, venture funds have poured billions into smaller launch startups like Rocket Lab and Relativity Space, hoping to unseat the giant. A successful mega-IPO effectively closes the window for viable launch competitors. Instead, capital will flood into upstream space applications—companies building orbital manufacturing facilities, asteroid mining prospectors, and deep-space logistics software. Capital allocators realize they cannot compete with the railroad, so they will start funding the towns along the tracks.
The Bear Case and the Kessler Threat
Not everyone is buying the mathematical gymnastics required to reach the $1.8 trillion mark. A vocal contingent of short-sellers and macroeconomic traditionalists argue that pricing SpaceX purely on its future monopoly status ignores the brutal physics and regulatory vulnerabilities inherent to the aerospace sector.
The crux of the bearish argument rests heavily on the Kessler Syndrome—the theoretical chain reaction of orbital debris that could render low-Earth orbit entirely unusable. By flooding the zone with tens of thousands of Starlink units, SpaceX has radically amplified the risk of a catastrophic orbital collision. A single major debris cascade would not just wipe out a few satellites; it would destroy the company’s entire recurring revenue engine overnight.
Furthermore, treating Starlink’s current profit margins as permanent ignores the incoming wave of sovereign-backed competition. China’s Guowang constellation is actively deploying, subsidized entirely by the state. When a primary competitor does not need to turn a profit, traditional pricing power evaporates instantly.
“The current valuation models are treating orbital dominance as a permanent, defensible moat, which fundamentally misreads the history of physical infrastructure,” notes a highly critical market risk assessment published by Reuters. “When railroad barons achieved this level of market concentration in the 19th century, the inevitable result was heavy-handed government intervention and forced divestiture.”
That said, betting against Musk’s capital-raising abilities has historically been a widow-maker trade on Wall Street. The skeptics point to valid, existential risks, but they often fail to account for the sheer gravitational pull of a story-driven stock in an era dominated by passive index fund flows. If SpaceX enters the S&P 500 at this size, trillions of dollars in automated capital will be forced to buy it blindly, regardless of the underlying debris risks.
Pricing the Vacuum
The financialization of low-Earth orbit was always going to require a suspension of disbelief. To justify a $1.8 trillion valuation, Wall Street must agree to stop treating rockets as heavy machinery and start treating them as physical internet protocols. The syndicate banks are not merely underwriting a public offering; they are attempting to price an entirely new physical domain.
The risks are astronomical, both literally and fiscally. The picture is more complicated than a simple software IPO. Yet, the sheer audacity of the pitch reveals a quiet truth about modern capital markets: there is a profound premium placed on inevitability. Investors are terrified of missing the foundational layer of the next industrial revolution. SpaceX has effectively monopolized access to the vacuum of space, and now it is aggressively monetizing the tollbooth. If the offering succeeds at this valuation, it will permanently sever the aerospace sector from its sluggish, cost-plus contracting past. Gravity is no longer the primary hurdle to orbital expansion; from here on, the only force that matters is liquidity.
Discover more from The Economy
Subscribe to get the latest posts sent to your email.


The global video game industry now generates more annual revenue than the entire GDP of Hungary — and it did so with an audience of 3.6 billion people, close to half of humanity, playing regularly. Gaming has quietly become one of the most reliable case studies in how digital consumerism scales into genuine macroeconomic weight, reshaping everything from U.S. GDP contribution figures to sovereign wealth fund allocation strategy in the Gulf. Here’s the full economic picture as of 2026.
The Headline Numbers: A Market the Size of a Mid-Sized Economy
Sizing the global games market precisely depends heavily on methodology — narrower estimates that track only direct consumer game spending land meaningfully lower than broader “gaming market” figures that fold in hardware, services, and adjacent digital media. Using the more conservative, widely cited Newzoo-based figures, the global games market reached $188.8 billion in 2025 and was forecast to hit roughly $205 billion in 2026, a 4.6% rise, according to SQ Magazine’s 2026 data breakdown. Visa’s own economic analysis frames that 2026 figure in a striking way: at roughly $205 billion, the games market is now “close to the value of a mid-sized European economy such as Hungary,” according to Visa’s consulting and analytics team.
Broader market-sizing methodologies that include hardware and adjacent digital services put the figure considerably higher — Statista’s forecast projects $577.9 billion in 2026 games-market revenue growing at a 6.58% CAGR through 2030, while other industry trackers cite figures ranging from $250 billion to over $400 billion depending on scope, according to a range of 2026 market reports from Straits Research, Mordor Intelligence, and Grand View Research. Whichever methodology is used, the direction is consistent: gaming is one of the fastest-structurally-growing segments of the global entertainment economy, and unlike film or television, its growth curve has held up through multiple macroeconomic cycles.
Gaming market size by source (2026 estimates — note methodology varies):
| Source | 2026 Estimate | Scope |
|---|---|---|
| Newzoo / SQ Magazine | $205 billion | Direct consumer game spend |
| Visa Consulting | $205 billion | Consistent with Newzoo |
| Straits Research | $250.9 billion | Broader market definition |
| Mordor Intelligence | $224.7 billion | Platform + regional breakdown |
| Grand View Research | $374.8 billion | Includes adjacent segments |
| Statista Market Forecast | $577.9 billion | Broadest — includes hardware/services |
The Player Base: Nearly Half the Planet
The scale of gaming’s consumer base is the real driver of its macroeconomic relevance. The worldwide player base reached 3.58 billion in 2025 — over 60% of the world’s online population — and is forecast to approach 4 billion by 2028, according to Newzoo data cited by SQ Magazine. Visa’s analysis separately projects 3.8 billion gamers by 2026, or nearly half the world’s population.
Mobile dominates that base by a wide margin: mobile gaming reaches roughly 3 billion players (83% of all gamers), well ahead of PC at 936 million and console at 645 million, per SQ Magazine’s 2026 breakdown. That platform split matters commercially — mobile also leads on revenue share at 55% of total industry spend, even though console posted the fastest year-on-year segment growth in 2025 at +5.5%.
Regional revenue leaders (2025 data):
| Region | Revenue | Notes |
|---|---|---|
| Asia-Pacific | $87.6 billion | Largest region by revenue |
| North America | $52.7 billion | — |
| China | $49.8 billion | Largest single country |
| United States | $49.6 billion | Close second to China |
The U.S. Case Study: Gaming as Measurable GDP Contribution
Gaming’s economic footprint is now formally tracked as a discrete GDP contributor in the United States. The Entertainment Software Association’s 2026 Economic Impact Report put the U.S. video game industry’s contribution to GDP at $65.5 billion for 2025, with total economic impact — including indirect and induced effects — reaching $95.8 billion, according to SQ Magazine’s summary of ESA data. U.S. weekly players reached 212.3 million, up 3% year-on-year, with the average American player now 37 years old — decisively undercutting the persistent stereotype that gaming is a youth-only pastime.
Emerging Markets: Where the Growth Actually Is
While mature markets like the U.S. and Europe have been largely flat, emerging markets have driven the sharpest growth in mobile game consumer spending. Turkey grew mobile game spending 28% year-on-year, Mexico grew 21%, and India grew 17% in 2024, according to SensorTower data cited by Udonis’ gaming industry report. By contrast, Japan’s mobile gaming revenue actually fell roughly 7% amid domestic economic headwinds during the same period — a reminder that even within a structurally growing global category, individual national markets remain exposed to local macroeconomic conditions.
The Middle East’s Sovereign-Fund Bet on Gaming
Perhaps the clearest sign that gaming has become genuine macroeconomic infrastructure — rather than just consumer entertainment — is the scale of Gulf state investment in the sector. Saudi Arabia has pledged $38 billion toward gaming and esports development, explicitly targeting a $13.3 billion contribution to its own GDP and 39,000 new jobs by 2030, according to Mordor Intelligence’s 2026 regional analysis. Riyadh’s Esports World Cup functions as the public-facing showcase of that sovereign-fund ambition, while the UAE has separately built out incentive programs to attract regional game publishing operations. The Middle East and North Africa region is now growing at a 9.16% CAGR, nearly matching the global average — a striking figure for a region with no prior gaming-industry legacy infrastructure to build on.
The Creator Economy Layer
Gaming’s economic footprint extends beyond direct game sales into an increasingly monetized creator and streaming layer. Total live-streaming hours watched grew approximately 12% in 2024 to 32.5 billion hours, according to Stream Hatchet data cited by Udonis, reversing a slight 2022 dip. Major publishers now build content-creator outreach into launch strategy as standard practice, and esports co-streaming arrangements — where popular streamers broadcast alongside official tournament coverage — have become a deliberate audience-expansion tool for titles like League of Legends and Valorant.
Layoffs Amid Growth: The Industry’s Own Contradiction
Despite the headline growth figures, the games industry has simultaneously undergone significant workforce contraction. Over 10,000 game developer jobs were cut in 2023 alone amid post-pandemic economic tightening and project cancellations, according to Udonis — a pattern that has pushed surviving studios toward cross-platform-first development from day one, using engines that deploy to PC, console, and mobile simultaneously with minimal additional engineering cost, maximizing revenue reach per unit of development spend.
Final Verdict
Gaming’s 2026 economic story is less about any single blockbuster launch and more about scale of ordinary, recurring consumer spending compounding across nearly 4 billion people globally. Whether measured conservatively at roughly $205 billion or more expansively above $500 billion depending on methodology, the industry has crossed a threshold where national governments — not just corporate boardrooms — now treat it as deliberate economic infrastructure, exemplified by Saudi Arabia’s $38 billion sovereign bet and the U.S. government’s own formal GDP-contribution tracking through the ESA. For investors and policymakers alike, the more useful lens going forward is not “is gaming growing” — that question is settled — but which regional and platform segments (emerging-market mobile spend, Gulf sovereign-backed esports infrastructure, and the creator-economy layer built on top of both) capture the next leg of that growth.
Discover more from The Economy
Subscribe to get the latest posts sent to your email.
Two of the world’s most authoritative economic institutions have published starkly different verdicts on the global economy in 2026 — and the gap between them tells you more about the state of the world than either number alone. The IMF’s most recent projection puts global growth at 3.0% for 2026. The World Bank, using a different methodology and a more pessimistic read on the Middle East war’s fallout, puts the same year at 2.5% — the weakest rate since the COVID-19 pandemic. Understanding why these two numbers diverge is essential for anyone allocating capital across the world’s largest economies in the second half of 2026.
The IMF’s Case: Resilience Interrupted, Not Broken
The IMF entered 2026 with genuine optimism. Its January 2026 World Economic Outlook Update projected 3.3% global growth for the year — a small upward revision from October 2025 — crediting technology investment, fiscal and monetary support, and private-sector adaptability for offsetting ongoing trade-policy disruption.
The outbreak of war in the Middle East on February 28 forced a rapid downward revision. The April 2026 World Economic Outlook, titled pointedly “Global Economy in the Shadow of War,” cut the 2026 forecast to 3.1%, warning that a longer or broader conflict, a reassessment of AI-driven productivity expectations, or renewed trade tensions could weaken growth significantly further. By the July 2026 update, the figure had settled at 3.0% for 2026, rising to 3.4% in 2027 — a forecast the IMF frames as “broadly unchanged cumulatively” from April, arguing that AI-driven demand lifting technology-integrated economies is offsetting the war’s drag on energy importers.
IMF global growth revisions through 2026:
| Report Date | 2026 Projection | 2027 Projection | Key Framing |
|---|---|---|---|
| January 2026 | 3.3% | 3.2% | “Steady amid Divergent Forces” |
| April 2026 | 3.1% | 3.2% | “Shadow of War” |
| July 2026 | 3.0% | 3.4% | “Crosscurrents of War and Technology” |
The World Bank’s Case: The Weakest Growth Since COVID
The World Bank’s Global Economic Prospects report tells a more sobering story. Its June 2026 edition cut global growth to 2.5% for 2026, down from 2.9% in 2025 — explicitly the lowest rate since the onset of the COVID-19 pandemic. Forecasts for two-thirds of the world’s economies were downgraded relative to the World Bank’s own January 2026 report, which had initially projected 2.6% growth for the year.
World Bank Group Chief Economist Indermit Gill did not mince words in the report’s foreword, warning per the World Bank’s own press release that the 2020s remain on track to be the weakest decade for global growth since the 1960s, and that “virtually half of all developing economies have failed since 2019 to advance on the most rudimentary promise of development: narrowing the income gap with the world’s most prosperous economies.”
World Bank global growth revisions:
| Report Date | 2026 Projection | Context |
|---|---|---|
| January 2026 | 2.6% | Up from June 2025 forecast, driven by U.S. strength |
| June 2026 | 2.5% | Lowest since COVID-19; Middle East war impact |
| 2027 (June forecast) | 2.8% | Still 0.4pp below 2010s average |
Why the Numbers Don’t Match: Methodology, Not Disagreement on Facts
The roughly half-a-percentage-point gap between the IMF’s 3.0% and the World Bank’s 2.5% is not really a disagreement about the war’s severity — both institutions cite the same core shock. It reflects different weighting of technology-driven offsetting growth versus energy-importer drag, and different treatment of emerging-market vulnerability. The World Bank’s framing emphasizes that growth in low-income countries (LICs) is expected to reach 5.4% in 2026, 0.3 percentage points lower than previous forecasts specifically because of the conflict, with real per-capita GDP growth across LICs averaging only about 2.7% through 2026–28 — insufficient, in the Bank’s own assessment, to meaningfully reduce poverty.
Breaking Down the Big Economies
Both institutions converge more closely at the country level than at the global aggregate, which is instructive for investors trying to translate the headline debate into portfolio decisions.
2026 growth projections by major economy/bloc:
| Economy/Bloc | Projection | Source |
|---|---|---|
| United States | 2.2%–2.4% | World Bank (2.2%) / IMF (2.4%) |
| Advanced economies (aggregate) | 1.7%–1.8% | IMF |
| GCC states | 4.4% | World Bank |
| MENAP region (incl. Pakistan) | 3.6% | World Bank |
| Low-income countries | 5.4% | World Bank / IMF |
| Global (IMF) | 3.0% | IMF, July 2026 |
| Global (World Bank) | 2.5% | World Bank, June 2026 |
The United States is the one major economy where both institutions agree growth is holding up better than expected, with the World Bank crediting the U.S. for roughly two-thirds of its own upward revision to global growth back in January — before the war reversed some of that optimism. Gulf Cooperation Council economies are the other standout, benefiting directly from elevated oil prices even as the same conflict drags down oil-importing peers.
Inflation: The Shared Warning
Both reports converge on inflation risk. The IMF’s April 2026 outlook explicitly modeled inflation rising to 4.4% globally under its reference war scenario, a sharp reversal from the disinflation trend of 2024–25. The World Bank similarly flagged that headline inflation expectations have risen broadly across emerging markets and developing economies, with local-currency bond yields and external spreads remaining elevated in commodity-importing nations specifically because of the conflict’s pass-through to energy and food costs.
What This Means for Asset Allocation
The practical takeaway from the IMF-World Bank gap is that “global growth” is now a genuinely bimodal concept in 2026: technology-exposed and energy-exporting economies are outperforming, while energy-importing emerging markets and low-income countries are absorbing a disproportionate share of the war-driven slowdown. A portfolio built around a single “global growth” assumption risks missing this bifurcation entirely — the more useful lens for 2026 is regional and sectoral, not aggregate.
Final Verdict
The IMF’s 3.0% and the World Bank’s 2.5% are not competing predictions so much as two honest readings of the same uncertain war-affected environment, filtered through different modeling emphasis. What both institutions agree on matters more than where they diverge: growth in 2026 is meaningfully weaker than it would have been absent the Middle East conflict, inflation risk has returned after two years of disinflation, and the burden of the shock is falling disproportionately on energy-importing emerging markets rather than being evenly distributed. Investors and policymakers should treat both the 3.0% and 2.5% figures as bookends of a realistic range rather than seeking a single “correct” number — and should watch the IMF’s next scheduled update for whether the numbers converge toward the optimistic or pessimistic end as the war’s duration becomes clearer.
Discover more from The Economy
Subscribe to get the latest posts sent to your email.
Six months into the war between the United States, Israel, and Iran, one pattern has become unmistakable to energy traders: every reported ceasefire has been followed, sooner or later, by a fresh escalation. What started as a limited conflict on February 28, 2026, has evolved into the most disruptive geopolitical shock to global oil supply since Russia’s invasion of Ukraine — and as of September 2026, it is still actively reshaping energy markets, shipping routes, and inflation forecasts worldwide.
The Ceasefire-and-Relapse Cycle
The conflict has produced at least three distinct ceasefire announcements since February, and none has held for more than a few weeks. In April 2026, a US-Iran arrangement briefly reopened the Strait of Hormuz and sent oil plunging below $100 a barrel, as reported by Euronews. Gold, which had surged as a safe haven, still traded near $4,750 an ounce that same week as investors openly doubted the truce would last, according to Trading Economics — key disputes remained unresolved and the Strait stayed effectively closed even after the announcement.
That skepticism proved warranted. By September 2026, oil had round-tripped decisively higher. Brent crude surpassed $100 a barrel for the first time in nearly six weeks after fresh attacks on oil facilities and tankers, settling at $97.89 before jumping 2.4% to $100.29, with WTI gaining to $94.77, according to reporting carried by the Washington Times. The proximate trigger: the U.S. military struck five Iranian tankers in response to attempted missile attacks on a Navy warship, while Iranian-backed Houthi forces ignited fires at Saudi Arabian oil facilities.
Oil price trajectory during the conflict:
| Date | Brent Crude | Context |
|---|---|---|
| Mar 21, 2026 | ~$106.77 | Fifth straight weekly gain amid escalation |
| Mar 20, 2026 | Forecast warning of $180+ | Saudi Aramco officials warned WSJ of extreme scenario |
| Apr 8, 2026 | Below $100 | Ceasefire announcement, Strait reopening pledge |
| Sept 7, 2026 | $97.31 | Six-week high; Iran vows to strike energy infrastructure |
| Sept 9, 2026 | $100.29 | Attacks on tankers and Saudi refineries |
| Sept 11, 2026 | ~$100, +9% week | Diplomatic talks announced on Hormuz shipping |
Why the Strait of Hormuz Is the Real Story
The Strait of Hormuz is the fulcrum of this entire crisis. Roughly 20% of the world’s oil supply passes through this chokepoint, including about half of Asia’s oil imports and a quarter of its LNG imports, according to TD Economics. Since the war began, fighting has halted most shipping through the strait, and — critically — markets have stopped believing repeated U.S. government proclamations that reopening is imminent. As one energy analyst told Marketplace, “The Strait of Hormuz won’t be what it was before. Now, we understand that Iran can and will block it.”
The physical impact on trade flows has been severe. Oil shipments out of the Middle East are running roughly 65% below year-ago levels, and the cost of shipping crude to Asia on the largest tankers has hit a record high, per the same Marketplace reporting. The United Arab Emirates has responded by actively building alternative export routes and trade corridors to avoid having its energy exports “held hostage” by the conflict, a senior UAE presidential adviser confirmed to Reuters in early September.
Demand Destruction Is Now the Dominant Theme
While supply disruption drove the initial price spike, the market’s focus by September 2026 has shifted decisively toward demand destruction. The International Energy Agency sharply lowered its 2026 global oil demand outlook, forecasting a contraction of 2.5 million barrels per day — the largest annual decline since the COVID-19 pandemic — as higher prices and tighter supply weigh on consumption, according to Trading Economics. OPEC has cut its own demand-growth forecast for a fifth consecutive month. Both organizations now agree that sustained triple-digit oil is actively destroying the demand it was created by.
OPEC+ itself has opted for caution rather than aggressive supply response, keeping its October output policy unchanged at its early-September meeting, pending agreement on new quotas before any further steps, Reuters reported.
The Inflation and Consumer Pass-Through
The war’s inflationary impact has already shown up in hard data. U.S. gasoline prices surged in March 2026 to an EIA-reported average of $3.638 per gallon, the highest since September 2023, with AAA data showing the national average briefly topping $4.02 per gallon — a monthly jump described by Trading Economics as exceeding even the spikes following Hurricane Katrina and Russia’s 2022 invasion of Ukraine. Euro-area inflation jumped to 2.5% in the same window, well above the European Central Bank’s 2% target, driven almost entirely by the energy component.
Who is most exposed:
| Category | Exposure | Why |
|---|---|---|
| Asian oil importers (Japan, India, Pakistan, China) | Very high | ~50% of Asia’s oil, 25% of LNG via Hormuz |
| European energy consumers | High | Already strained post-Russia diversification |
| Gulf oil exporters (Saudi, UAE, Qatar) | Mixed | Higher prices offset by direct attack risk on infrastructure |
| U.S. consumers | Moderate-high | Domestic production buffers some but not all of the shock |
| Global shipping/logistics | High | Record tanker rates, rerouting costs |
Diplomatic Off-Ramps Being Tested
The most significant near-term catalyst for de-escalation is the diplomatic track around Strait of Hormuz shipping management. Top diplomats from the six-member Gulf Cooperation Council were scheduled to meet their Iranian counterpart to negotiate a possible temporary arrangement for managing transit through the strait, according to Trading Economics. Iranian state media separately indicated Tehran would meet Gulf states in Oman for related talks. Markets have priced in modest optimism around these talks — crude paused its rally and settled near $100 on the news — but given the track record of failed ceasefires since February, traders are treating any de-escalation as tactical rather than durable until physical shipping data confirms a sustained reopening.
Final Verdict
The “ceasefire economics” of the 2026 Middle East war have proven to be a recurring, not a resolving, phenomenon: each truce has produced a short-lived relief rally in oil and a corresponding dip in inflation expectations, followed by renewed escalation that erases the gains. As of September 2026, Brent and WTI sit near six-week highs above $90–100, the Strait of Hormuz remains functionally impaired, and both the IEA and OPEC now forecast the sharpest demand contraction since the pandemic. For investors and policymakers, the actionable conclusion is that oil-price volatility itself — not a stable higher or lower price level — is the defining condition of this market, and near-term direction hinges almost entirely on whether the current Gulf-Iran diplomatic track produces a verifiable, physically confirmed reopening of shipping lanes rather than another rhetorical ceasefire.
Discover more from The Economy
Subscribe to get the latest posts sent to your email.

Stock Market Crash 2026? How the Trump $5,000 Dividend Impacts Global Inflation

Tax-to-GDP Ratio Explained: Global Benchmarks, Fiscal Sovereignty & 2026 Insights

Trade Deficit & Terms of Trade Explained: Global Impact, Real-World Examples, and 2026 Insights

Supply vs Demand Shocks Explained: Market Equilibrium, Inflation Risks & Policy Responses in 2026

Microeconomics vs. Macroeconomics Explained: Key Differences, Interdependence & Global Impact

Devaluation vs Depreciation: Clear Differences, Causes, and Economic Impact

Purchasing Power Parity (PPP) Explained: Global Rankings, Living Standards & Why Nominal Exchange Rates Mislead in 2026

Remittances 2026: Global Trends, Household Resilience & Economic Lifeline for Developing Nations

Stagflation Explained: Causes, Global Impact & 2026 Economic Outlook

Understanding Foreign Exchange Reserves: Key Purposes and Global Impact

The Business of Gaming and Tech: How Global Economies Are Driven by Digital Consumerism

Crypto Daily Outlook: Bitcoin, Altcoins, and the Future of Decentralized Finance

Anthony Scaramucci’s Crypto Prediction: Why MicroStrategy’s Move Is Bitcoin’s “iPhone Moment”

Best Dividend Stocks 2026: European & Asian Blue Chips

State Farm’s $5B Dividend 2026: Who Qualifies & Payout Dates

US-China Relations in Q3 2026: Trade Tariffs and Supply Chain Risks

Gold’s Wild 2026: From a Record $5,600 Peak to a 24% Crash and Back Toward $4,500

Oil Surges as Strait of Hormuz Traffic Collapses Again

The Rocket That Won’t Quit: Inside SpaceX’s Falcon 9 Launch Machine

Bank of England Set to Hold Rates Through Year-End, Reuters Poll Shows

SpaceX Starship Flight 14: First Orbital Attempt & Starlink V3 Launch Explained

The 2026 Crypto Regulatory Shift: What It Means for Institutional Investors

Top 30 Stocks for Investment in PSX for Massive ROI in 2026

AI Chip Stocks 2026: The Best Semiconductor Investments Beyond Marvell

Retail Earnings Week: What Home Depot, Target & Walmart Reveal

AI-Powered Training: The Next Multi-Billion Dollar Ecosystem in Fitness

Russia’s Black Sea Oil Exports Fall for a Fifth Straight Week

Tween Back-to-School Trends 2026: What’s Driving the $85B Season
-

 Markets & Finance8 months ago
Top 15 Stocks for Investment in 2026 in PSX: Your Complete Guide to Pakistan’s Best Investment Opportunities
-

 Analysis7 months ago
Johor’s Investment Boom: The Hidden Costs Behind Malaysia’s Most Ambitious Economic Surge
-

 Analysis7 months ago
Top 10 Stocks for Investment in PSX for Quick Returns in 2026
-

 Analysis7 months ago
Brazil’s Rare Earth Race: US, EU, and China Compete for Critical Minerals as Tensions Rise
-

 Banks8 months ago
Best Investments in Pakistan 2026: Top 10 Low-Price Shares and Long-Term Picks for the PSX
-

 Investment8 months ago
Top 10 Mutual Fund Managers in Pakistan for Investment in 2026: A Comprehensive Guide for Optimal Returns
-

 Global Economy9 months ago
15 Most Lucrative Sectors for Investment in Pakistan: A 2025 Data-Driven Analysis
-

 Global Economy9 months ago
Pakistan’s Export Goldmine: 10 Game-Changing Markets Where Pakistani Businesses Are Winning Big in 2025