
Economics
Microeconomics vs. Macroeconomics Explained: Key Differences, Interdependence & Global Impact


The Dual Lenses of Economic Analysis: From Individual Behavior to Global Markets
The vast and complex discipline of economics is traditionally divided into two distinct yet deeply interconnected branches: Microeconomics and Macroeconomics. To understand how financial systems operate, readers of Thefinance.pk and economist.media must master both perspectives.
While microeconomics zooms in on the microscopic decisions made by individual agents in specific markets, macroeconomics zooms out to analyze the sweeping forces governing entire national economies and global trade networks.
Microeconomics: The Science of Individual Choices
Microeconomics (from the Greek word mikros, meaning “small”) is the study of economic behavior and decision-making by individual consumers, households, and business firms. It examines how scarce resources are allocated among competing uses on a granular level.
Key pillars of microeconomic analysis include:
- Supply and Demand Theory: How the price of a specific good or service is determined in a competitive market based on consumer willingness to buy and producer willingness to sell.
- Consumer Choice Theory: How individuals maximize their personal utility (satisfaction) given limited budgets and varying preferences.
- Theory of the Firm: How businesses decide what products to manufacture, how much labor to hire, what pricing strategies to adopt, and how to minimize production costs to maximize profit margins.
- Market Structures: Analyzing how different levels of competition—ranging from perfect competition and monopolistic competition to oligopolies and monopolies—affect pricing and efficiency.
For a local business owner or corporate strategist, microeconomic principles dictate daily operational decisions, such as setting optimal retail prices or managing supply chain inventories.
Macroeconomics: The Study of the Forest
Macroeconomics (from the Greek word makros, meaning “large”) steps back to examine the economy as an integrated whole. Instead of looking at the price of a single cup of coffee or the wages paid by a single local factory, macroeconomics analyzes economy-wide aggregates and indicators.
Core focus areas of macroeconomics include:
- Gross Domestic Product (GDP): Measuring total national economic output and growth rates.
- Inflation and Price Indexes: Tracking the general price level and the erosion of purchasing power across the entire country.
- Unemployment and Labor Markets: Assessing national job creation, structural unemployment rates, and wage trends.
- Monetary and Fiscal Policy: Studying how central banks manage interest rates and how governments manage taxation and public debt to stabilize business cycles.
Macroeconomic trends create the overarching economic climate within which microeconomic actors must operate. For example, when a central bank raises the macro policy rate, it fundamentally alters the microeconomic borrowing costs for every individual household and startup business in the country.
The Interdependence of Micro and Macro
Though studied separately, micro and macroeconomics are deeply intertwined. Modern economic theory emphasizes microfoundations—the idea that macroeconomic models must be built upon a solid understanding of individual microeconomic behavior.
When consumers panic during a high-inflation environment (a macro event), they alter their individual shopping habits and demand higher wages (micro actions). Conversely, millions of individual business decisions to freeze hiring or expand factories collectively shape the national GDP growth rate.
Key Takeaways:
- Microeconomics focuses on individual consumer and corporate behavior, pricing, and market structures.
- Macroeconomics analyzes economy-wide aggregates, including GDP, inflation, unemployment, and monetary policy.
- Both disciplines are interdependent, with macroeconomic climates dictating microeconomic constraints, and micro actions driving macro trends.
Authoritative Sources & Further Reading:
- National Bureau of Economic Research (NBER): Micro and Macro Research Portals
- American Economic Association (AEA): Economic Journals and Frameworks
Discover more from The Economy
Subscribe to get the latest posts sent to your email.



The Federal Open Market Committee left its target range unchanged at 3.75%-4.00% on Wednesday 28 October, according to Admiral Markets’ FOMC summary. The vote was 10-2. The two dissenters, Governor Lisa Cook and Cleveland Fed President Beth Hammack, wanted to raise rates by 25 basis points. A committee that is split towards tightening rather than easing is a notable shift in tone.
The statement pointed to strong economic growth and elevated inflation. Chair Kevin Warsh said the committee held to gather more information, and he floated cutting the number of rate decisions from eight to six a year, per Trading Economics.
Why the Dissents Matter More Than the Hold
A hold was expected. The significance is the direction of dissent. Two voters wanting a hike signals that part of the committee sees inflation risks, aggravated by energy prices from the Middle East conflict, as large enough to justify tightening now. FXStreet and MUFG Research both framed the outcome as a hold with a hawkish edge, with the committee not explicitly committing to further hikes but not ruling them out.
MUFG’s read is that a December hike remains live, with more of another move priced by March. On Thursday, Reuters reported the CME FedWatch tool showing roughly a 90% chance of a December hike. That pricing, rather than the unchanged rate, is what moved currencies and precious metals around the decision.
The Inflation Problem Is an Energy Problem
The Fed’s challenge is that the inflation pressure is not purely domestic demand. Brent oil has climbed to around $115, a six-month high, as attacks on tankers and Saudi infrastructure keep supply worries alive, and Iran is weighing a Qatari draft deal that could ease or inflame the market depending on the answer. Central banks cannot lower oil prices with interest rates, but they can stop an energy shock from becoming embedded in wages and expectations, which is the argument the hawkish dissenters appear to be making.
Market Reaction
Crude oil barely moved on the decision, according to FXStreet, as traders waited on Iran’s response to the Qatari proposal. Gold slid toward $4,000 an ounce on Thursday after US Q3 growth printed at 3.4% and core PCE at 2.5%, per Kitco, with the 10-year yield near 5%.
What It Means Beyond the US
- Emerging markets: a Fed leaning hawkish tightens global financial conditions and raises the bar for easing elsewhere. Pakistan’s central bank raised its policy rate to 12% two days before the Fed meeting for domestic inflation reasons, but a firmer dollar adds pressure to the rupee.
- Gulf central banks: several Gulf central banks held rates after the decision, since their currencies are pegged to the dollar.
- Asia-Pacific: officials such as RBNZ’s governor have said another hike is plausible if inflation does not ease.
What to Watch Before December
- Inflation data: the next PCE and CPI prints will decide whether the dissenters gain allies.
- Oil: Iran’s reply on the Qatari draft, due by the end of the week, is the biggest swing factor. A deal would remove part of the hawks’ case; a breakdown would strengthen it.
- Chair Warsh’s messaging: his comments on the balance between AI-driven productivity and inflation risk.
- Labour market data ahead of the December meeting.
The Fed held, but the committee is no longer debating how fast to cut. It is debating whether to hike. Unless oil retreats, the December meeting is genuinely open.
Discover more from The Economy
Subscribe to get the latest posts sent to your email.

An AI neocloud can announce billions of dollars of contracted demand and still face a dangerous financial squeeze. The business typically commits large amounts of capital to graphics processing units, networking hardware, data-center facilities, electricity and financing well before every installed GPU begins generating revenue. If customers use the capacity intensively and pay on time, the model can produce attractive operating leverage. If hardware arrives late, sits idle or loses value quickly, financial costs do not wait for demand to recover.
That tension is the central question in neocloud economics in 2026. An important real-world reference is the second-quarter report by CoreWeave, which disclosed around $104 billion in revenue backlog at June 30, 2026 and rapid expansion in infrastructure spending. A backlog provides visibility but is not cash already received, booked profit or a guarantee that hardware will be deployed on schedule. Investors should follow the money from purchase commitment through installation, utilization, billing, cash collection and debt service.
What an AI neocloud actually sells
A neocloud primarily offers accelerated compute capacity, often optimized for training and serving large AI systems. Customers can rent GPU clusters and the supporting networking, storage, software and operations needed to use them. Some agreements reserve substantial capacity over time; others are more exposed to usage or shorter contract duration. The seller is not necessarily producing proprietary AI models. Its principal economic product may be reliable access to expensive compute.
The model differs from that of the biggest diversified cloud companies. A hyperscaler can spread data-center assets over many services, customers and uses. A specialist may offer a strong technical product while being more concentrated in AI infrastructure and dependent on a smaller set of important customers. Concentration can accelerate growth when large clients sign agreements, but it can also magnify a cancellation, renegotiation or project delay.
Providers vary considerably. A modern dedicated AI cluster with high-speed interconnects is not interchangeable with a small assortment of standalone graphics cards. Training requires systems that exchange large volumes of information efficiently; inference may be optimized differently. Capacity quality, energy availability and networking topology can all affect the price customers are willing to pay.
Follow the life of a GPU, not just the booking headline
There are six economically meaningful stages. First, a neocloud signs a customer commitment or forecasts demand. Second, it orders equipment and secures data-center capacity. Third, facilities and electrical systems become ready. Fourth, GPUs are installed, tested and connected. Fifth, customers actually consume or reserve the service under their contracts. Sixth, the neocloud collects cash while continuing to pay for electricity, people, maintenance, financing and future equipment.
A problem at any handoff can destroy expected margin. A delivery delay keeps the company from billing for some capacity but may not eliminate its facility, interest or operating costs. A data-center power delay can leave valuable hardware waiting. A customer shifting workloads to a different architecture can weaken expected pricing. Even fully installed machines may be subject to planned maintenance, software deployment or other non-billable periods.
The CoreWeave Form 10-Q discusses capital investment, operating risks and business concentration. This is why a careful comparison examines realized utilization and cash-flow generation, not only contracted GPU counts or announced megawatts.
Backlog is visibility, not a bank account
CoreWeave stated that its backlog reached approximately $104 billion at the end of Q2 2026. Its official earnings release separately explained that the disclosed backlog did not include more than $25 billion in net new customer commitments added in early Q3. These figures demonstrate demand and long-term contracting, but treating them as the company’s current revenue would be incorrect.
A contracted backlog must turn into recognized revenue according to delivery and availability requirements. That conversion can span years. Contracts may have conditions, customer concentration or renegotiation and timing risks. Even when the client eventually pays in full, the neocloud might finance new equipment long before the payment is received. The timing of cash is as consequential as its contractual total.
Investors should therefore ask four questions: What share of backlog is expected to be recognized in the next twelve months? What has to be constructed or purchased before billing? How much cash will customers pay upfront or during deployment? And what remedies or flexibility exist if delivery is delayed? Not all disclosures answer each question. Where details are unavailable, valuation should not quietly assume the most favorable response.
An illustrative one-thousand-GPU unit-economics model
Consider a fictional 1,000-GPU deployment. The following assumptions are teaching tools, not a quote from an equipment supplier, a current rental tariff, CoreWeave guidance or a forecast for any listed company. Assume total installed hardware and associated capital cost of $50 million, depreciated economically over four years; a blended realized billable rate of $4.00 per GPU-hour; annualized utilization of 75%; power and site operating cost of $8 million annually; and annual financing cost of $3 million. Ignore taxes, overhead not listed and capital structure complexities for the first pass.
The 1,000 GPUs offer 8.76 million available GPU-hours per year (1,000 × 24 × 365). At 75% utilization, the billable hours are 6.57 million. Multiplied by $4, annual revenue would be $26.28 million. Annual equipment depreciation on a straight-line four-year illustrative basis is $12.5 million.
| Fictional fleet economics | Annual amount |
|---|---|
| Maximum available GPU-hours | 8.76 million |
| Billable hours at 75% utilization | 6.57 million |
| Revenue at $4 per billable hour | $26.28 million |
| Power and site costs | ($8.00 million) |
| Economic equipment depreciation | ($12.50 million) |
| Financing expense | ($3.00 million) |
| Remainder before omitted costs and tax | $2.78 million |
This remainder is not EBITDA, GAAP net income or free cash flow. EBITDA would exclude depreciation and interest; free cash flow must account for actual capital expenditures, debt payments and working capital. The example instead shows how narrow the cushion can be even when revenue looks substantial relative to hourly prices.
The model also assumes every unit has the same billable economic value, which is rarely true across product types, chip generations and contracted discounts. It omits network expansion, insurance, personnel, spare equipment, downtime penalties and refresh investment. The omissions mean actual all-in profitability could be lower under these specific assumptions, not that every neocloud necessarily earns this margin.
Utilization can change everything
Holding the $4 hourly rate and $23.5 million combined modeled annual costs constant, utilization has a powerful effect. At 50%, annual revenue would be $17.52 million, yielding an illustrative $5.98 million shortfall before other costs. At 75%, the modeled remainder is $2.78 million. At 90%, revenue would be $31.54 million, creating roughly $8.04 million before omitted expenses.
| Fictional annual utilization | Revenue | Remainder after modeled costs |
|---|---|---|
| 50% | $17.52m | −$5.98m |
| 75% | $26.28m | +$2.78m |
| 90% | $31.54m | +$8.04m |
These amounts are arithmetic scenarios, not actual reported occupancy or profitability. They also show why the definition of utilization matters. A provider may report time when equipment is committed to a customer, physical computing activity, or billable capacity; those measures can differ significantly. An enterprise paying for a reserved cluster may support revenue even when the GPUs are not running at maximum physical workload intensity. Conversely, a spot market may show intense usage with unpredictable prices.
The quality of demand matters just as much as the reported percentage. Long-term take-or-pay-style agreements can make billing more predictable, subject to exact contract terms, but may lock in pricing at levels that later look unattractive if energy or replacement costs rise. Short-term capacity can capture scarcity premiums, but it is exposed to new supply and workload migration.
Power is a financing problem as well as an engineering problem
GPU operations depend on electricity, cooling, transformers, network links and resilient facility design. Electricity consumption rises with high-power accelerators and associated equipment, but nameplate power is not identical to average billable energy draw. The data-center power usage effectiveness measure can help describe total facility electricity relative to IT equipment electricity, yet it is not a complete proxy for margin.
A company that has obtained equipment but lacks grid interconnection is not free to deploy it anywhere. Interconnection queues, substations and available generation can impose genuine bottlenecks. Local tariffs, electricity contracts and the ability to curtail load during stress affect operations. A seemingly small change in power price becomes material across large capacity blocks.
Some providers build or lease facility infrastructure, others contract through colocation partners. Both structures create obligations. Leasing may transfer certain facility construction risks but does not remove power and availability constraints. Owned infrastructure may offer more control while increasing capital needs. Investors need to distinguish megawatts reserved, megawatts ready and megawatts actively producing revenue.
Why GPU depreciation is unusually contentious
Conventional depreciation allocates equipment cost over an estimated useful life for accounting purposes. Economic obsolescence is different. Accelerators may remain physically operational for years while newer products deliver more compute per watt, improved networking or a lower cost per unit of useful AI work. If customers shift workloads toward newer equipment, an older cluster may require a price discount before its accounting book value has fully depreciated.
The correct useful life depends on technology, workloads, customer demand and resale markets; no universal answer applies to every GPU model. It is therefore dangerous to compare companies solely on adjusted EBITDA, which adds back depreciation. A cash-intensive operator can report high adjusted EBITDA while continuously reinvesting heavily to refresh an increasingly competitive fleet.
An analyst can test a four-year depreciation estimate against more pessimistic three-year replacement economics or a longer six-year life. A three-year model increases annual cost on $50 million of assets from $12.5 million to about $16.7 million, reducing the hypothetical annual remainder by about $4.2 million if all other assumptions remain fixed. That sensitivity is large relative to the model’s $2.78 million cushion at 75% utilization. The point is not that three years must be correct; it is that technology-life assumptions can overwhelm a valuation.
Leverage changes the payoff profile
Infrastructure companies can finance equipment and facilities through secured loans, leasing, convertible notes, equity issuance and customer-backed arrangements. Debt can accelerate expansion while contracts appear attractive, but fixed interest and principal obligations become painful if operating cash arrives late. It also matters whether collateral can be resold easily or whether lenders may require more security when market conditions deteriorate.
CoreWeave’s 2026 SEC filing gives investors original details to analyze, including material debt, contractual obligations and risks. Its scale and financing profile should not be applied automatically to every smaller GPU provider. Some firms may be much less leveraged, while others could be more reliant on a small number of funders or customers.
Excess leverage has a second-order effect: creditors, not only shareholders, can gain influence over capital allocation. A provider might be forced to preserve liquidity, slow a profitable expansion or issue equity at an unfavorable price. In a stress case, a customer could remain willing to rent GPUs while the balance sheet still prevents a company from funding their installation.
Customer concentration is a double-edged sword
Signing a multi-year agreement with a large AI laboratory or hyperscaler can validate a neocloud’s technology and support financing. It can also make financial results heavily dependent on a few customers’ investment priorities. A large client might develop its own capacity, diversify among suppliers, negotiate discounts or modify workloads as new hardware generations arrive.
Revenue recognition can be especially lumpy when a cluster becomes available after a long construction period. A growing backlog may therefore coexist with periods of compressed margins, particularly when multiple facilities ramp at the same time. Compare the company’s actual cash receipts and working-capital movements over several quarters instead of treating a single record backlog figure as evidence that these transitions are riskless.
A helpful due-diligence question is whether new customers broaden the revenue base faster than the largest existing customers increase their spending. Expansion from giant buyers can be profitable, but a diversification claim deserves measurable evidence. Customer anonymity may limit public assessment; in that case the unanswered concentration risk should be acknowledged.
Pricing power can disappear even while AI demand rises
AI demand is not a single market. An older GPU may be suitable for some inference tasks but unattractive for the most demanding model training. Dedicated high-speed clusters can command different prices from loosely connected cards. Prices depend on generation, geographic availability, service reliability, contract length and software support. The rental market may also become more competitive as hyperscalers and specialist providers bring new capacity online.
A company could see total AI compute demand rise while its revenue per older GPU-hour declines. In such a world, a high utilization rate might not rescue the original projected economics. The relevant metric is revenue per unit of total invested capital over the equipment’s actual useful life, after operating and financing costs—not merely GPU-hours sold.
Conversely, a specialized operator may create a premium by offering fast cluster deployment, predictable performance and support for demanding workloads. Those service attributes can distinguish a neocloud from a commodity equipment rental. The advantage must eventually appear in pricing, customer retention or lower operating cost, not just in marketing claims about purpose-built infrastructure.
A framework for comparing public and private providers
A serious assessment should start with contracted revenue, the timing of its recognition, and how much additional capital is necessary to fulfill it. Next come realized pricing and the company’s definition of utilization. The third layer is capital structure: gross debt, interest expense, maturity timing, restricted cash and the ability to finance additional capacity. The fourth is technical: hardware age, network speed, failure rates and the energy economics of facilities. Finally, assess who is buying the capacity and whether their commitments are diversified.
One useful ratio is capital expenditure divided by revenue, though its interpretation varies substantially between a company in initial construction and a mature operator. Another is operating cash flow versus capital expenditure over several years. Neither should be used without explaining leases and financing flows. Growth may justify spending ahead of demand, but investors must establish when cash conversion is expected.
For a startup without SEC filings, diligence is harder. Ask management for cohort utilization, contract coverage by calendar year, true all-in power costs and a capex schedule that includes networking and facilities. If those numbers are unavailable, higher uncertainty is the appropriate conclusion. Assumed precision does not become trustworthy just because it is presented in a spreadsheet.
Questions readers ask
Are AI neoclouds profitable?
Some operations can generate positive economics, but profitability differs by provider, contract structure, equipment cost, power cost and accounting treatment. High revenue growth or adjusted EBITDA is not proof of positive free cash flow. Review audited statements and reconciliations for any specific company.
Is a $100 billion backlog the same as $100 billion in sales?
No. Backlog represents expected future revenue under contractual arrangements and defined assumptions. Recognition and collection occur over time and require delivery. CoreWeave’s cited approximately $104 billion backlog was a company-specific measure as of June 30, 2026, not an industry total or already-collected cash.
What is the biggest risk: electricity or GPU prices?
Both can be significant, but the dominant risk varies. A power-constrained build may fail before it bills a single hour; a fully operating fleet may suffer when rental prices decline or customers favor newer hardware. Debt obligations can amplify either problem.
The central investment question
Neoclouds can be valuable infrastructure providers in an expanding market, but they are not passive beneficiaries of AI enthusiasm. Their returns depend on connecting expensive capital assets to paying workloads quickly, keeping those assets relevant, and surviving the financing gap between construction and cash collection. A disciplined investor should be able to describe how backlog becomes billable capacity, and how billable capacity becomes free cash after debt and replacement equipment. Everything else is an incomplete growth story.
Discover more from The Economy
Subscribe to get the latest posts sent to your email.
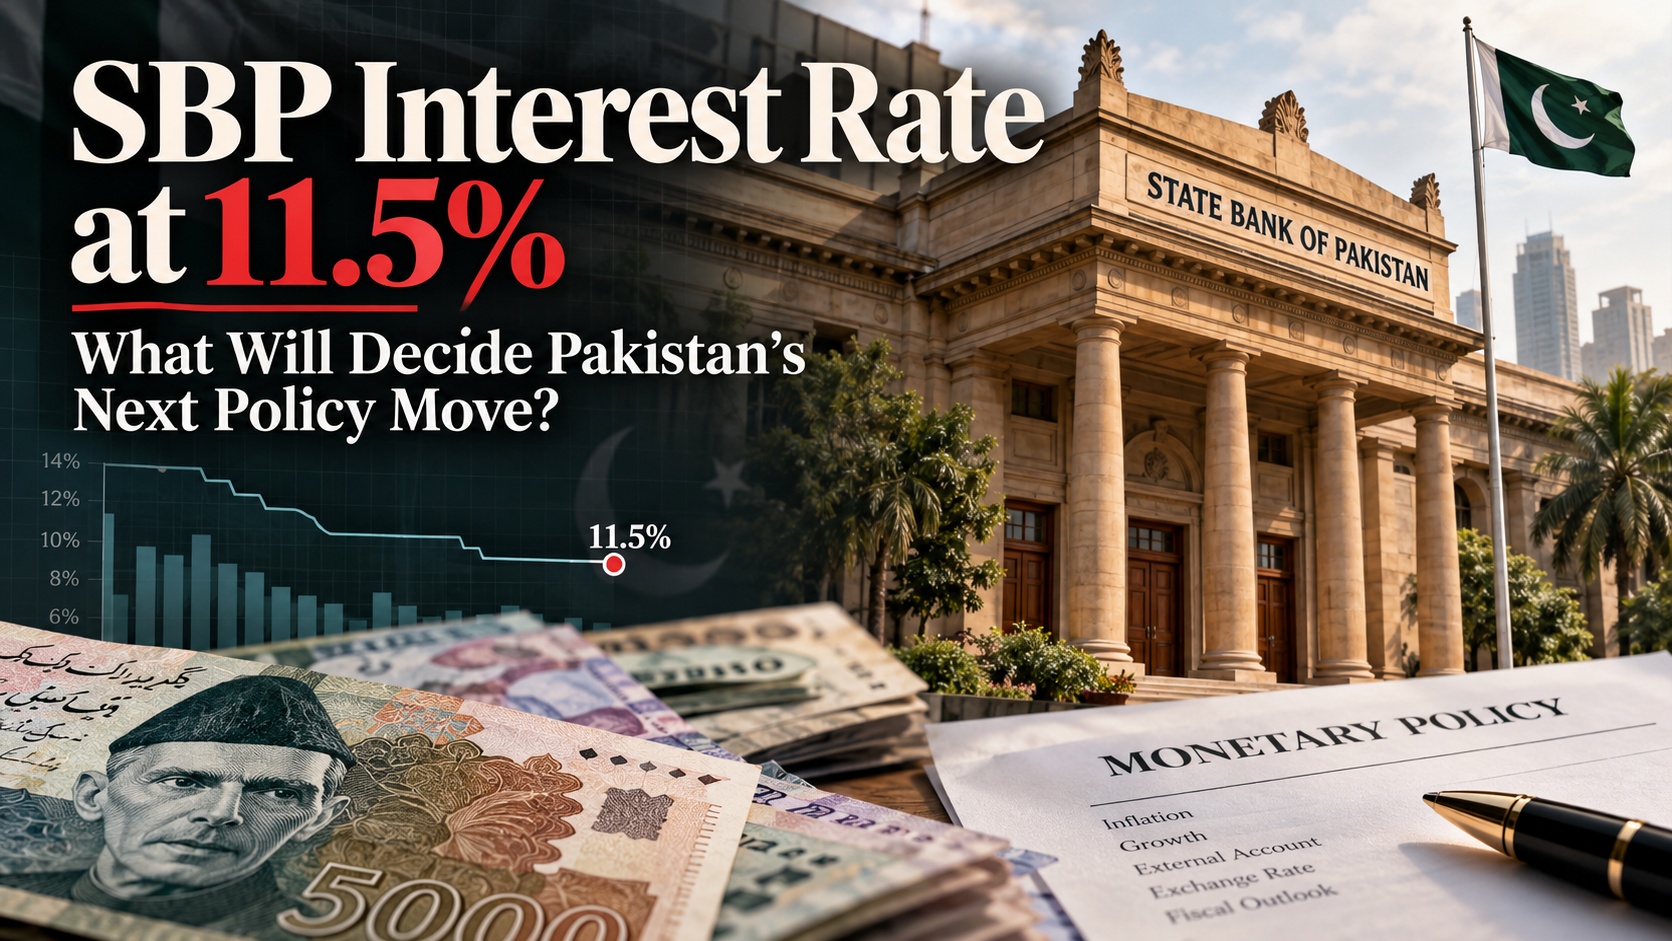
Pakistan’s interest-rate debate has shifted. After an extended period in which households and businesses waited for borrowing costs to fall, a more uncomfortable question is taking shape: how much room does the State Bank of Pakistan have to support growth when energy prices and global borrowing costs are rising?
The State Bank of Pakistan confirmed that its Monetary Policy Committee kept the policy rate at 11.5% on September 14, 2026. That is the established starting point, not a prediction about what the bank will do next. The next decision will depend on inflation momentum, exchange-rate stability, government financing requirements and the external account—not simply on whether consumers would prefer cheaper loans.
The oil-price complication
Pakistan imports a substantial share of the energy it consumes. Oil therefore affects more than petrol-station signs: it changes transport costs, power generation expenses, industrial margins and the amount of foreign currency importers must buy. International Brent crude was above $100 per barrel in October, a sharp risk for an import-dependent economy. The World Bank’s October Pakistan Development Update says stabilization has advanced despite the Middle East conflict, but that is not the same as immunity to another energy shock.
The key for policy is persistence. A one-week spike in crude can be absorbed partly by inventories and pricing lags. Several months of elevated crude can reach the consumer price index, import payments and inflation expectations. If households begin setting wages and prices around another round of cost increases, the central bank becomes less willing to ease.
Four signals worth watching before the next MPC
Headline versus core inflation. Headline inflation reflects food and fuel moves; core readings help judge whether price increases are spreading more widely. A calm headline number alongside rising core inflation is not an easy case for a rate cut.
The rupee and reserve buffers. An exchange-rate shock can raise the local-currency price of imported inputs even when foreign prices are unchanged. The sustainability of remittance inflows, export receipts and foreign financing matters as much as the spot exchange rate.
Market rates: KIBOR, T-bills and PIBs. KIBOR benchmarks bank lending. Treasury-bill auctions indicate near-term sovereign financing costs; longer-dated Pakistan Investment Bonds embed expectations about inflation, future rates and duration risk. These yields may move before the MPC changes its policy rate. None is a guaranteed predictor of a decision.
Growth and credit. A financing squeeze can delay inventories, construction, machinery purchases and hiring. Policymakers must balance these costs against the inflationary damage of lowering rates too soon. The World Bank reported real GDP growth of 3.7% for fiscal 2026, after 3.2% in fiscal 2025; that recovery raises the stakes of a policy mistake in either direction.
What an unchanged rate means on the ground
For a company with floating-rate debt, a policy-rate hold does not guarantee an unchanged interest bill. The actual loan may reprice from KIBOR plus a fixed spread, while repayment schedules and bank fees add complexity. Families considering mortgages should ask for an amortization table under several interest-rate scenarios instead of extrapolating from a single headline.
For savers, quoted deposit returns should be compared after tax, fees and inflation. A nominal return of 11% is not an 11% gain in purchasing power if living costs rise sharply. For government-bond buyers, a high coupon does not eliminate price risk: fixed-rate securities generally lose market value when yields rise.
Three plausible outcomes—not a false forecast
| Scenario | What would make it more plausible | Likely market response |
|---|---|---|
| Hold | Sticky inflation, expensive energy, manageable growth | Short-term yields may remain elevated; borrowers wait |
| Cut | Sustained disinflation, stable reserves and rupee, softer demand | Floating-rate financing could gradually become cheaper |
| Hike | Renewed imported inflation or currency instability | Higher financing cost, but stronger anti-inflation signal |
These are conditions, not assigned probabilities. An accurate forecast must be updated when fresh CPI, reserve, auction and external-account data arrive. The IMF’s October 2026 outlook expects global inflation of 4.7% in 2026, underscoring the difficult international setting.
Practical questions readers are asking
The policy transmission lag that forecasts overlook
A cut announced by the central bank would not instantly reset every Pakistani mortgage, business loan and deposit. Some contracts reprice periodically using an agreed KIBOR tenor; others remain fixed until a renewal date. Banks also consider liquidity and credit risk, which can prevent lending rates from falling as quickly as the benchmark. Borrowers should obtain a written repricing schedule rather than infer savings from the policy-rate headline alone.
Similarly, the MPC must interpret economic data that arrive with delays. A monthly inflation print may be affected by base effects—a comparison with unusually high or low prices one year earlier. Headline disinflation therefore does not necessarily mean that prices are falling, merely that they are increasing more slowly. For businesses, the distinction determines whether inventory and wage costs are genuinely easing.
The quality of the government’s financing programme also matters. If Treasury-bill auctions show that investors demand high returns, a monetary-policy easing cycle may not translate cleanly into cheaper public borrowing. Policymakers must evaluate expectations alongside the immediate inflation rate.
Editorial watchpoint: before describing any meeting as a turning point, publish the newest CPI release date, exchange-rate observation and actual T-bill auction cutoffs. Clear sourcing makes a forecast useful even when it proves wrong.
Is 11.5% the same as a bank’s loan rate?
No. It is the SBP policy rate. A specific loan can be priced using KIBOR, a spread, collateral risk and contractual terms.
Does a rate hold mean petrol and food prices will stop rising?
No. Monetary policy influences demand and financing conditions; it cannot directly reverse a supply shock, an oil-price increase or weather damage.
What should investors check first?
Compare the latest SBP statement, CPI releases, KIBOR quotations, recent T-bill auction results and the timing of the next official MPC announcement. Avoid treating a market rumour as a decision.
Bottom line: The next rate move is a contest between the need to protect a fragile recovery and the need to avoid imported inflation becoming embedded. For Pakistan, the path of oil, the rupee and inflation expectations matters more than any single commentator’s rate-cut call.
Discover more from The Economy
Subscribe to get the latest posts sent to your email.

Gold at the $4,000 Line: Possible December Fed Hike

Oil at $100+: Hormuz, a Qatari Peace Draft and the Iran Deadline

The Fed’s 10-2 Hold: Why Two Dissenters Wanted a Rate Hike

SBP Raises Policy Rate to 12%: What It Means for Your Loans, Savings and Business

IMF’s $1.2bn Staff-Level Deal: What Pakistan Promised on Surplus

Decoding the DBS–BCA Merger Rumour: Market Volatility, Strategic Realities

New Xbox Games October 26–30, 2026: Releases and Game Pass

Tokyo Disneyland Peter Pan’s Flight Closure: January–February 2027 Guide

Neocloud Economics in 2026: GPU Debt, Utilization and Power

What Is a Neocloud? How AI GPU Clouds Work and Compare

Lula Re-elected in 2026: What Changes for the Dollar, Brazilian Stocks, and Interest Rates?

Lula Wins Brazil’s 2026 Election: Five Economic Tests for 2027

SSI November 2026 Payment: Why Benefits Arrive October 30

Russia Sanctions Waiver: What Asian Oil Buyers Gain

Crude Oil & Petroleum Market Analysis: OPEC+ Decisions and Price Forecasts

Top US Convenience Store Chains: Store Counts, EV Charging, and Sales Trends

Social Security Extra $90 Deposit: Who Qualifies for the October 2026 Medicare Rebate?

Who Is Shivon Zilis? The Neuralink Executive at the Center of the Musk–OpenAI Trial

Algorithmic Dogfights: Why the U.S. and China Must Establish Rules of Engagement for Autonomous Air Power

Gold Price Outlook 2026: The Forces Behind the Forecasts—and What Could Reverse Them

Corporate America Faces a New Debt Test as US Borrowing Costs Surge

Global Economic Outlook 2026: 7 Forces Reshaping Markets, Trade and Business

Stock Market Crash in 2026? Warning Signs, Scenarios and a Calm Investor Checklist

Stock Market Today: Dow, S&P 500, and Nasdaq Retreat as Treasury Yields

Geopolitics and Your Portfolio: How International Affairs Move Global Markets

Anthropic Bans Sustained Abuse of Claude AI Under New Usage Policy Effective November 12, 2026

US–Iran Conflict in October 2026: Hormuz, Oil Prices and Diplomacy

Why Did I Get $90 From Social Security? 8 Reasons Behind an Unexpected SSA Payment
-

 Markets & Finance10 months ago
Top 15 Stocks for Investment in 2026 in PSX: Your Complete Guide to Pakistan’s Best Investment Opportunities
-

 Analysis8 months ago
Johor’s Investment Boom: The Hidden Costs Behind Malaysia’s Most Ambitious Economic Surge
-

 Analysis8 months ago
Top 10 Stocks for Investment in PSX for Quick Returns in 2026
-

 Banks10 months ago
Best Investments in Pakistan 2026: Top 10 Low-Price Shares and Long-Term Picks for the PSX
-

 Analysis9 months ago
Brazil’s Rare Earth Race: US, EU, and China Compete for Critical Minerals as Tensions Rise
-

 Investment10 months ago
Top 10 Mutual Fund Managers in Pakistan for Investment in 2026: A Comprehensive Guide for Optimal Returns
-

 Global Economy10 months ago
15 Most Lucrative Sectors for Investment in Pakistan: A 2025 Data-Driven Analysis
-

 Global Economy10 months ago
Pakistan’s Export Goldmine: 10 Game-Changing Markets Where Pakistani Businesses Are Winning Big in 2025