
Global Trade
Trade Deficit & Terms of Trade Explained: Global Impact, Real-World Examples, and 2026 Insights

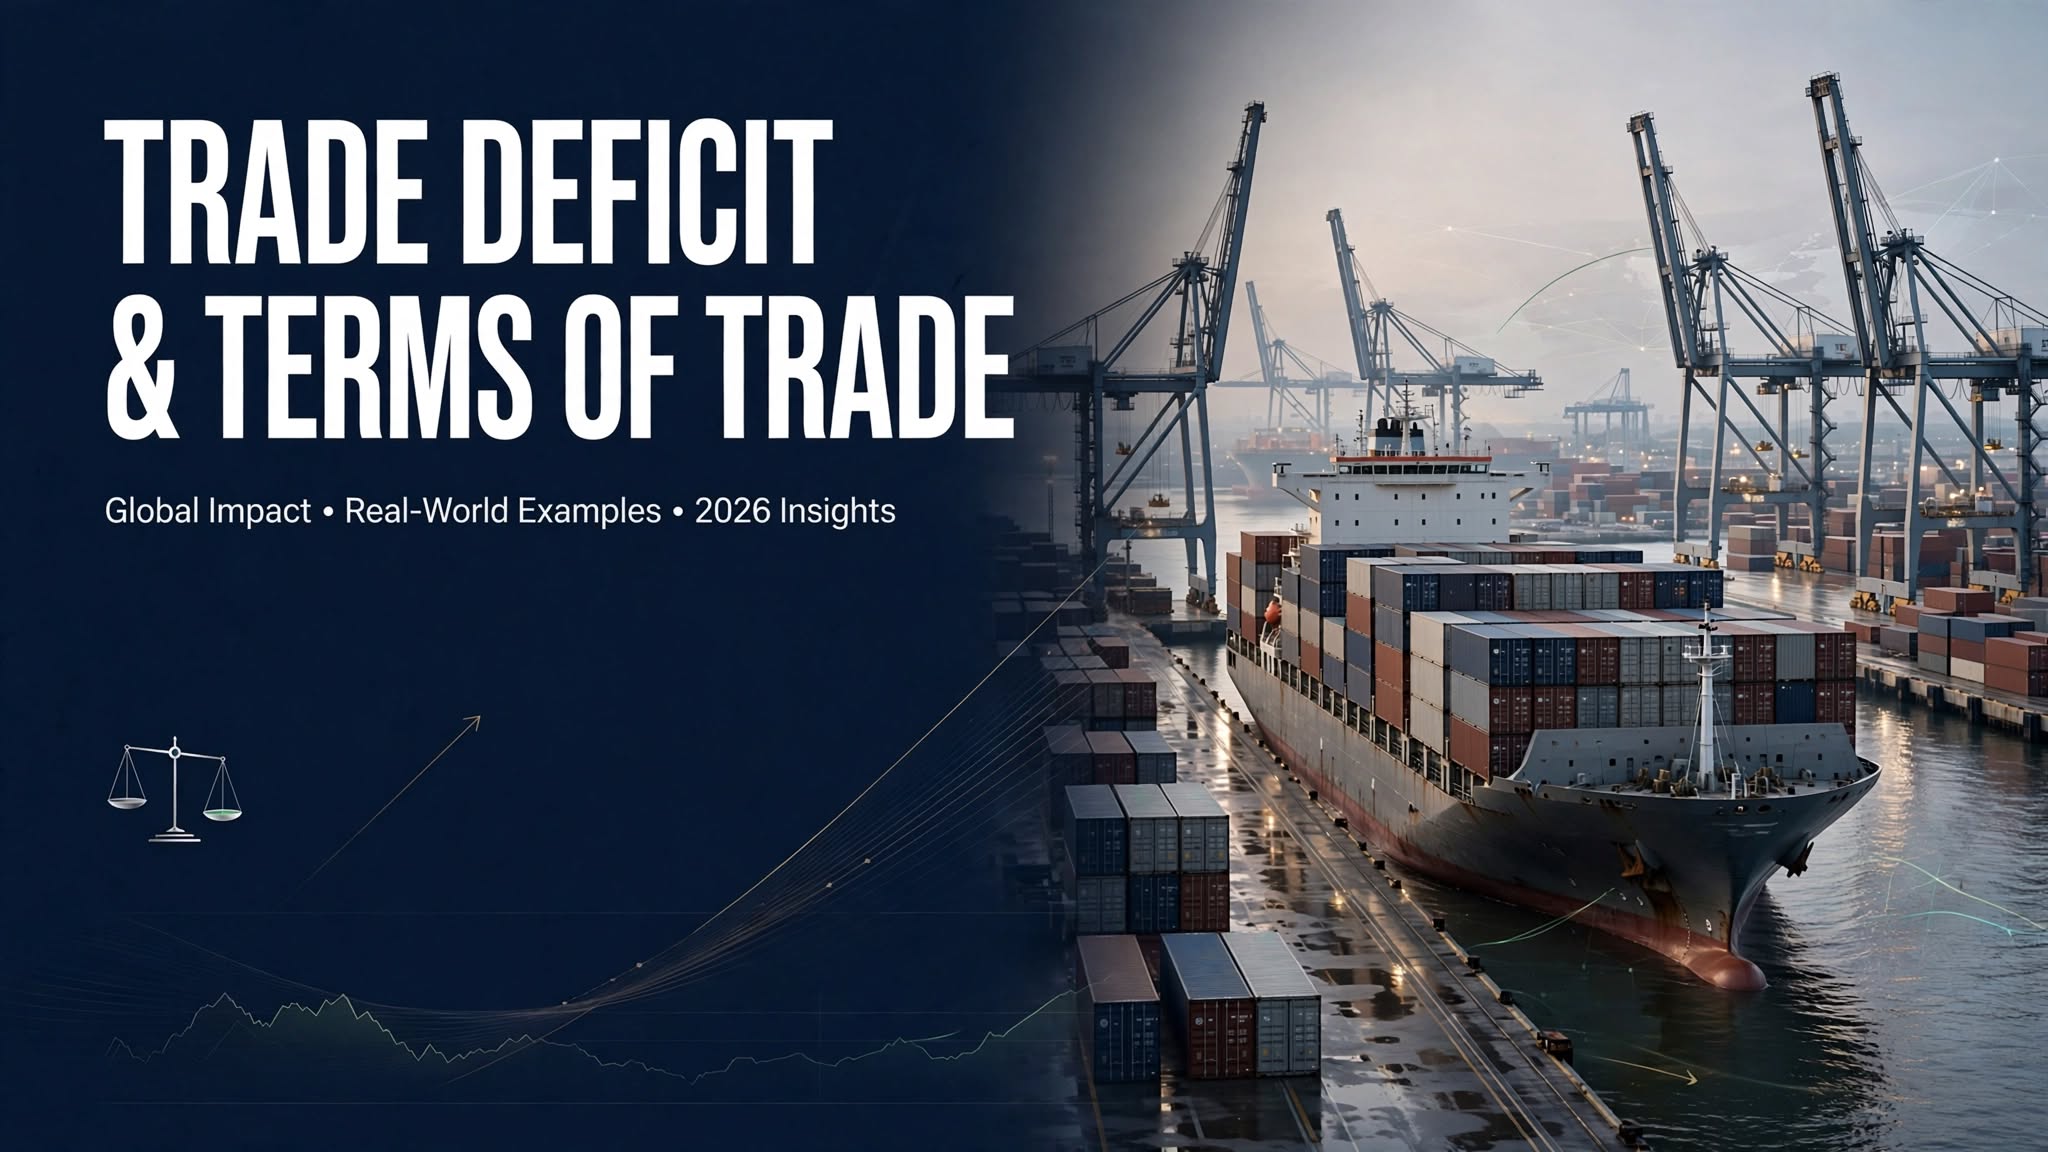
Navigating the Complexities of International Commerce and Value Exchange
International trade is the lifeblood of modern globalization. Within this vast ecosystem, two metrics stand out as vital indicators of a nation’s trading health: the Trade Deficit and the Terms of Trade (TOT).
For platforms like Thefinance.pk and Economy.com.pk, examining these metrics reveals whether a country is building sustainable wealth through global trade or slowly eroding its foreign exchange reserves through unfavorable commerce.
Trade Deficit: When Imports Outpace Exports
A Trade Deficit (specifically a merchandise trade deficit) occurs when the total monetary value of physical goods a country imports from abroad exceeds the total value of the goods it exports over a given period.
- The Nuance of Deficits: A trade deficit is not inherently catastrophic. If a developing nation runs a trade deficit because it is importing heavy industrial machinery, raw steel, and advanced technology required to build domestic manufacturing plants, the deficit represents productive investment in future export capacity.
- The Danger of Consumption Deficits: Conversely, if a trade deficit is driven by a nation gorging on imported luxury vehicles, consumer electronics, and foreign food items while exporting very little, it represents an unsustainable drain on national wealth and foreign exchange reserves. Chronic consumption-driven trade deficits frequently culminate in balance of payments crises.
Terms of Trade (TOT): The Exchange Ratio of Exports to Imports
While the trade deficit measures the volume and value gap, the Terms of Trade (TOT) measures the relative price ratio of a country’s exports to its imports. It is calculated using the following formula:
$$\text{Terms of Trade} = \left( \frac{\text{Index of Export Prices}}{\text{Index of Import Prices}} \right) \times 100$$
- Improving Terms of Trade: If a country’s TOT index rises above 100 (or increases over time), it means the prices of the goods it exports are rising faster than the prices of the goods it imports. For every unit of exports it sells, the country can now buy more imports. This signals a strengthening economic position and rising national income.
- Deteriorating Terms of Trade: If the TOT index drops, the country must export a larger volume of its goods just to buy the exact same amount of imports (such as oil or machinery). This is a common trap for developing nations that export low-value agricultural raw materials while importing high-value manufactured technology and energy.
The Real-World Application
Consider an oil-exporting nation: when global crude oil prices surge, its export prices skyrocket, causing its Terms of Trade to improve dramatically, even if export volumes remain unchanged.
Conversely, an oil-importing developing nation experiences a devastating collapse in its Terms of Trade during an energy crisis; its export earnings remain flat, but its import bill for fuel doubles overnight. This disparity explains why global commodity price fluctuations can instantly devastate an emerging economy’s macroeconomic stability.
Key Takeaways:
- A trade deficit occurs when the value of imported merchandise exceeds export earnings.
- Trade deficits are manageable if funded by capital imports for infrastructure, but dangerous if driven by luxury consumption.
- Terms of Trade measures the ratio of export prices to import prices, determining a nation’s purchasing power on global markets.
- Deteriorating terms of trade force nations to export more physical goods just to pay for essential imports like energy.
Authoritative Sources & Further Reading:
- United Nations Conference on Trade and Development (UNCTAD): Global Trade Statistics
- World Trade Organization (WTO): International Trade Trends and Market Analysis
Discover more from The Economy
Subscribe to get the latest posts sent to your email.


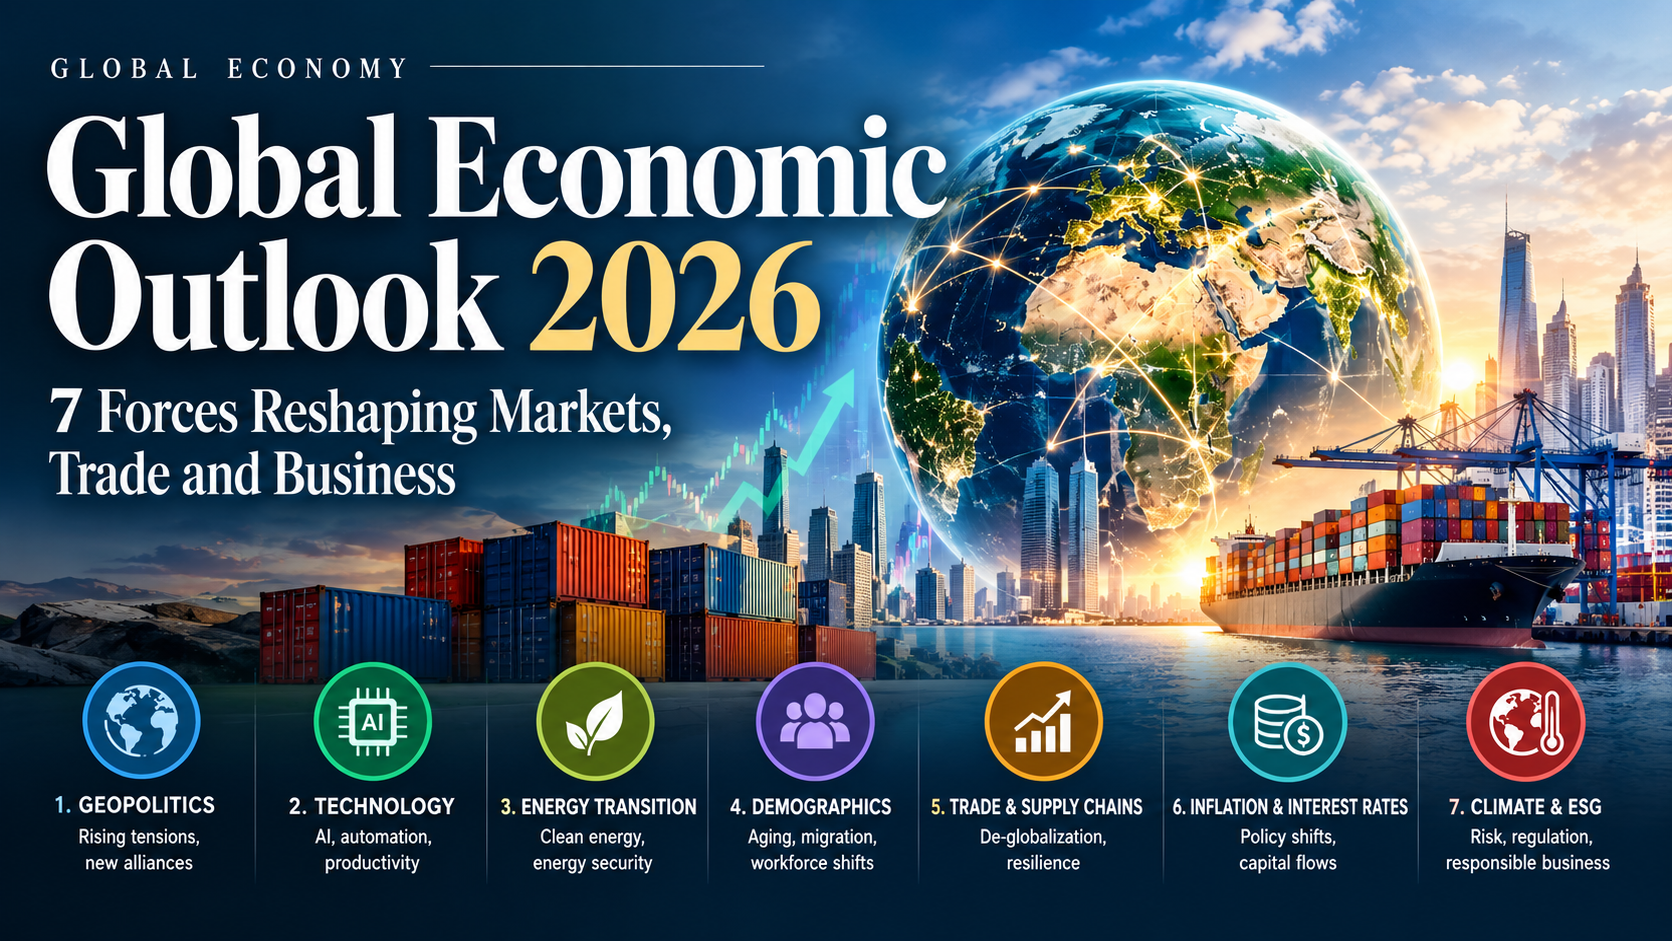
The global economy is entering a period in which geopolitical conflict, artificial intelligence, energy markets, trade policy and public debt are increasingly moving together.
That was one of the central messages emerging from the Forbes Global CEO Conference 2026 in Singapore, where business leaders gathered under the theme “Speed of Change.” The conference discussion highlighted a world in which tariffs, military conflicts, volatile energy prices and the rapid expansion of artificial intelligence are changing how companies plan for growth.
But the bigger story extends beyond the conference room.
Recent assessments from the World Bank, OECD, IMF and Bank for International Settlements point to an economy that remains surprisingly resilient while becoming more exposed to simultaneous shocks.
The result is a new operating environment for companies and investors: growth is still possible, but the sources of growth—and the risks surrounding it—are changing rapidly.
1. Geopolitics Is Becoming an Economic Variable
For years, businesses often treated geopolitics as an external risk. In 2026, that distinction is becoming increasingly difficult to maintain.
Trade restrictions, military conflicts, sanctions, shipping disruptions and energy-market volatility can now affect corporate earnings almost immediately.
The World Bank says the Middle East conflict has contributed to sharp increases in energy prices and renewed inflationary pressure, while its latest global outlook projects global growth at 2.5% in 2026 under its current assessment. It also warns that additional geopolitical escalation and commodity disruptions could push growth lower.
That means companies are increasingly being forced to consider questions that previously belonged primarily to governments and foreign-policy specialists:
- Where should critical production be located?
- Which trade routes are vulnerable?
- How dependent is the business on imported energy?
- Which markets could be affected by sanctions?
- Can suppliers be replaced quickly?
- How much inventory is necessary to protect against disruption?
For investors, geopolitical risk is therefore becoming part of fundamental analysis rather than simply a headline risk.
2. AI Is Both a Growth Engine and a Financial Risk
Artificial intelligence may be the most important structural force supporting global investment.
The OECD says strong AI-related activity helped sustain investment, production and trade during the first half of 2026. Its September interim outlook projects global GDP growth of 2.9% in 2026 and 3.0% in 2027.
The AI boom is creating demand for semiconductors, data centers, electricity, cloud infrastructure, networking equipment and advanced computing.
But there is a second side to the story.
The Bank for International Settlements has warned that AI-related investment is increasingly debt-financed and that stretched valuations could create financial vulnerabilities if expectations around AI earnings or investment weaken.
This creates an unusual economic dynamic.
AI can simultaneously:
Boost growth → increase investment → raise productivity → strengthen markets
while also potentially:
Increase valuations → encourage leverage → create concentrated exposure → amplify a market correction.
The implication for businesses is straightforward: adopting AI is no longer simply a technology decision. It is increasingly a capital-allocation and competitiveness decision.
3. The Next Phase of Globalization May Be More Regional
One of the most important developments highlighted at the Singapore conference is that globalization is not necessarily disappearing—it is changing shape.
Forbes reported that FedEx executive Richard Smith pointed to continuing global trade growth and opportunities for smaller Southeast Asian economies, while Biocon chair Kiran Mazumdar-Shaw highlighted India’s efforts to position itself as a technology partner through strategic trade and technology relationships.
That suggests the next phase of globalization could be less about one integrated production system and more about multiple interconnected regional networks.
Southeast Asia is particularly important.
Manufacturing diversification, digital infrastructure, strategic trade agreements and rising investment are creating opportunities for countries positioned between major economic powers.
The World Bank’s latest South Asia outlook similarly highlights the region’s resilience, projecting 6.9% growth in 2026, although it warns that elevated energy prices, weather shocks and a reversal in AI investment could create downside risks.
For multinational companies, this could mean a greater emphasis on:
- China+1 manufacturing strategies
- India and Southeast Asian supply chains
- Regional technology corridors
- Multiple sourcing locations
- Localized production
- Cross-border digital infrastructure
The globalization debate is therefore moving from “globalization versus deglobalization” toward “which regions will capture the next wave of globalization?”
4. Energy Prices Could Become the Inflation Wild Card
Energy remains one of the most important transmission channels between geopolitics and inflation.
A military escalation that affects oil production, refining capacity or shipping can increase costs across the economy—from transportation and manufacturing to food and consumer goods.
The OECD notes that renewed disruptions to production and exports in the Gulf have pushed energy prices higher, while elevated refining margins are adding pressure to consumer prices and business costs.
This creates a difficult policy problem.
Central banks may want to support economic growth, but persistent energy-driven inflation can limit their ability to loosen monetary policy.
For companies, higher energy prices can squeeze margins even when revenues remain stable.
For investors, the important question is no longer simply whether oil prices rise. It is whether an energy shock becomes persistent enough to change inflation expectations, interest rates and corporate investment decisions.
5. Public Debt Is Becoming a Constraint on Governments
Another structural challenge is the enormous amount of public debt accumulated across major economies.
The IMF has warned that global public debt is approaching historically elevated levels, while rising borrowing costs can make fiscal management increasingly difficult.
That creates a complicated environment for governments.
During an economic slowdown, governments may want to spend more to support households and businesses. But higher debt-servicing costs reduce the room available for fiscal stimulus.
The pressure is particularly important when an energy shock simultaneously increases inflation and weakens growth.
The IMF has also urged governments to rebuild fiscal space and maintain credible policies as economic risks accumulate.
For markets, this matters because government borrowing affects bond yields, currency markets, investment costs and ultimately equity valuations.
The era in which investors could treat fiscal policy as a secondary consideration may be ending.
6. Financial Markets Are More Vulnerable to an AI-Driven Repricing
The AI investment boom has helped support equity markets and corporate capital expenditure, but it has also created concentration risks.
The BIS has highlighted concerns surrounding stretched AI-related valuations, increased leverage and growing interconnectedness between banks and non-bank financial institutions.
That does not mean an AI crash is inevitable.
Instead, it means investors should distinguish between:
AI as a transformational technology
and
AI-related assets priced for extremely optimistic outcomes.
Those are two very different propositions.
A company can benefit enormously from AI while its stock can still be vulnerable if expectations have moved too far ahead of earnings.
The same principle applies to infrastructure.
Data centers, power generation, semiconductor facilities and cloud infrastructure may have long-term economic value. But if capacity expands faster than sustainable demand, investors could eventually face lower returns or stranded assets.
That concern was also raised during the Forbes conference, where speakers warned that excessive AI infrastructure investment could create stranded assets if the current boom fades.
7. Resilience May Become More Valuable Than Maximum Efficiency
The most important lesson for corporate leaders may be the simplest: the cheapest operating model is not necessarily the safest operating model.
For decades, globalization encouraged companies to optimize supply chains around efficiency, specialization and cost.
The new environment puts greater value on resilience.
That can mean maintaining alternative suppliers, holding strategic inventories, diversifying energy sources, developing cybersecurity capabilities and ensuring that critical technology systems can operate during disruptions.
The BIS has identified AI-related financial risks, leverage, private credit and cyber risks as important areas of financial-stability concern.
This creates a new corporate calculation:
Efficiency reduces costs. Resilience reduces catastrophic risk.
The companies that succeed in the next economic cycle may be those capable of balancing both.
What the 2026 Global Economy Means for Investors
For investors, the changing global landscape suggests that traditional macroeconomic indicators should be combined with a wider set of signals.
Five areas deserve particular attention:
Interest rates
Energy-driven inflation could keep monetary policy tighter for longer than markets expect.
Oil and energy
Sudden changes in energy prices can affect inflation, corporate margins and consumer spending simultaneously.
AI investment
AI remains a major growth opportunity, but valuation and leverage risks need to be monitored.
Geopolitical developments
Trade restrictions, wars, sanctions and shipping disruptions can rapidly alter market expectations.
Regional growth
South Asia and Southeast Asia remain important beneficiaries of supply-chain diversification and technology investment, although both regions remain exposed to energy and global financial conditions.
Why Southeast Asia and South Asia Matter More
The geographic center of global growth is also becoming more important.
Southeast Asia is attracting capital as companies diversify production and supply chains, while South Asia continues to record comparatively strong growth.
The World Bank’s latest South Asia assessment expects regional growth of 6.9% in 2026, with domestic demand and remittance inflows providing important support.
At the same time, the World Bank says Europe and Central Asia face slower growth amid higher energy prices and weaker external demand, although AI adoption could improve productivity and offset demographic pressures.
This reinforces a broader investment theme: the global economy is becoming more fragmented, but opportunities are also becoming more geographically diverse.
The New Economic Equation
The message emerging from Singapore is not that globalization is ending, AI is creating a bubble or the global economy is heading inevitably toward recession.
The more important conclusion is that the rules of economic decision-making are changing.
Companies must now think simultaneously about technology, geopolitics, energy, capital costs, supply chains and regulation.
Investors face a similar challenge.
The winning strategy may not be predicting exactly when the next crisis arrives. It may be identifying businesses, countries and sectors that can remain competitive when the assumptions behind the current economic system change.
The World Bank sees meaningful downside risks from geopolitical escalation and commodity disruptions, while the OECD expects continued but moderate global growth. The IMF has emphasized the need to rebuild fiscal resilience, and the BIS is highlighting vulnerabilities associated with AI valuations, leverage and financial interconnectedness.
Taken together, these assessments point to an economy that is resilient—but increasingly expensive to destabilize.
Bottom Line
The 2026 global economy is being shaped by seven forces: geopolitical fragmentation, AI investment, regionalized globalization, energy volatility, public debt, financial-market concentration and the growing value of resilience.
The opportunity is significant.
So is the risk.
For business leaders, the priority is adaptability. For investors, it is diversification and disciplined valuation. For governments, it is restoring fiscal and financial buffers before the next shock arrives.
The central economic question for the years ahead may therefore be less “How fast will the global economy grow?”
It may be:
“Which economies, companies and investors are best prepared for a world where the rules keep changing?”
Discover more from The Economy
Subscribe to get the latest posts sent to your email.

Key Takeaways
- SAVE is over. A court order ended the plan in March 2026, and the Department of Education told 7.5 million enrolled borrowers to move into a legal repayment plan.
- The clock is running right now. Servicers began sending 90-day notices on July 1, and the first wave of deadlines landed in late September. Miss yours and you will be placed in a Standard or Tiered Standard plan, usually with higher payments.
- A new plan exists. The Repayment Assistance Plan (RAP) launched July 1, 2026, with payments set at 1% to 10% of adjusted gross income and a $10 monthly minimum.
- New loans cost more. Undergraduate Direct Loans first disbursed this school year carry a 6.52% fixed rate, up from 6.39% a year earlier.
- Consolidation is no longer a casual move. Under the settlement that ended SAVE, consolidating restarts the clock on income-driven forgiveness, though not on Public Service Loan Forgiveness.
If you have federal student loans, 2026 is the year the rulebook got rewritten while you were still holding the pen. Plans closed, new ones opened, and deadlines started arriving by email.
This guide cuts through the noise. You’ll see what changed, how the remaining plans compare, when consolidation helps and when it hurts, and which strategy tends to fit which kind of borrower. It reflects the situation as of October 6, 2026, so confirm details with your servicer and on StudentAid.gov before you act.
What Changed in 2026, in Plain English
Congress passed sweeping changes in the 2025 reconciliation law, and 2026 is when they landed. Three events matter most.
| Date | What happened | Why it matters |
|---|---|---|
| March 2026 | A federal court order ended the SAVE plan | Roughly 7.5 million borrowers lost their plan |
| March 27, 2026 | The Department of Education announced the SAVE exit process | Borrowers get at least 90 days to choose a new plan |
| July 1, 2026 | RAP and the Tiered Standard plan launched; new loan rules began | Every borrower with new loans faces a different menu |
Meanwhile, SAVE borrowers had been sitting in a forbearance limbo. That limbo is ending, one notice at a time.
The SAVE Deadline: What to Do If You Haven’t Moved
Your 90 days start on the date of your notice, not on a universal calendar day. Notices have been going out in waves, so deadlines are staggered. The earliest hit at the end of September, and the last may stretch into early 2027.
If you do nothing, you won’t be left without a plan. The Department says non-responders are automatically enrolled in either the Standard Repayment Plan or the new Tiered Standard Plan. The catch is that those plans are not income-based, so your payment can jump.
Your move list:
- Find your notice. Check your servicer’s messaging portal and your email, including spam.
- Confirm your own deadline. Don’t rely on a date you saw online.
- Run the numbers in the Loan Simulator on StudentAid.gov.
- Apply for your chosen plan before the clock runs out.
Your Repayment Menu After SAVE
| Plan | Who can use it | How payments work | Forgiveness |
|---|---|---|---|
| Repayment Assistance Plan (RAP) | Direct Loan borrowers (Parent PLUS loans excluded) | 1% to 10% of AGI, $10 minimum; unpaid interest is waived | After 30 years of payments |
| Income-Based Repayment (IBR) | Borrowers whose loans were all made before July 1, 2026 | Typically 10% or 15% of discretionary income, capped at the 10-year standard amount | 20 or 25 years, depending on when you first borrowed |
| Standard (10-year) | Existing borrowers | Fixed monthly payment | None, because the loan is repaid in full |
| Tiered Standard | Borrowers with loans disbursed on or after July 1, 2026 | Fixed payment that scales with balance | None |
| SAVE | Nobody | Ended | Ended |
A few details deserve attention.
- RAP is stricter on pauses. Economic-hardship deferment is eliminated for new loans, so unemployed borrowers still owe at least the $10 minimum, according to Saving for College.
- IBR remains the safety valve. It stays available for older loans, which makes it a serious option if RAP produces a bigger bill.
- Parent PLUS is a special case. The only income-driven route was consolidating before July 1, 2026, a window that has now closed.
Interest Rates: What New Borrowers Pay
Federal rates reset every July 1 and stay fixed for the life of the loan. For loans first disbursed between July 1, 2026 and June 30, 2027, the Department of Education’s rate announcement sets statutory ceilings of 8.25% for undergraduate loans, 9.50% for unsubsidized graduate loans and 10.50% for PLUS loans.
| Loan type (2026-27) | Fixed rate |
|---|---|
| Undergraduate Direct (subsidized and unsubsidized) | 6.52% |
| Graduate and professional unsubsidized | 8.07% |
| PLUS loans (for the borrowers still eligible) | 9.07% |
Two practical points. First, a 6.52% rate is far above the pandemic-era lows, so prepaying high-rate debt now carries real value. Second, borrowers who sign up for autopay may qualify for a temporary interest-rate reduction, which NerdWallet reports as 1%. Borrower advocates say the sign-up window runs through the end of 2026, so ask your servicer to confirm the terms.
Consolidation: Helpful Tool or Expensive Mistake?
A Direct Consolidation Loan combines federal loans into one, with a weighted-average rate. It can simplify billing and, in some cases, unlock eligibility for a plan. But in 2026 it carries a new sting.
The settlement trap. Under the settlement that ended SAVE, consolidating restarts your progress toward income-driven forgiveness. Public Service Loan Forgiveness is treated differently, according to Massachusetts’ student loan guidance, but a restart on the IDR clock can cost years.
The RAP-only rule. For loans disbursed or consolidated after July 1, 2026, RAP is the only income-driven option. If you currently qualify for IBR on older loans, a rushed consolidation could close that door.
Consolidate when:
- You have older FFEL loans that need to become Direct Loans to qualify for a program.
- Your many servicers and due dates are causing missed payments.
Think twice when:
- You are already making progress toward IDR forgiveness or PSLF.
- Your current plan has a lower payment than the one consolidation would unlock.
Forgiveness: What Is Still Available
- Public Service Loan Forgiveness (PSLF) remains available for borrowers who work full time for qualifying government or nonprofit employers and make the required qualifying payments. Only Direct Loans qualify.
- Income-driven forgiveness arrives after 20 to 25 years under IBR and 30 years under RAP.
- Taxes are back in the picture. The temporary federal tax exclusion for income-driven forgiveness expired at the end of 2025, so forgiven balances discharged in 2026 and later may count as taxable income at the federal level. Talk to a tax professional before you plan around a discharge date.
Strategy by Borrower Type
| If you are… | A sensible starting point | Watch out for |
|---|---|---|
| A public servant pursuing PSLF | Stay on a qualifying plan and document every year of employment | Consolidating without checking how it affects your count |
| Low income with a large balance | Compare RAP and IBR payments and long-term forgiveness | Higher taxes on forgiveness |
| Higher income with a modest balance | Standard plan, or paying extra toward the highest-rate loans | Giving up federal protections by refinancing privately |
| A Parent PLUS borrower | Review options carefully, since RAP is not available | The lack of an income-driven path |
| A SAVE borrower | Pick a plan before your individual deadline | Auto-placement into a payment that jumps |
New Loan Limits Worth Knowing
The same law changed how much new borrowers can take. Grad PLUS is closed to new borrowers, and annual and aggregate caps now apply to graduate, professional and Parent PLUS borrowing. If your plan depends on borrowing federal dollars for graduate school, check the current caps on StudentAid.gov and price out the gap before you commit.
Asked & Answered
What happens if I miss my SAVE deadline?
You’re moved automatically into the Standard Repayment Plan, or into the Tiered Standard Plan if you have loans disbursed on or after July 1, 2026. You can usually still apply for a different plan afterward, but you’ll be billed under the default until your application is processed.
Does consolidation reset student loan forgiveness?
For income-driven forgiveness, yes, under the SAVE settlement terms. Public Service Loan Forgiveness is handled differently. Check your qualifying-payment count before you consolidate.
Can I still get Public Service Loan Forgiveness in 2026?
Yes. PSLF remains available to eligible Direct Loan borrowers who work for qualifying employers and make the required payments.
Is RAP better than IBR?
It depends on your income, family size and loan type. RAP can produce a larger payment for some borrowers and a smaller one for others, and its forgiveness timeline is longer. Run both through the Loan Simulator.
Is student loan forgiveness taxable in 2026?
Possibly. The federal exclusion that covered income-driven forgiveness ended after 2025, so discharged balances may be taxable at the federal level. State rules vary, so get tax advice for your situation.
Discover more from The Economy
Subscribe to get the latest posts sent to your email.

Key Takeaways
- Goldman Sachs wins on profit and returns. In the second quarter of 2026 it reported net earnings of $6.63 billion on net revenues of $20.34 billion. By our math, that is roughly 33 cents of profit per revenue dollar.
- Citigroup wins on sheer revenue. Citi booked $24.8 billion of revenue and $5.8 billion of net income in the same quarter. That works out to about 23 cents of profit per revenue dollar.
- They are different kinds of bank. Goldman is a markets, advisory and asset-management house. Citi is a global transaction bank with a wealth arm, a markets desk and a U.S. consumer business.
- Returns separate the two. Goldman’s return on tangible common equity was 21.3% in the first quarter, while Citi was running at about 13% in the second quarter and still guiding to 10% to 11% for the full year.
- “Leads” depends on the yardstick. Profitability points to Goldman. Global payments plumbing, balance-sheet breadth and turnaround upside point to Citi.
Ask ten bankers which of these two firms leads global finance and you will get ten answers, usually shaped by which floor they work on. A trader at Goldman and a treasury specialist at Citi are, in practice, living in different industries that happen to share a zip code.
So let’s settle it with a scoreboard instead of a debate. This guide compares the two banks using their own filings for the quarter ended June 30, 2026, then adds the context raw numbers can’t carry: strategy, capital return and the unfinished business sitting inside Citi’s turnaround.
One caution before the table. Per-share figures are not comparable across the two firms. Goldman’s $20.98 earnings per share and Citi’s $3.15 reflect very different share prices and share counts, not a seven-fold gap in quality. Compare margins, growth and returns instead.
The Q2 2026 Scorecard
| Metric (Q2 2026) | Goldman Sachs | Citigroup |
|---|---|---|
| Revenue | $20.34B (up 39% year over year) | $24.8B (up 14%) |
| Net income | $6.63B | $5.8B (up 45%) |
| Earnings per share | $20.98 | $3.15 (vs. $1.96 a year ago) |
| Profit per revenue dollar (our calculation) | About 33 cents | About 23 cents |
| Latest return on tangible common equity cited | 21.3% (Q1 2026) | 13% (Q2 2026) |
| Headline capital return | Quarterly dividend raised to $5.00 per share | $30B buyback commitment; dividend increase of about 12% |
Sources: Goldman Sachs Q2 2026 earnings release, Citigroup’s Q2 2026 Form 10-Q and Citi’s Q2 earnings-call highlights. The Goldman return figure comes from the first quarter, the latest in our sources, so treat the ROTCE gap as directional rather than a perfect like-for-like comparison.
How Goldman Sachs Makes Its Money
Goldman’s second quarter was loud. Net revenues rose 39% from a year earlier and 18% from the first quarter. The filing credits the jump primarily to Global Banking & Markets, which produced $15.52 billion, up 53% year over year.
The second engine, Asset & Wealth Management, added $4.60 billion, up 20%. Across the first half of 2026, Goldman generated $37.57 billion of net revenues and $12.26 billion of net earnings.
What does that mix tell you?
- Trading and advisory income is cyclical. It tends to swell when volatility is high and clients are repositioning, which describes much of 2026 so far.
- Asset and wealth management is steadier. Management fees and client inflows give Goldman a base that doesn’t depend on any single week of market chaos.
- The model is capital-light relative to a deposit-funded bank. That is part of why profit per revenue dollar looks so strong, and part of why earnings can swing harder than Citi’s.
The board also lifted the quarterly dividend to $5.00 per share for the third quarter. That is the kind of move a firm makes when it feels good about its earnings power, though dividends are never guaranteed.
How Citigroup Makes Its Money
Citi is built differently. It reports five interconnected businesses (Services, Markets, Banking, Wealth and U.S. Personal Banking) plus a set of legacy franchises being wound down or sold.
In the second quarter, net interest income reached $17.1 billion, up 13%, while non-interest revenue was $7.6 billion, up 18%. One detail stands out: Markets non-interest revenue was $3.0 billion against $3.2 billion a year earlier, so the growth did not come from the trading floor. It came from deposits, fees and the transaction-banking machinery underneath.
That machinery is Services, Citi’s treasury, trade and securities-services franchise. CEO Jane Fraser said it delivered its highest quarterly revenue ever and a return above 30%, per the earnings-call recap.
Think of Services as the plumbing of cross-border commerce. When a multinational moves cash between 90 countries, Citi often sits in the middle. That position is slow to build, hard to replicate and surprisingly sticky.
Profitability and Returns: The Gap That Matters
Return on tangible common equity (ROTCE) measures how much profit a bank earns on the shareholder capital that isn’t tied up in goodwill and intangibles. Analysts lean on it because it translates “how big is the bank” into “how well does the bank use its capital.”
Here is how the two stack up against peers, using first-quarter 2026 figures from Banking Dive:
- JPMorgan: 23%
- Goldman Sachs: 21.3%
- Bank of America: 16%
- Wells Fargo: 14.5%
- Citigroup: 13.1%
Citi is improving fast, with second-quarter net income up 45%, but it is still catching up to the pack. Goldman sits near the top of the table.
Citi’s Unfinished Business
If Goldman’s story is “keep executing,” Citi’s story is “finish the rebuild.” Four items matter.
1. A long runway of return targets
Citi still guides to 10% to 11% ROTCE for 2026. At its May investor day it set a path of 11% to 13% for 2027 and 2028, then 14% to 15% across 2029 to 2031, according to Reuters. Some investors wanted a bolder near-term number, and RBC analysts called the near-term target underwhelming. Management keeps describing 2026 as a waypoint, not a destination.
2. The Banamex exit
Citi has now sold 49% of Banamex, its Mexican consumer franchise. It does not expect further sales in 2026, plans to deconsolidate early in 2027, and will pursue an IPO when markets allow.
3. Capital return
The $30 billion buyback commitment and the planned dividend increase signal confidence, and they shrink the share count, which helps per-share math over time.
4. The transformation program
Fraser said a large body of work passed internal-audit validation during the quarter. For a bank that has spent years under regulatory pressure to fix its controls, that is quiet but meaningful progress.
Which Bank Leads? Seven Lenses
| Lens | Edge | Why |
|---|---|---|
| Profitability and returns | Goldman | Higher profit per revenue dollar and a much higher ROTCE |
| Revenue scale (Q2 2026) | Citi | $24.8B versus $20.34B |
| Cross-border transaction banking | Citi | Services is a record-setting, 30%-plus-return franchise |
| Advisory and capital-markets brand | Goldman | Global Banking & Markets revenue up 53% |
| Earnings stability | Citi, narrowly | Deposit and fee income is less tied to deal and trading cycles |
| Turnaround upside | Citi | More room to close the returns gap if targets are hit |
| Earnings momentum (net income growth) | Goldman | Revenue up 39% year over year in Q2 |
If you force a single verdict, Goldman “leads” on the metric Wall Street weighs most, which is returns on capital. Citi “leads” on the breadth of its global footprint. Neither answer is wrong. They just answer different questions.
What to Watch Next
If you follow bank stocks, three things deserve a spot on your calendar. This is general information, not investment advice.
- Third-quarter earnings. Both banks typically report in mid-October, so check each firm’s investor-relations calendar for exact dates.
- Citi’s ROTCE path. The gap between roughly 13% today and the 14% to 15% medium-term target is the whole equity story.
- Goldman’s trading durability. A quarter of revenue up 39% sets a high bar for the next one.
Asked & Answered
Is Goldman Sachs more profitable than Citigroup?
On the latest quarterly numbers, yes. Goldman earned $6.63 billion on $20.34 billion of revenue, while Citi earned $5.8 billion on $24.8 billion. Goldman converts more of each revenue dollar into profit.
What is ROTCE, and why do analysts care so much?
ROTCE is return on tangible common equity. It shows how efficiently a bank turns shareholder capital into profit, excluding goodwill and intangibles. It is the cleanest single yardstick for comparing banks of different sizes.
Are Goldman and Citi direct competitors?
Partly. They overlap in investment banking and markets trading. Beyond that, Citi is also a global payments, custody, wealth and credit-card business, while Goldman is far more focused on markets, advisory and asset management.
Does the Banamex sale matter for investors?
It does. Selling Banamex releases capital, simplifies the company and clears a long-running distraction. Deconsolidation is expected early in 2027, with an IPO to follow when conditions are right.
When do Goldman and Citi report next?
Both normally publish third-quarter results in mid-October. Confirm the exact dates on each company’s investor-relations page before you plan around them.
Discover more from The Economy
Subscribe to get the latest posts sent to your email.

Algorithmic Dogfights: Why the U.S. and China Must Establish Rules of Engagement for Autonomous Air Power

Stock Market Today: Dow, S&P 500, and Nasdaq Retreat as Treasury Yields

Global Economic Outlook 2026: 7 Forces Reshaping Markets, Trade and Business

Geopolitics and Your Portfolio: How International Affairs Move Global Markets

Conservative Party Conference 2026: What Badenoch’s Tax and Deregulation Pitch Means for the UK Economy

Planet Labs and Goldman: How Satellite Geospatial Data Is Reshaping Wall Street

Red Dye Diesel in 2026: Tax Exemptions, Regulations, and the Real Agricultural Impact

Student Loans in 2026: Forgiveness Updates, Consolidation, and Repayment Strategies

Why Did I Get $90 From Social Security? 8 Reasons Behind an Unexpected SSA Payment

Corporate America Faces a New Debt Test as US Borrowing Costs Surge

Goldman vs. Citi: Which Banking Giant Leads Modern Global Finance in 2026?

Beyond Hanoi & HCMC: How Northern Industrial Clusters Are Driving Vietnam’s 10% Growth Surge

Analytical Review of The Economist’s “What is the Right Tax System for the 21st Century?”

Southeast Asia’s LNG Dilemma: Navigating Price Volatility, Infrastructure Gaps, and Energy Security

Oil Prices Break $100 in 2026: Middle East Conflict & Energy Markets

IMF & World Bank 2026 Global Economic Outlook: Growth, Inflation, Debt

Middle East War Economics 2026: Oil Prices & Energy Markets

High-CPM Finance Niches 2026: Publisher Monetization Blueprint

China Stocks Today: Are Big Economies in Asia Nearing a Market Bottom?

Global Pension Systems Ranked: The World’s Best and Worst Retirement Frameworks

Enterprise AI Platforms Disrupting B2B SaaS in 2026: Full Analysis

Elon Musk’s Next Moves: Disrupting the 2026 Global Economy

Social Security Trust Fund 2032: OASI Depletion Timeline Explained

Crypto Daily Outlook: Bitcoin, Altcoins, and the Future of Decentralized Finance

World’s Largest Economies: Ranking the Top Global Powers

GasBuddy Market Insights: How Crude Price Shifts Impact Local Fuel Cost Averages

World Bank & IMF Reports 2026: Why the “3% Growth” Consensus Is Actually a Debate

PSX Forecast 2026: KSE-100, IMF Reviews & Geopolitics
-

 Markets & Finance9 months ago
Top 15 Stocks for Investment in 2026 in PSX: Your Complete Guide to Pakistan’s Best Investment Opportunities
-

 Analysis8 months ago
Johor’s Investment Boom: The Hidden Costs Behind Malaysia’s Most Ambitious Economic Surge
-

 Analysis8 months ago
Top 10 Stocks for Investment in PSX for Quick Returns in 2026
-

 Banks9 months ago
Best Investments in Pakistan 2026: Top 10 Low-Price Shares and Long-Term Picks for the PSX
-

 Analysis8 months ago
Brazil’s Rare Earth Race: US, EU, and China Compete for Critical Minerals as Tensions Rise
-

 Investment9 months ago
Top 10 Mutual Fund Managers in Pakistan for Investment in 2026: A Comprehensive Guide for Optimal Returns
-

 Global Economy9 months ago
15 Most Lucrative Sectors for Investment in Pakistan: A 2025 Data-Driven Analysis
-

 Global Economy9 months ago
Pakistan’s Export Goldmine: 10 Game-Changing Markets Where Pakistani Businesses Are Winning Big in 2025