
Analysis
Safe Havens No More: The $120 Billion Collapse of Dubai and Abu Dhabi’s Financial Myth

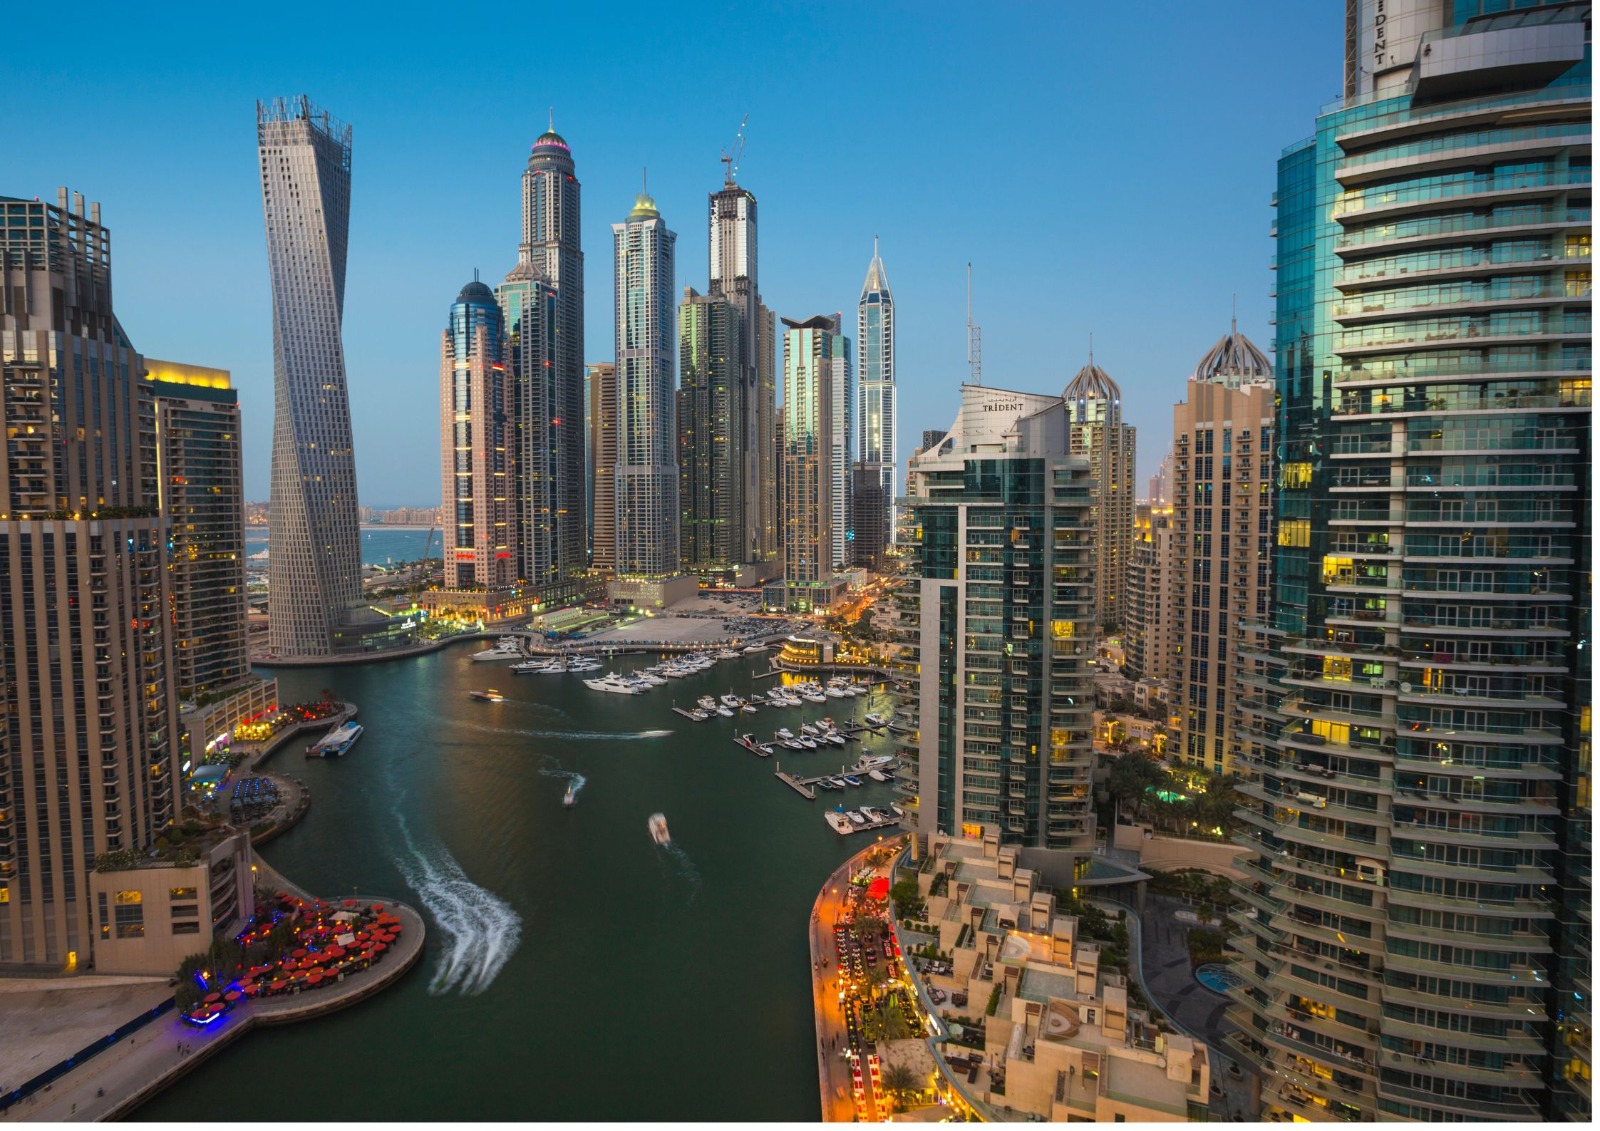
The US-Israel-Iran conflict has exposed a structural fault line beneath the Gulf’s gilded markets. What investors called safe havens are now ground zero for the most violent emerging market sell-off of the decade.
For two decades, Dubai and Abu Dhabi have sold the world a compelling narrative: that Gulf capital markets could transcend regional geopolitics, that gleaming towers and diversified economies had immunised them from the volatility that haunts their neighbours. That story is now in ruins — buried beneath $120 billion in erased market capitalisation, 18,400 cancelled flights, and the low drone of Iranian missiles over the Arabian Gulf.
Since the United States and Israel launched coordinated military strikes against Iranian missile sites and nuclear facilities on February 28, 2026, the Dubai Financial Market General Index (DFMGI) has plunged approximately 17 percent — its steepest sustained decline in a generation. The Abu Dhabi Securities Exchange (ADX) has shed 9 percent over the same period, shedding roughly $75 billion in market value. Together, the two exchanges have vaporised an estimated $120–$124 billion in market capitalisation, according to data from Gulf Business News. For comparison, the S&P 500 fell approximately 7 percent over the same interval — a painful correction, but nowhere near the structural shock coursing through the Emirates.
This is not a rout driven by sentiment alone. It is a geopolitical repricing — the markets finally doing what analysts long warned they might: acknowledging that no amount of architectural ambition or sovereign wealth can fully insulate an open economy from a war being fought within missile range of its airports.
The Anatomy of a $120 Billion Loss
When the Dubai Financial Market reopened on March 4 after a two-session regulatory closure ordered by the UAE Securities and Commodities Authority, the index immediately plunged 4.65 percent — shedding 302 points in a single session. The ADX fell a further 2.78 percent, or 309 index points, to 10,156. Banking and real estate counters, long the twin pillars of the UAE’s equity story, bore the sharpest selling pressure. Emaar Properties, the developer behind the Burj Khalifa and a bellwether for Dubai’s property ambitions, has fallen by more than 25 percent since the conflict began, according to Middle East Eye. Aldar Properties, Abu Dhabi National Hotels, and ADNOC Distribution each declined nearly 5 percent in a single session.
The losses represent more than a correction. They represent a fundamental reassessment of the risk premium attached to Gulf equity markets — what traders call the geopolitical risk premium — that had, for years, been dramatically underpriced. As Ashish Marwah, Chief Investment Officer at Abu Dhabi’s Neovision Wealth Management, told AGBI: “Our markets have a structural concentration in asset-heavy sectors like banking and real estate. These sectors are naturally sensitive to global macro cycles and interest rate environments.” When geopolitical shock is layered on top of macro uncertainty, the effect is compounding and brutal.
The Strait of Hormuz: Where Economics Meets Naval Blockade
The proximate cause of the UAE’s distress is not simply the war itself, but what Iran did with it. On March 4, 2026, Iran effectively closed the Strait of Hormuz — the 21-mile chokepoint through which approximately 20–21 million barrels of oil per day, or nearly 30 percent of global seaborne crude trade, normally flows. The closure was, as the International Energy Agency characterised it, the “largest supply disruption in the history of the global oil market” — eclipsing even the 1973 Arab oil embargo in its potential economic reach.
The consequences cascaded rapidly. Brent Crude surged past $120 per barrel almost immediately. QatarEnergy declared force majeure on all LNG exports. Iraq was forced to shut operations at the Rumaila oil field — one of the world’s largest — for lack of storage space as tankers remained stranded in the Gulf. War-risk insurance premiums for vessels attempting Hormuz transit spiked to levels that made commercial shipping economically nonviable.
According to analysis by SolAbility, the daily economic cost of the Hormuz closure approaches $20 billion in global GDP losses, with scenarios ranging from a $2.41 trillion hit under an optimistic reopening to $6.95 trillion under full escalation. The UN’s trade agency, UNCTAD, has warned that global merchandise trade growth is expected to decelerate sharply, from 4.7 percent in 2025 to between 1.5 and 2.5 percent in 2026, with the financial stress rippling outward to developing economies already stretched thin by post-pandemic debt burdens.
Here lies the central paradox: the UAE, unlike Qatar or Kuwait, has alternative pipeline routes — the Abu Dhabi Crude Oil Pipeline can carry up to 1.5 million barrels per day to the Port of Fujairah, bypassing Hormuz. And yet Dubai and Abu Dhabi have been more damaged by the conflict than almost any other Gulf market. The reason illuminates the UAE’s fundamental vulnerability: this economy was never primarily about oil.
Brand Dubai, Grounded
Tourism generated approximately $70 billion for the UAE economy in 2025 — fully 13 percent of gross domestic product — according to UAE state media. That industry is now in freefall. More than 18,400 flights have been cancelled since the conflict began. Dubai International Airport — the world’s busiest by international passenger volume, handling approximately 95 million passengers annually — was struck during Iranian drone offensives and shut down entirely on March 1. Emirates and Etihad suspended operations simultaneously. In a single day, more than 3,400 flights were cancelled across Dubai, Al Maktoum, Abu Dhabi, and Sharjah.
The scenes that followed were dissonant with every marketing image Dubai has ever projected. Wealthy expatriates, many of whom moved to the Emirates partly for its sense of security, reportedly paid up to $250,000 for private evacuation flights. Hotel bookings collapsed. Real estate brokers began offloading property at discounts of 10 to 15 percent to secure rapid exits, according to Reuters. Goldman Sachs analysts estimate that real estate transactions have dropped 37 percent year-on-year, with sales plunging more than 50 percent compared to February 2026. Dubai’s real estate index, which only weeks earlier had been praised by Savills as “one of the most dynamic property markets in the world” following record transaction volumes of $147 billion in 2025, has fallen by at least 16 percent.
By March 28, Iran had launched 398 ballistic missiles, 1,872 drones, and 15 cruise missiles at UAE targets — making the UAE the most heavily targeted country after Israel itself. While the majority were intercepted, debris caused material damage in both Abu Dhabi and Dubai, including strikes on or near the Burj Al Arab, Palm Jumeirah, Dubai International Airport, and the Fujairah oil industrial zone.
The Structural Fault Lines Now Exposed
For years, the UAE’s economic model was celebrated as a masterclass in post-oil diversification. Under the 10-year plan unveiled in 2023, UAE leaders set an ambition to position Dubai among the world’s top four global financial centres by 2033. That goal now looks distant — not because it was unachievable in peacetime, but because the model assumed something that geopolitics has violently undone: perpetual regional stability as a passive backdrop.
The UAE built its wealth on four pillars — finance, aviation, real estate, and tourism — all of which are acutely sensitive to conflict. Each of those pillars is now under simultaneous pressure. That is not the profile of a safe haven. It is the profile of a highly leveraged bet on stability. As Haytham Aoun, assistant professor of finance at the American University in Dubai, acknowledged to Al Jazeera, the sell-off should be seen as a “temporary shock” rather than evidence of structural economic damage — a framing that may be correct in the long run, but offers cold comfort to investors watching their portfolios contract by double digits in real time.
There are also governance concerns surfacing. Reports suggest Dubai authorities have arrested at least 70 British nationals for filming the aftermath of Iranian strikes, with fines of up to $260,000 and prison sentences of up to 10 years threatened for sharing footage. Whatever the security rationale, that posture sends precisely the wrong signal to the international investor and expatriate community the UAE has spent decades cultivating.
Forward Look: Capital Flight, Investor Confidence, and the Road to Recovery
The immediate prognosis for emerging market volatility in the Gulf is sobering. Unlike the 2008 financial crisis — which struck the UAE via liquidity channels and was eventually resolved by sovereign intervention — the current shock is kinetic and ongoing. Resolution depends not on central bank policy, but on the conclusion of an active military conflict whose timeline even US President Donald Trump has suggested could extend “four to five weeks” or beyond.
That said, there are structural reasons to resist full pessimism. The UAE’s sovereign wealth funds — including Abu Dhabi Investment Authority, one of the world’s largest at an estimated $1 trillion in assets under management — provide an extraordinary buffer that few emerging markets can match. Burdin Hickok, a professor at New York University School of Professional Studies and former US State Department official, noted that markets in Dubai and Abu Dhabi are likely to rebound strongly once the conflict is resolved, pointing to the fundamental quality of the underlying economic architecture.
The medium-term question is more pointed: will capital that has fled the Gulf during this crisis return? Or will the episode permanently recalibrate global investors’ risk models for the region, institutionalising a higher geopolitical risk premium that raises the cost of capital for Gulf markets for years to come?
The answer will hinge on several variables: the speed and terms of conflict resolution, the condition of Hormuz shipping lanes, the resilience of the UAE’s aviation and hospitality sectors, and — perhaps most importantly — whether the UAE government can restore the narrative of institutional transparency and rule of law that underpins long-term foreign direct investment.
What is already clear is that the comfortable myth of the Gulf safe haven — the idea that Dubai and Abu Dhabi somehow existed outside the arc of regional conflict — has been definitively and expensively dismantled. The $120 billion cost of that illusion will be measured not only in lost market capitalisation, but in the harder-to-quantify erosion of confidence that takes years to rebuild.
The Gulf, it turns out, is not beyond geography. And markets, however gilded, are not beyond war.
Discover more from The Economy
Subscribe to get the latest posts sent to your email.


The X algorithm changed significantly in late 2025 and has continued evolving through 2026 — and the single most important shift for brand marketers is this: replies are now weighted 27 times more heavily than likes, according to Teract.ai’s 2026 algorithm analysis. A tweet with 50 thoughtful replies now outperforms one with 500 likes. For brands building AI and climate content strategies on X in 2026, this single mechanical change invalidates most of the hashtag-volume advice still circulating from pre-2025 playbooks.
The Hashtag Myth Correction Every Brand Marketer Needs
Perhaps the most consequential — and least understood — shift is that X’s algorithm no longer relies on hashtags to determine what a post is about. The algorithm reads a post’s actual text content to categorize it topically, whether or not a hashtag is attached, according to Teract.ai. A tweet discussing “AI tools for founders” gets correctly categorized whether or not it includes #AI or #Founders.
After xAI open-sourced its Grok-based recommendation algorithm in 2026, independent code analysis confirmed hashtags now function as neutral-to-negative signals rather than reach amplifiers, according to Postory. The system scores posts on direct engagement and content quality — replies, reposts, and bookmarks carry far more algorithmic weight than likes, while negative signals (blocks, mutes, “show less” actions) carry heavy penalties.
The Actual Hashtag Data for 2026
Despite the algorithm no longer using hashtags as a categorization tool, empirical engagement data still shows a measurable — but narrow — effect:
| Hashtag Count | Engagement Effect vs. Zero Hashtags |
|---|---|
| 0 hashtags | Baseline (not optimal for accounts under 500K followers) |
| 1–2 hashtags | +21% engagement (the sweet spot) |
| 3 hashtags | -17% engagement |
| 5+ hashtags | -40% engagement |
Source: Hashtagtools.io 2026 research report.
The “zero hashtags is a viral hack” narrative circulating in some marketing content is a correlation-causation error — it comes from observing mega-accounts like Elon Musk’s, whose reach comes from built-in audience size, not hashtag abstinence, per Hashtagtools.io. For accounts under 500,000 followers — the overwhelming majority of enterprise brand accounts — 1–2 well-chosen hashtags integrated naturally into post text still outperform zero hashtags by roughly 21%.
Why AI and Climate Content Specifically Benefit From This Shift
AI and climate change are named among X’s core evergreen topical hashtag categories in 2026, alongside crypto, sports, and entertainment, according to SocialRails’ hashtag generator data. Both categories share a structural advantage under the reply-weighted algorithm: they are inherently debate-generating topics that naturally produce the conversation-quality signals (thoughtful replies) the 2026 algorithm now prioritizes over passive engagement (likes).
Hashtag Placement Mechanics That Actually Move Engagement
Mid-tweet hashtag placement performs best for engagement — for example, embedding a hashtag naturally within a results-oriented sentence (“This strategy boosted our #ClimateFinance conversions by 37%”) consistently outperforms hashtags front-loaded at the start of a post, according to ContentStudio. Starting a tweet with a hashtag is specifically flagged as an underperforming pattern.
A Three-Category Hashtag Framework for Brand Strategy
Effective 2026 hashtag strategy separates into three distinct categories that should not be mixed indiscriminately, per Hashtagtools.io:
- Trending (real-time moments): High reach, short window — appropriate for brands commenting on breaking AI policy news or climate summit outcomes in real time.
- Evergreen topical (industry tags): Moderate, steady reach — #AI, #ClimateChange, #Sustainability-category tags appropriate for always-on brand content.
- Branded (campaign-specific): Built for tracking and community-building rather than discovery — appropriate for proprietary campaign hashtags tied to specific initiatives.
The recommended combination for news-cycle-adjacent content (e.g., a brand responding to a climate summit or AI regulation announcement): one trending + one evergreen topical hashtag, reserving pure branded tags for owned-campaign content rather than reactive posts.
Content Strategy Implications for Enterprise Brands
Given the 27x reply-weighting, brand content strategy for AI and climate topics should shift measurably toward content designed to generate substantive replies rather than passive approval:
- Publish defensible, specific claims (with data, not vague sentiment) on AI capability or climate commitments — specific claims generate substantive disagreement or validation replies; vague statements generate likes without replies.
- Engineer the first-30-minutes window deliberately. Engagement velocity in the first 30 minutes determines whether a post gets amplified — 10+ engagements in that window triggers broader algorithmic amplification, according to Teract.ai. Brands should coordinate initial-response teams or stakeholder networks to seed early replies on strategically important posts.
- Avoid spam-trigger patterns explicitly flagged by the 2026 algorithm: excessive hashtags, repetitive content, external links in the first tweet of a thread, and engagement-bait phrasing, per Teract.ai.
What Brands Should Avoid in 2026
- Hijacking unrelated trending hashtags to attach an AI or climate message to unrelated viral moments — explicitly flagged as a shadowban risk factor by SocialRails.
- Hashtag stuffing on climate or AI announcement posts — 5+ hashtags produces a documented 40% engagement penalty, directly counterproductive for high-stakes brand announcements.
- Treating hashtag strategy as a substitute for content quality. Per AutoTweet’s 2026 guide, a post with the perfect hashtag but poor content won’t go anywhere — hashtags open the door, but reply-generating content quality is what keeps it open.
The Bottom Line
The brands winning AI and climate visibility on X in 2026 are not the ones deploying the most hashtags — they’re the ones building specific, defensible content that generates substantive reply threads, using 1–2 well-placed evergreen or trending hashtags as a modest discovery boost rather than a primary growth lever. Any brand strategy still built around hashtag volume or front-loaded hashtag placement is optimizing for an algorithm that no longer exists.
Discover more from The Economy
Subscribe to get the latest posts sent to your email.
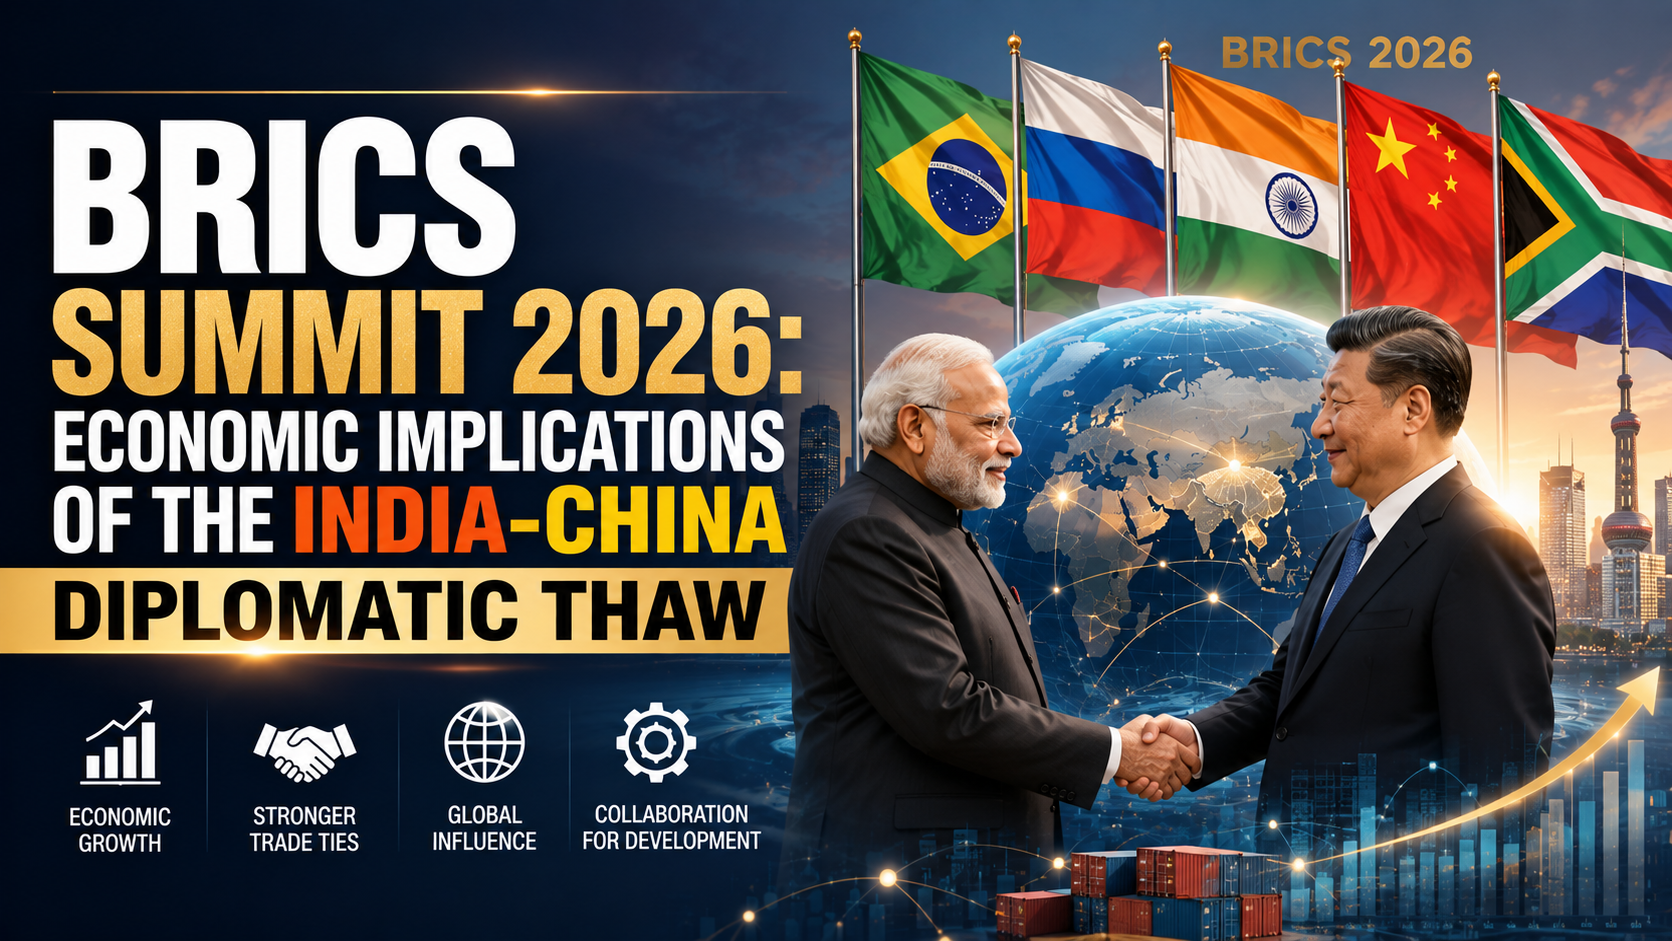
Chinese President Xi Jinping is expected to travel to New Delhi on September 12–13, 2026, for the 18th BRICS Summit — his first visit to India in six years, and the clearest signal yet that Beijing and New Delhi are prepared to move past the 2020 Galwan Valley border clash, according to Indian Defence News. For enterprise strategists and investors positioned across South Asian and Chinese supply chains, this is not a symbolic handshake — it is a signal event with direct implications for trade flows, tariff exposure, and capital competition across the Global South.
From Galwan to Kazan to New Delhi: The Timeline
The normalization process has moved in deliberate stages, not a single reset:
- October 2024 — Kazan, Russia: Modi and Xi meet on the sidelines of the BRICS summit, the first formal meeting since 2019, following a border disengagement agreement, according to The Diplomat.
- 2025 — Resumption of high-level visits: India’s defense and external affairs ministers visited Beijing; China’s Foreign Minister Wang Yi visited New Delhi, producing several bilateral agreements, per The Diplomat.
- August 2025 — Tianjin SCO Summit: Modi and Xi met again, described as the culmination of the resumed high-level engagement.
- May 2025 — India-Pakistan conflict stress test: The thaw survived Beijing providing military and political support to Islamabad against India during a brief conflict — evidence the normalization is now resilient to shocks, per The Diplomat.
- September 12–13, 2026 — New Delhi BRICS Summit: India chairs BRICS for a fourth time, hosting Xi for the first time since 2019, per Indian Defence News.
Why Now: The Strategic Logic on Both Sides
For Beijing, sustaining a frozen conflict with a rising economic power while simultaneously managing friction with Washington over the South China Sea and Taiwan Strait has become strategically costly, per Indian Defence News. For New Delhi, hosting Xi under the multilateral BRICS umbrella allows Modi to project global statesmanship while engaging Beijing without appearing to unilaterally concede on unresolved border issues.
Crucially, analysts at the China-Global South Project note the 2026 dynamic is being shaped primarily by regional realities and a deliberate decoupling of economic cooperation from security disputes — not by U.S. trade pressure, even though Trump-era tariff policy has often been cited as a contributing factor.
Where the Economic Exposure Sits
Import Dependency: India’s Structural Vulnerability
India’s supply chains remain heavily dependent on Chinese intermediate goods, particularly in pharmaceuticals and electronics, according to Indian Defence News. Any further normalization of technology-investment restrictions — India banned a range of Chinese tech applications and tightened border-nation investment rules after Galwan — would be the single highest-impact policy shift for enterprise B2B supply chain planners in the region.
The BRICS Bloc Itself: Expanded and More Consequential
The 2026 summit occurs against a materially expanded BRICS bloc. Since the original five-member group, Egypt, Ethiopia, Iran, Saudi Arabia, and the UAE joined in 2024, and Indonesia joined in 2025, per the official BRICS 2026 site — with ten additional partner countries (Belarus, Bolivia, Cuba, Kazakhstan, Malaysia, Nigeria, Thailand, Uganda, Uzbekistan, Vietnam) joining in 2025. The bloc’s prior Rio summit produced a Leaders’ Framework Declaration proposing to mobilize $300 billion annually by 2035 for climate finance, according to Business Standard.
Trade & Investment Exposure Matrix
| Sector | Pre-Thaw Position (2020–2024) | Post-Thaw Trajectory (2025–2026) | Enterprise Risk/Opportunity |
|---|---|---|---|
| Pharmaceuticals (API imports) | Heavy Indian dependency on Chinese active pharmaceutical ingredients | Potential easing of investment friction | Opportunity: supply diversification talks; Risk: continued single-source dependency |
| Electronics/consumer tech | Chinese app bans, investment screening for border-sharing nations | Selective, cautious relaxation possible | Watch for FDI rule changes ahead of/after the summit |
| Border trade | Suspended since 2020 | Partial resumption of trade at three border outposts | Direct logistics opportunity for regional trade B2B services |
| Africa infrastructure/capital | Parallel, competing Chinese BRI and Indian maritime/digital investment | Continued competition, not cooperation | Africa remains contested capital-deployment theatre, per Indian Defence News |
| AI governance | No joint framework | BRICS Leaders’ Statement on Global AI Governance (Rio) | Multilateral framework emphasizing Global South inclusion, UN-led process |
Sources: Indian Defence News, The Diplomat, Business Standard — see citations above.
What to Watch at the September Summit
- Border trade mechanics: Whether the Working Mechanism for Consultation and Coordination produces concrete friction-point resolutions in eastern Ladakh ahead of the summit, per Indian Defence News.
- Investment-screening rule changes: Any signal India will ease its border-nation FDI restrictions would be the most direct enterprise-relevant outcome.
- Africa positioning: Whether joint statements address, rather than paper over, competing Chinese BRI and Indian maritime-security/digital-investment strategies across the continent.
- AI governance follow-through: Concrete mechanisms building on the Rio AI governance statement, relevant to any enterprise operating AI infrastructure across BRICS-aligned markets.
The Caveat: This Is a Thaw, Not a Resolution
Independent policy analysis from the ISAS Brief is explicit that the Kazan-era thaw has not resolved bilateral mistrust or delivered progress on sensitive issues — it has stabilized the border and eased some economic restrictions without addressing the underlying territorial dispute. The China-Global South Project similarly notes India continues to treat Beijing with caution in the security domain even as it normalizes economic engagement. Investors should read the September summit as confirmation of a durable, deliberate de-escalation track — not as a signal that structural India-China rivalry has been resolved.
The Bottom Line
The India-China thaw formalized at the New Delhi BRICS Summit represents a genuine, multi-year, deliberately sequenced de-politicization of economic relations between two of the world’s largest economies — but one that leaves core security and territorial disputes unresolved. For enterprise and investment strategists, the actionable signal is narrower than “US-China rapprochement” headlines suggest: watch FDI screening rules, pharmaceutical/electronics supply-chain diversification announcements, and border-trade resumption specifics, not broad geopolitical sentiment.
Discover more from The Economy
Subscribe to get the latest posts sent to your email.
Emerging and developing economies face refinancing needs of more than $9 trillion in 2026, according to the Institute of International Finance’s Global Debt Monitor — the largest wall of maturing sovereign and corporate debt these markets have ever faced simultaneously. At the center of that system sits China, now the single largest issuer of emerging-market sovereign debt and, increasingly, the largest bilateral lender of last resort when smaller economies can’t refinance on their own. For institutional investors and foreign-policy-adjacent business strategists, understanding China’s dual role — dominant issuer and dominant creditor — is now a prerequisite for pricing emerging-market risk correctly.
Editorial note on sourcing: a specific figure describing a discrete “$1.3 billion” China sovereign refinancing transaction could not be independently verified against primary reporting at the time of writing. This article instead builds its analysis on verified, dated figures from the OECD, IIF, Moody’s, and peer-reviewed research, and any deal-level claim should be confirmed against primary sources (finance ministry statements, rating-agency releases) before publication or citation.
China’s Dual Role: Issuer and Creditor of Last Resort
China accounted for 45% of total EMDE sovereign bond issuance in 2024, up sharply from just 17% in the 2007–2014 period, according to the OECD’s Global Debt Report 2025. By 2025, China remained the top borrower among a concentrated group — China, India, Brazil, Egypt, and Argentina together represented 78% of EMDE central-government borrowing, per the OECD’s Global Debt Report 2026.
Domestically, Beijing has simultaneously executed one of the largest local-government debt refinancing programs in history: a 6 trillion yuan (roughly $839 billion) swap of “hidden” local-government debt into standardized bonds, approved in late 2024 and implemented through 2026, according to VOA News. By mid-2026, Chinese provinces had used nearly 94% of that swap allowance, according to Bloomberg.
Internationally, China has also re-entered dollar sovereign bond markets at scale — its 2026 international offering was reported as its largest ever, oversubscribed well beyond target, according to Business Standard/Reuters reporting on the prior comparable issuance. This dual positioning — massive domestic refinancing plus expanding international issuance — gives China outsized influence over EM bond-market liquidity and pricing benchmarks that smaller sovereigns then reference for their own issuance.
The $9 Trillion Wall: Why 2026 Is Different
The scale of what’s coming due matters more than any single deal. Key figures from the IIF’s Global Debt Monitor and OECD’s 2026 report:
- Gross EMDE central-government borrowing crossed $4 trillion in 2025, up from roughly $3 trillion in 2024.
- Around 36% of outstanding EMDE bond stock matures within three years.
- Low-income countries face the sharpest cliff: 52% of their outstanding bonds mature by 2028, with 29% due by the end of 2026 alone.
- Secondary-market yields on maturing debt now exceed 10% for non-investment-grade sovereigns, meaning refinancing at current rates locks in materially higher debt-service costs than the original issuance.
Refinancing Cost Comparison: Then vs. Now
| Issuer Tier | Original Issuance Yield (illustrative range) | 2026 Refinancing Yield | Refinancing Risk |
|---|---|---|---|
| Investment-grade EMDEs (e.g., select Gulf, Southeast Asia sovereigns) | 3–5% | 5–7% | Moderate — absorbable within fiscal space |
| Non-investment-grade EMDEs | 6–8% | 10%+ | High — debt-service costs rising faster than revenue growth |
| Low-income issuers (heavy China bilateral exposure) | Concessional/below-market | Market-rate or restructured terms | Severe — 29% of debt stock matures by end of 2026 |
Source: OECD Global Debt Report 2025/2026 (see citations above); ranges are illustrative of documented tier-level trends, not specific bond issues.
The Restructuring Precedent: What Happens When Refinancing Fails
China’s response to sovereign distress has evolved into a distinct pattern that investors increasingly price into risk premiums. Research published via the National Bureau of Economic Research documents a rising trend of “re-structurings” — repeated restructurings of the same debt with the same creditor — echoing the drawn-out resolution patterns of prior global debt crises. Angola, Ecuador, Seychelles, Sri Lanka, and Venezuela have each undergone two or more restructurings with Chinese state creditors.
Sri Lanka’s case is illustrative of the mechanics: China Development Bank extended a $500 million financing facility in 2020, and a subsequent equity-linked arrangement brought in $1.12 billion in cash that Colombo used to repay non-Chinese creditors, according to Oxford Academic’s International Affairs journal. These bilateral bridge arrangements illustrate how China’s rescue lending functions as a parallel track to traditional Paris Club-style restructuring — often faster to arrange, but less transparent to third-party bondholders pricing the same sovereign’s risk.
Regional Ripple Effects: Where Investors Should Watch Closely
Direct Exposure Zones
- Sub-Saharan Africa: Heaviest concentration of low-income issuers facing near-term maturity walls and prior China restructuring history (Angola, Zambia).
- South Asia: Sri Lanka’s precedent shapes how markets price Pakistan and Bangladesh refinancing risk.
- Latin America: Ecuador and Venezuela carry documented repeat-restructuring histories; Argentina remains among the top-five EMDE borrowers by volume.
Indirect / Second-Order Exposure
- Gulf and Southeast Asian investment-grade sovereigns face rising benchmark yields even without direct restructuring risk, simply because China’s issuance volume moves the EM bond-pricing benchmark broadly.
- Enterprise B2B lenders and trade-finance providers operating in these corridors should treat sovereign-refinancing stress as a leading indicator of counterparty and currency risk, not a lagging one.
An Investor Risk-Monitoring Framework
- Track maturity-wall concentration, not headline debt-to-GDP. A country with moderate debt-to-GDP but a heavy 2026–2028 maturity cliff carries more near-term risk than a higher-leverage country with a smoothed maturity profile.
- Distinguish China’s domestic refinancing (yuan-denominated, largely contained) from its role as an external EM creditor (dollar/foreign-currency exposure, higher spillover risk).
- Watch for repeat-restructuring signals. Countries with a prior China restructuring are statistically more likely to require another, per the NBER research above — treat this as a standing risk flag, not a one-time resolved event.
- Monitor secondary-market yield spreads on maturing debt versus issuance-year yields as the clearest real-time signal of refinancing stress building in a specific sovereign.
The Bottom Line
China’s simultaneous role as the largest domestic debt-refinancer in EM history and the most influential external creditor to distressed sovereigns makes it the single most important variable in the 2026 emerging-market debt outlook. The $9 trillion refinancing wall isn’t a uniform risk — it’s concentrated in low-income issuers with the heaviest prior China bilateral exposure, and that concentration is exactly where enterprise investors, trade-finance providers, and sovereign-risk analysts should be focusing due diligence through the remainder of 2026.
Discover more from The Economy
Subscribe to get the latest posts sent to your email.

Luxury Wellness: The Monetization and Expansion of Boutique Low-Impact Training

Leveraging Viral AI & Climate Hashtags for Brand Growth on X

The Medicaid Churn: Front-End Revenue Cycle Risks for Enterprise Hospitals

The 2026 Crypto Regulatory Shift: What It Means for Institutional Investors

AI-Powered Training: The Next Multi-Billion Dollar Ecosystem in Fitness

BRICS Summit 2026: Economic Implications of the India-China Diplomatic Thaw

Emerging Market Debt: The Ripple Effect of China’s Sovereign Refinancing Role

Dropping Oil & Surging Gold: Navigating Safe-Haven Investments in Q3

2026 AI Stock Frenzy: How to Position Your Portfolio

The AI Disruption in Financial Risk Management: Moving Beyond Record Banking Profits

The Rise of Green Aviation: Balancing High Fuel Prices with Sustainable Infrastructure

US-China Relations in Q3 2026: Trade Tariffs and Supply Chain Risks

Emerging Markets Rebound: Top Stock Strategies for the Gulf and South Asia

Tackling the 2026 Global Food Crisis: Policy Shifts and Market Speculation

China Politburo July 2026: Stimulus Signals Explained

Russia Fuel Shortages 2026: Inside a Cracking War Economy

Top 15 Financial Stocks for Investment in PSX

State Farm’s $5B Dividend 2026: Who Qualifies & Payout Dates

Pakistan Passed Its Third IMF Review

SpaceX Stock Lockup Expiration Explained: Why $123B in Shares Could Hit the Market

Pakistan IMF Program 2026: Inside the Push Toward an Interest-Free Economy

Russia Oil Revenue 2026: How Sanctions on Rosneft and Lukoil Are Draining the War Chest

Andy Burnham, UK Gilts and Mortgages: July 2026 Explainer

Gold Price 2026: Why Bullion Has Fallen 25% From Its January Record High

Pakistan’s 2026 Monsoon Floods Threaten Fragile Economic Recovery as Inflation Nears 9%

Russia Oil Revenue 2026: The Iran War Windfall and What a Hormuz Deal Means for Moscow

Canada US Trade War 2026: Inside Carney’s Push to Cut Ties With Trump’s Tariffs

Russia’s Budget Deficit Blew Past Its Full-Year Target in Three Months
-

 Markets & Finance8 months ago
Top 15 Stocks for Investment in 2026 in PSX: Your Complete Guide to Pakistan’s Best Investment Opportunities
-

 Analysis6 months ago
Johor’s Investment Boom: The Hidden Costs Behind Malaysia’s Most Ambitious Economic Surge
-

 Analysis6 months ago
Top 10 Stocks for Investment in PSX for Quick Returns in 2026
-

 Analysis7 months ago
Brazil’s Rare Earth Race: US, EU, and China Compete for Critical Minerals as Tensions Rise
-

 Banks7 months ago
Best Investments in Pakistan 2026: Top 10 Low-Price Shares and Long-Term Picks for the PSX
-

 Investment8 months ago
Top 10 Mutual Fund Managers in Pakistan for Investment in 2026: A Comprehensive Guide for Optimal Returns
-

 Global Economy8 months ago
15 Most Lucrative Sectors for Investment in Pakistan: A 2025 Data-Driven Analysis
-

 Global Economy8 months ago
Pakistan’s Export Goldmine: 10 Game-Changing Markets Where Pakistani Businesses Are Winning Big in 2025