
Economic Reforms
Moving Thailand Forward: Between Stability and Reform
Thailand’s February 8 general election delivered something the kingdom has not seen in years: a decisive, unambiguous result. Whether it delivers something more valuable — genuine progress on Thailand political stability and reform — is a question that will define the next half-decade.
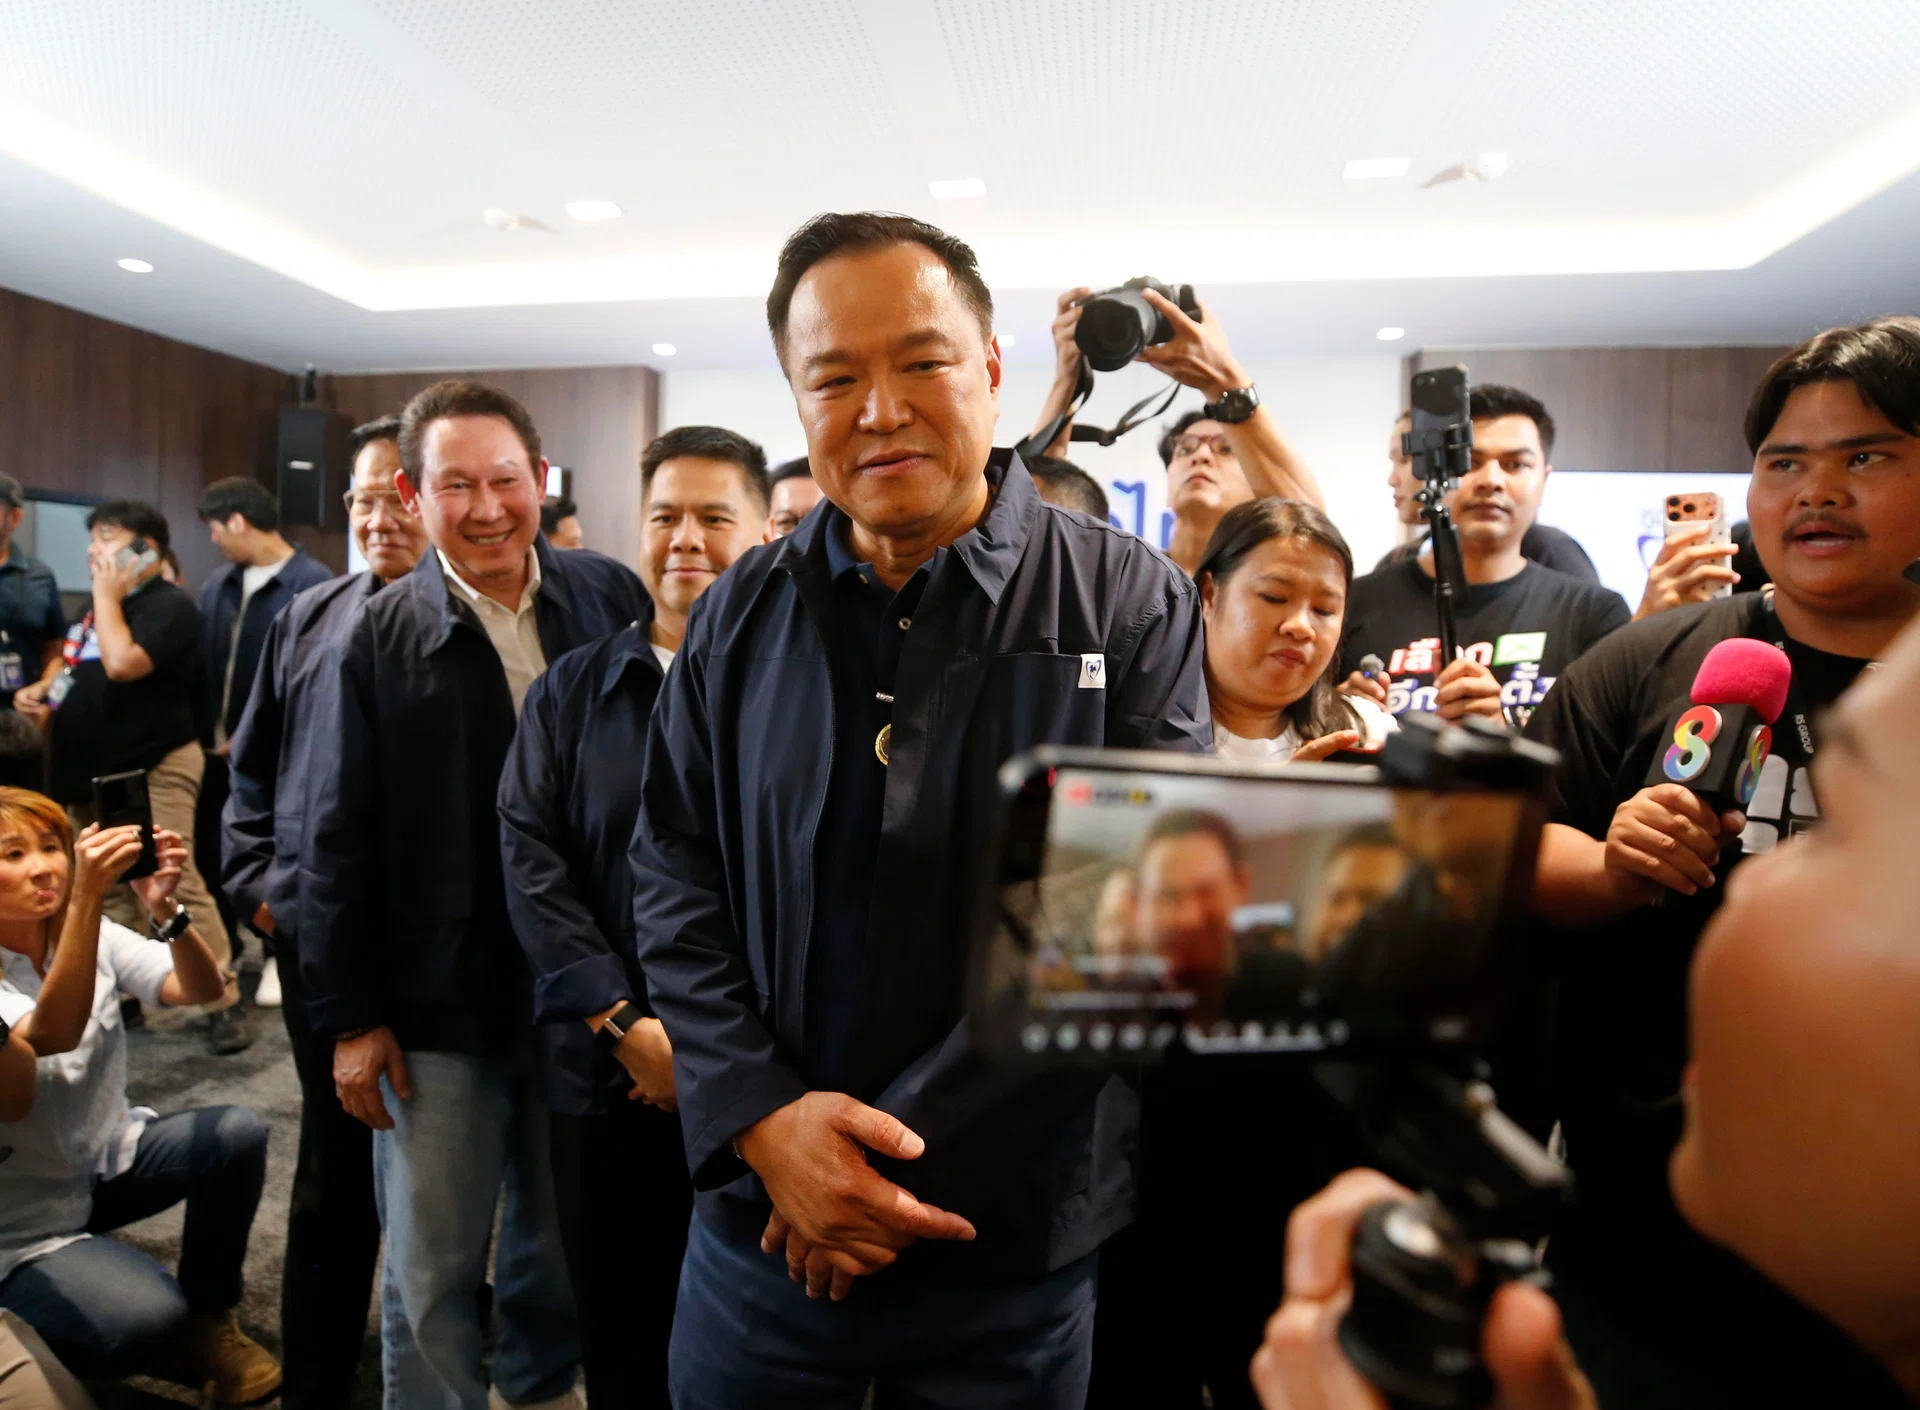
On a warm Sunday in Bangkok, millions of Thais cast ballots in what polling firms and diplomatic observers alike described as a three-way race with an unusual degree of suspense. By Monday morning, the outcome had clarified into a commanding plurality for the Bhumjaithai Party (BJT), led by former Deputy Prime Minister Anutin Charnvirakul. Preliminary seat counts placed BJT between 193 and 194 seats in the 500-seat parliament — enough to anchor a coalition government without resorting to the tortured political bartering that has historically destabilized Thai governments before they could take a single meaningful step.
Markets exhaled. The baht strengthened against the dollar in early-week trading. Foreign investors, long wary of the revolving door at the Government House, expressed cautious optimism. But experienced Thailand watchers warned that relief is not reform — and that the country’s structural challenges will outlast any single election victory.
How They Won: Thailand Election 2026 Results and the Coalition Math
The Thailand election 2026 results crystallised a new political hierarchy. According to Reuters, Bhumjaithai’s near-200-seat haul positions Anutin Charnvirakul to form what could be the country’s most stable coalition in a decade. The People’s Party, a progressive formation that had surged in earlier polling, secured between 116 and 118 seats — significant but insufficient to challenge for the prime ministership outright. Pheu Thai, the party that has historically drawn its strength from rural northern and northeastern Thailand, claimed 74 to 76 seats, while the newly prominent Kla Tham party secured 58 seats.
| Party | Seats Won | Key Policy Focus | Coalition Role |
|---|---|---|---|
| Bhumjaithai (BJT) | 193–194 | Rural development, cannabis policy, healthcare | Lead party |
| People’s Party | 116–118 | Constitutional reform, youth rights | Opposition |
| Pheu Thai | 74–76 | Populist economics, northern/northeastern base | Potential junior partner |
| Kla Tham | 58 | Security, conservative nationalism | Potential junior partner |
A coalition anchored by BJT with Pheu Thai as a junior partner would command a workable majority. More complicated is the prospect of Kla Tham joining that coalition. The party’s leader, Thammanat Prompow, carries the burden of a prior conviction in Australia for heroin smuggling — a fact that has drawn pointed criticism from civil society groups and Western diplomatic missions. His inclusion in any cabinet configuration will test Anutin’s stated commitment to clean governance, and it will be scrutinised by international creditors and investors calibrating Thai coalition government prospects.
According to BBC News, election officials acknowledged scattered reports of voting irregularities, though no systematic tampering was alleged. Opposition voices, particularly within the People’s Party, called for scrutiny of certain constituency results. A credible resolution of these concerns will be essential to cementing the legitimacy of whichever government emerges — legitimacy being a currency Thailand has spent recklessly in recent years.
The Ghosts of Instability Past
To understand why even a modest degree of stability feels like a breakthrough, it is necessary to account for what preceded it. Thailand has cycled through three prime ministers in recent years under circumstances that ranged from judicial intervention to constitutional manoeuvring. Srettha Thavisin was dismissed in 2024 following a Constitutional Court ruling. Anutin himself served as caretaker prime minister in that interregnum. Before Srettha, the country endured years of post-coup governance that left democratic institutions hollowed and public trust depleted.
Street protests — some peaceful, others marred by violence — periodically paralysed central Bangkok, throttling tourism revenues and frightening away foreign direct investment. Images of water cannons on Ratchadamnoen Avenue circulated globally, attaching to Thailand the unflattering label of the “sick man of Asia” — a characterisation that economists at Bloomberg have applied to its economic trajectory as much as its political dysfunction.
That label stings precisely because it is not entirely unfair. A nation that once aspired to upper-middle-income status by 2030 has found itself mired in a growth corridor of one to two percent annually — competent enough to avoid crisis, insufficient to generate the prosperity its population deserves.
The Economic Rebound: From “Sick Man” to Stability?
The numbers tell a story of modest improvement punctuated by persistent structural drag. Thailand economy growth 2026 is projected at between 1.5 and 2.5 percent, with a median estimate of around 2 percent — a slight uptick from the 2.4 percent recorded in 2025, but hardly the breakout performance that regional peers like Vietnam or Indonesia have managed to sustain. The proximate causes of underperformance are well-documented: household debt elevated above 85 percent of GDP, export volumes still recovering from global supply-chain reconfigurations, and tourism arrivals that remain below pre-pandemic peaks despite a meaningful recovery in Chinese visitor numbers.
Economic Snapshot: Thailand 2026
- GDP Growth Forecast: 1.5–2.5% (median 2%)
- Household Debt: ~85% of GDP
- Tourism Recovery: Ongoing but below pre-2020 peaks
- Baht: Strengthened post-election on stability signals
- Inflation: Moderate; central bank maintaining accommodative stance
The World Bank’s Thailand Economic Monitor for February 2026 identifies advanced green manufacturing as the most credible near-term pathway toward higher-value economic activity. Thailand’s existing automotive manufacturing base — particularly its dominant position in internal combustion engine vehicles — creates both an opportunity and a vulnerability as global demand pivots to electric vehicles. The Monitor notes that without deliberate industrial policy to facilitate this transition, Thailand risks watching its manufacturing comparative advantage erode within a decade.
Post-election, equity markets extended modest gains, and the baht’s strengthening reflected investor sentiment that a stable government could at least create the preconditions for reform. But analysts at regional banks were quick to contextualise the optimism: political stability is a necessary condition for economic progress, not a sufficient one. Markets can price in a stable government; they cannot price in political will that has not yet been demonstrated.
Potential Coalition Partners and Controversies
The architecture of any BJT-led government will speak volumes about Anutin’s intentions. The most consequential decisions are less about which parties join the coalition and more about which reform commitments survive the coalition negotiations intact.
A partnership with Pheu Thai carries the advantage of geographic and demographic breadth — the party commands deep loyalty in Thailand’s populous northern and northeastern regions, constituencies that will be essential to any government seeking to address rural inequality. The disadvantage is Pheu Thai’s complex relationship with the Shinawatra political network, which continues to carry both substantial popular support and a divisive legacy in Thai politics.
The Kla Tham controversy is the coalition’s most visible wild card. Thammanat Prompow’s heroin smuggling conviction in Australia in the 1990s has never faded from public consciousness, despite his subsequent reinvention as a conservative nationalist politician. His party’s 58 seats are arithmetically useful to the coalition, but his ministerial ambitions — if accommodated — would invite sustained scrutiny from international partners and domestic civil society alike. The decision Anutin makes here will be read as an early indicator of how seriously his government takes its own anti-corruption commitments.
The Democrats and other smaller formations remain unlikely coalition partners. Abhisit Vejjajiva’s political trajectory, for instance, has been defined by positions that do not easily align with BJT’s pragmatic centrism. Coalition negotiations are expected to conclude within weeks, with investors and diplomats watching each appointment announcement closely.
Beyond Stability: The Case for Deeper Structural Reform
The most searching question raised by the Thailand election 2026 results is not who won, but what winning now obligates the victors to attempt. A partial list of the structural reforms that analysts across the political spectrum identify as necessary — and that previous governments have repeatedly deferred — would include:
- Constitutional revision: The current constitution, drafted under post-coup conditions, retains provisions that constrain democratic accountability. A referendum-led rewrite has been debated for years but never reached implementation.
- Monopoly reform: Concentration in key sectors — energy, telecommunications, retail — constrains competition, suppresses productivity growth, and widens inequality. Meaningful liberalisation would require confronting business conglomerates with deep political connections.
- Education and skills investment: Thailand’s workforce is being asked to pivot toward higher-value manufacturing and services at a moment when the education system has not kept pace with the demands of that pivot.
- Agricultural modernisation: Rural incomes remain vulnerable to commodity price cycles and climate shocks. Long-promised support for smallholder transition to higher-value crops has been fitful at best.
As Bloomberg observed in a pre-election analysis, Thai voters have repeatedly demonstrated a willingness to vote for change — and have repeatedly received something that more closely resembles continuity. The risk with a strong Bhumjaithai mandate is that the stability it promises becomes an end in itself, insulating incumbents from the pressure to reform rather than enabling it.
The Reuters dispatch from Bangkok on election night captured a telling ambivalence in voter interviews: pride that the country had produced a clear result, tempered by a kind of experienced scepticism about whether the result would translate into the tangible improvements — better jobs, lower living costs, cleaner air, accountable governance — that had brought voters to polling stations in the first place.
Will Stability Enable Reform? A Forward Reckoning
The answer depends almost entirely on whether Anutin Charnvirakul and the government he assembles possess two qualities that have been conspicuously absent from recent Thai administrations: policy credibility and institutional courage.
Policy credibility means setting a reform agenda that is specific enough to be measured, costed, and evaluated — not the broad rhetorical commitments that dissolve on contact with coalition arithmetic. It means, concretely, that the World Bank’s green manufacturing recommendations find legislative expression, that the constitutional reform debate is advanced with genuine intent rather than used as a bargaining chip, and that macroeconomic policy targets are framed in terms that independent economists can audit.
Institutional courage means being willing to make decisions that antagonise the entrenched interests — economic conglomerates, bureaucratic fiefdoms, politically connected networks — whose cooperation helped put BJT in power. Historically, this is where Thai governments have faltered. The mathematics of coalition politics create incentives for appeasement rather than confrontation, and the reform agenda is always the first casualty of the negotiating table.
Thailand is not without assets. Its infrastructure is relatively well-developed for a middle-income country. Its geographic position in Southeast Asia makes it a natural logistics hub. Its tourism brand, despite the damage of recent years, retains genuine global appeal. Its people — as those same protest movements demonstrated — are politically engaged, economically aspirational, and quite capable of holding governments accountable when institutions allow it.
The February 8 election has given Thailand something rare and valuable: a government with a clear mandate, a degree of political breathing room, and an international community that is, for once, broadly willing to extend cautious goodwill. What it does with those gifts will determine whether the “sick man of Asia” narrative is finally retired — or simply deferred to the next electoral cycle.
The baht has strengthened. The markets have exhaled. Now Thailand must answer the harder question: does Thailand political stability and reform mean stability for reform, or stability instead of reform?
Discover more from The Economy
Subscribe to get the latest posts sent to your email.


International Trade
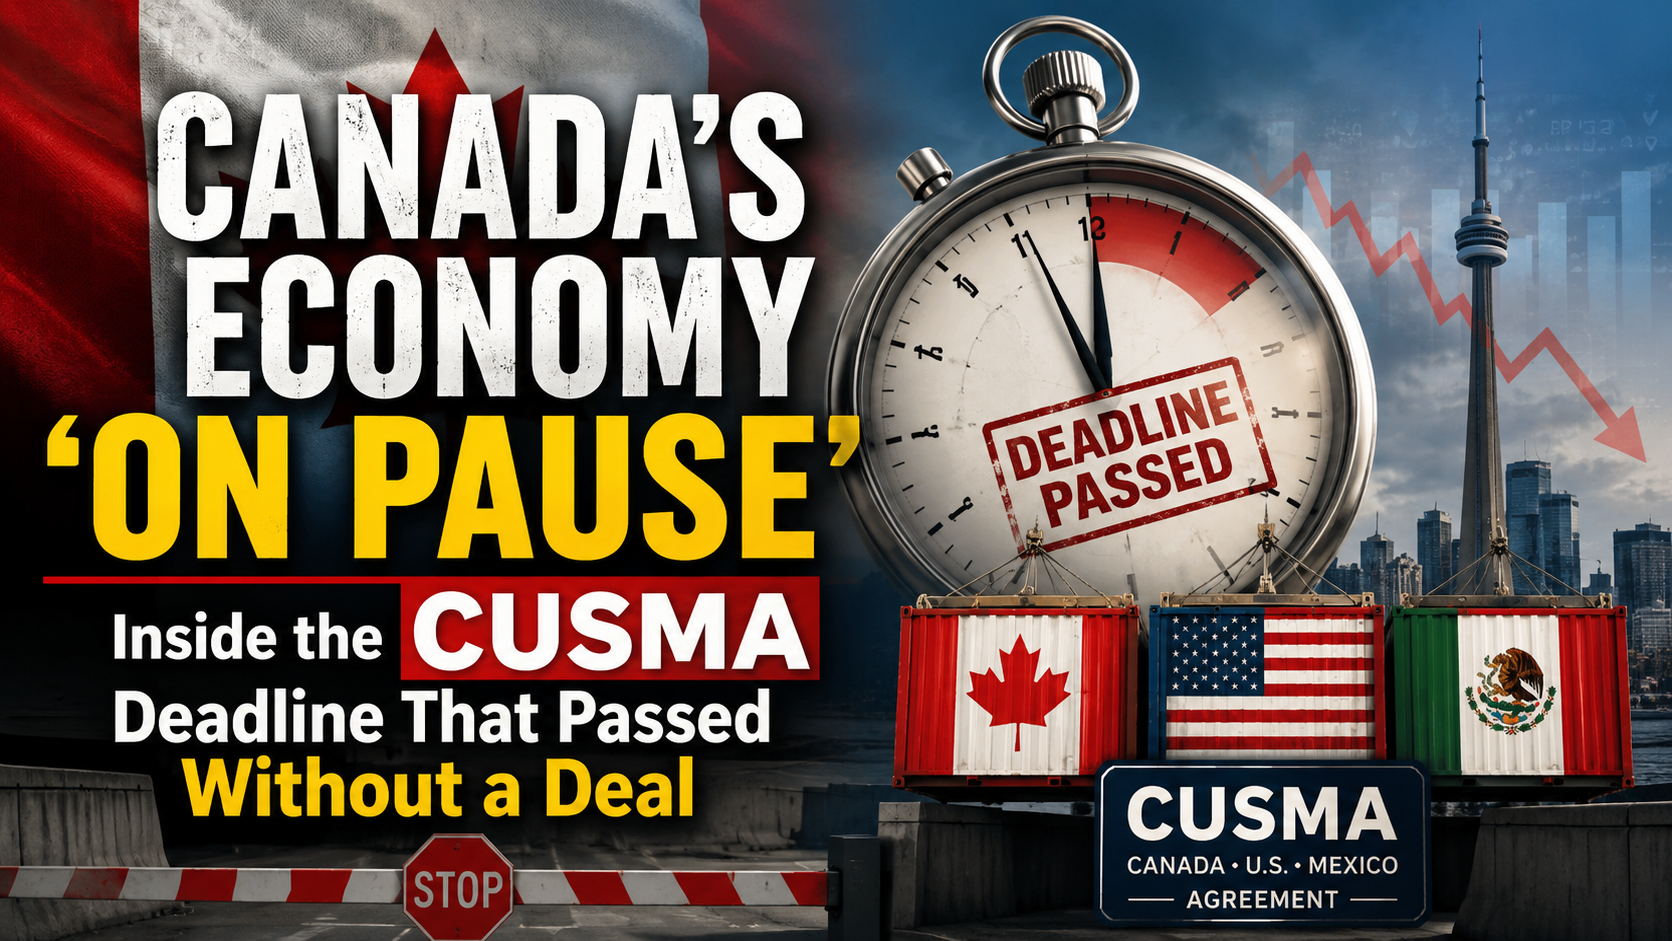
Canada’s Economy ‘On Pause’: Inside the CUSMA Deadline That Passed Without a Deal
Introduction
July 1, 2026 was supposed to be a milestone for North American trade certainty. Instead, the mandatory review deadline for the Canada-United States-Mexico Agreement (CUSMA) passed with U.S. tariffs still firmly in place and no new framework agreed, leaving Canada’s trade-exposed sectors in what Deloitte has bluntly called an economy “on pause” (Global News/Deloitte). For a G7 economy where trade with the United States touches nearly every major industry, that pause carries a real and measurable cost.
What Actually Happened at the Deadline
CUSMA’s built-in review mechanism gave the three signatories three broad paths: renew for another 16 years under current terms, extend for 10 years with annual reviews, or negotiate an entirely new framework (Global News/Deloitte). Canada and Mexico both pushed for the longer 16-year extension to lock in certainty for investors, while reporting around the deadline indicated the U.S. side was, at best, ambivalent about the agreement’s future — with commentary suggesting an openness to seeing it terminated rather than renewed (Global News/Deloitte). No resolution was reached, meaning the review process could now stretch out for years, and existing U.S. tariffs on Canadian steel, aluminum and automobiles remain in effect even as Canada removed most of its own counter-tariffs on U.S. goods back in September 2025 in a goodwill gesture (Canada.ca).
The Economic Cost, in Numbers
The damage is already visible in the trade data. Canada’s exports to the United States fell roughly 10% over the past year, and the Bank of Canada projects national GDP will finish 2026 approximately 1.5% below its pre-tariff trajectory, with roughly half of that shortfall attributable to reduced potential output rather than a temporary demand shock (The Hub). Statistics Canada’s own spring 2026 review found nominal exports to the U.S. were 11.1% lower than March 2025 levels and 16.7% lower than December 2024 levels by year-end 2025, with imports from the U.S. also down roughly 9.8% over the same window (Statistics Canada).
Forecasts for the year diverge depending on how quickly the trade relationship stabilizes. Deloitte projects just 0.7% GDP growth for 2026, down from 1.7% in 2025, citing low business confidence tied directly to CUSMA uncertainty (Global News/Deloitte). Signal49 Research is somewhat more optimistic at 0.5%, but explicitly frames 2026 as “the storm before the calm,” projecting a rebound to 2.1% growth in 2027 if tariff relief materializes as expected (Newswire.ca/Signal49 Research).
Not All Bad News: Diversification and a Recovering Export Sector
The picture is not uniformly negative. Export volumes have shown signs of recovery, moving back above pre-tariff levels in March and April 2026, supported by rising energy production and higher commodity prices (Business Council of Canada). More structurally significant, Canada’s exports to non-U.S. markets have surged, pushing the non-U.S. share of Canadian exports to its highest level in more than four decades, driven largely by gold and energy shipments (Global Affairs Canada, State of Trade 2026). That diversification push has been assisted by an unlikely source: an October 2024–January 2026 Canada-China trade dispute, sparked by Canadian pushback on Chinese EV and steel subsidies, was resolved via a preliminary agreement in January 2026 under Prime Minister Mark Carney, reopening a market Canadian exporters had leaned into as U.S. access tightened (Wikipedia/Canada–China trade war).
Public Opinion Points Toward a Deal — On Both Sides of the Border
Perhaps the most underreported data point in this story is the polling. A spring 2026 University of Calgary survey conducted by Ipsos Public Affairs and Nanos Research found 73% of Canadians and 58% of Americans support deeper bilateral economic cooperation, while support for a trilateral free trade deal reaches 88% in Canada and 56% in the U.S. (The Hub). Just 8% of Americans surveyed describe Canada as a major economic challenge — the lowest of any country tested, far below the 49% who named China, suggesting the political appetite for a renewed deal exists even if the negotiating timeline has stalled (The Hub).
The Bank of Canada’s Response
With growth soft and inflationary pressure contained, the Bank of Canada is expected to hold its policy rate steady at 2.25% throughout the forecast period, as sluggish domestic growth and an elevated unemployment rate keep broader price pressures in check — a marked contrast to the U.S. Federal Reserve, which faces stickier inflation closer to 3.6% and correspondingly less room to cut (Newswire.ca/Signal49 Research).
Labour Market: Steady on the Surface, Strained Underneath
Headline employment indicators have held up reasonably well through mid-2026, with full-time job creation surging in April and wages remaining firm. But the Business Council of Canada cautions that youth unemployment remains elevated, tariff-exposed sectors continue to struggle, and hiring overall stays subdued as firms wait for clarity on the trade file before committing to expansion (Business Council of Canada).
Key Takeaways
- The CUSMA review deadline passed July 1, 2026 without a new agreement, leaving U.S. tariffs on steel, aluminum and autos in place indefinitely.
- Canadian GDP is projected to land between 0.5% and 0.7% growth for 2026 — well below 2025’s 1.7% — with the Bank of Canada estimating a 1.5-point permanent hit to output.
- Non-U.S. export diversification, aided by a resolved Canada-China trade dispute, has pushed non-U.S. export share to a four-decade high.
- Cross-border polling shows strong majority support for renewed cooperation on both sides, suggesting political space for a deal despite the stalled timeline.
- The Bank of Canada is expected to hold rates at 2.25%, diverging from a more inflation-constrained U.S. Federal Reserve.
Sources: The Hub, Global News/Deloitte, Statistics Canada, Global Affairs Canada, State of Trade 2026, Business Council of Canada, Newswire.ca/Signal49 Research, Canada.ca, Wikipedia/Canada–China trade war
Discover more from The Economy
Subscribe to get the latest posts sent to your email.
Analysis
Singapore’s Growth Beat Hides a Harder Question: Can MAS Keep Tightening Into a War-Driven Inflation Shock?
Singapore’s economy grew 5.7% year-on-year in Q2 2026, beating consensus forecasts of 5.5% but decelerating from Q1’s revised 6.3% pace. Manufacturing, powered by an AI-related semiconductor “supercycle,” was the standout driver. The deceleration, however, arrives just as the Monetary Authority of Singapore prepares a policy decision complicated by rising inflation risk tied to the Iran conflict.
The Headline Numbers
Singapore’s Ministry of Trade and Industry reported advance Q2 2026 GDP growth of 5.7% year-on-year, ahead of the 5.5% Reuters consensus but down from a revised 6.3% in Q1 (IBTimes Singapore). On a quarter-on-quarter seasonally adjusted basis, GDP rose 1.1%, following 1.3% growth in Q1. Manufacturing expanded 12.2% year-on-year, up sharply from 8.0% in the prior quarter and the clearest evidence yet of how central Singapore has become to the global AI hardware supply chain (CNBC).
Forecasters have responded by upgrading their outlooks. UOB Global Economics and Markets Research raised its full-year 2026 GDP forecast to 4.8% from 4%, citing sustained AI-related demand, while Nomura pointed to a broadening “semiconductor super cycle” as a key driver of upside risk to its own 4.6% forecast (Xinhua).
The MAS Dilemma
Singapore does not set monetary policy through interest rates but by managing the Singapore dollar’s trading band against a basket of currencies — the S$NEER framework. In April 2026, MAS raised the rate of appreciation of that band, tightening policy in response to inflation risk tied to the Iran conflict, and simultaneously raised its 2026 inflation forecast range to 1.5–2.5%, up from 1.0–2.0% (IBTimes Singapore).
The central bank’s next policy review, due before the end of July, arrives at an awkward moment: growth is decelerating from its Q1 peak even as inflation risk from the Gulf conflict remains elevated. CPI inflation held at 1.8% in May 2026, its joint-highest reading since September 2024 (CNBC).
A Region Serving as Shipping’s Overflow Valve
One underreported dimension of Singapore’s exposure to the Hormuz conflict: the city-state has seen increased vessel traffic as ships reroute around Africa or use Singapore as a stopover hub for displaced shipping, according to the Monetary Authority of Singapore’s own macroeconomic review (MAS Macroeconomic Review, April 2026). This gives Singapore a curious dual exposure to the conflict: it benefits from increased logistics and trans-shipment activity even as it absorbs higher energy import costs.
Growth Forecast Range Holds — For Now
The Ministry of Trade and Industry has maintained its official 2026 growth forecast at 2.0–4.0%, explicitly citing elevated downside risk from the US-Israel-Iran conflict even as it acknowledges that actual growth has been tracking well above that range in the first half of the year (MTI). That gap between the official forecast band and independent economists’ more bullish revisions reflects genuine uncertainty about how durable the AI-driven manufacturing boom will prove if geopolitical risk intensifies again.
Why This Matters for Global AI Supply Chains
Singapore’s position at the center of the “semiconductor supercycle” narrative connects directly to the broader AI chip investment story unfolding in the US and China (see our companion coverage). As a hub for both electronics manufacturing and financial services, Singapore’s growth trajectory functions as a leading indicator for global AI hardware demand more broadly.
Key Takeaways
- Singapore’s Q2 2026 GDP grew 5.7% year-on-year, beating forecasts but decelerating from Q1, driven by a 12.2% surge in manufacturing output.
- MAS tightened monetary policy in April 2026 specifically in response to Iran-conflict-linked inflation risk, and faces a delicate policy call later this month.
- Singapore has a dual exposure to the Hormuz conflict — benefiting from rerouted shipping traffic while absorbing higher energy costs.
- Independent forecasters have raised 2026 growth estimates to as high as 4.8%, well above the MTI’s official 2.0–4.0% range.
Discover more from The Economy
Subscribe to get the latest posts sent to your email.
The Bank of Canada held its policy rate at 2.25% on July 15, extending a pause that began after its final cut in October 2025, while cutting its 2026 growth forecast to just 0.7% from an April projection of 1.2% — the largest single revision in the current cycle (Hashtag Investing; Bank of Canada).
Two Numbers in Tension
The downgrade sits oddly alongside a more encouraging recent trend: Statistics Canada estimates Q2 growth accelerated to roughly 2.5% annualized after a stalled first quarter, and the Bank explicitly frames the weak annual figure as reflecting front-loaded weakness rather than a deteriorating trajectory — it still projects 1.8% growth in both 2027 and 2028 (Hashtag Investing). Inflation, meanwhile, hit 3.2% in May — the highest since late 2023 — driven by the Middle East conflict’s energy shock and the Hormuz shutdown, before easing modestly as a mid-June ceasefire briefly took hold, only for hostilities to resume days later (BNN Bloomberg).
The Story Underneath: Adaptation, Not Resolution
Bloomberg’s Canada Daily newsletter captures the angle most outlets have missed: Bank of Canada Governor Tiff Macklem’s message across the quarterly forecast round was that Canadian businesses are no longer waiting for clarity on Donald Trump’s tariffs — they are adapting to them structurally (Bloomberg). Trade within North America remains largely tariff-free under the Canada-US-Mexico Agreement, though sector-specific measures continue to bite, and CUSMA itself is now subject to annual reviews rather than the longer-term certainty businesses had previously priced in (Bank of Canada Monetary Policy Report).
A Labour Market Stuck, Not Collapsing
Canada’s unemployment rate sat at 6.5% in June, hovering in a 6.5–7% range since late 2024 — soft but stable. RBC Economics notes housing markets in Toronto and Vancouver, which had significantly underperformed the rest of the country, have begun to firm, while export growth has resumed even if on a lower long-run path than before the tariff era began (RBC Economics).
The Mortgage Renewal Wave Nobody Is Pricing Correctly
An estimated 1.5 million Canadian households have already renewed mortgages at higher rates since the pandemic-era lows, with another million expected to do so over the coming year, according to CMHC estimates cited by Hashtag Investing. Holding the policy rate at 2.25% avoids an immediate additional shock for variable-rate borrowers, but does not reverse the payment increases already locked in for those exiting ultra-low pandemic terms — a slow-moving fiscal drag on household spending that receives far less coverage than the headline rate decision itself.
The Risk the Bank Is Actually Watching
The Bank of Canada identifies two dominant risks to its forecast: the durability of the Canada-US trade relationship, and the trajectory of the Middle East conflict. Oxford Economics’ Tony Stillo frames the latter as the more acute near-term threat, warning that a re-escalation could reproduce the exact inflation dynamic the Bank was managing in May, forcing it back into a reactive posture regardless of direction (BNN Bloomberg).
Discover more from The Economy
Subscribe to get the latest posts sent to your email.

Pakistan Gulf Investment Outflows 2026: Peace Deal Stakes Explained

Canada Trade Diversification 2026: China, Indonesia, UAE Deals Explained

US Forced-Labour Tariffs on 60 Countries: The Hidden Trade Shock of 2026

Global Central Banks 2026: Fed, BoE and BoJ Decisions Could Reshape Markets

Gulf Capital Retreat From Pakistan 2026: UAE Loan Freeze & What It Means

Pakistan’s Most Reliable Export Is Its People: Remittances Hit $41.6 Billion, Overtaking Total Exports

Indonesia’s Confidence Problem: Record Investment, a Sinking Rupiah, and a Widening Credibility Gap

Down But Not Out: Inside the Slow Sinking of Russia’s War Economy

China’s Growth Slips to a Four-Year Low: Why Beijing Still Won’t Pull the Stimulus Trigger

The Johor-Singapore Corridor: How Malaysia Became Southeast Asia’s AI Infrastructure Powerhouse

Canada’s Economy ‘On Pause’: Inside the CUSMA Deadline That Passed Without a Deal

Dubai’s Millionaire Magnet: How the UAE Turned Middle East Turmoil Into a Capital Safe-Haven Boom

Britain’s Sixth Prime Minister in a Decade: What Starmer’s Exit Means for Gilts, Sterling and Your Portfolio

Anthropic Offers Up to $600,000 Salary for Critical IPO Role as AI Giant Prepares for Wall Street Debut

Carry Trade Unwind 2026: How the Yen’s Snapback Triggered a Global Margin Call

AI Bubble Warning 2026: Why BIS, IMF and Bank of England Fear a Market Crash

BRICS De‑Dollarization Strategy Takes Shape with $15 Billion Local‑Currency Push

The AI Super Bubble Is Ready to Burst

Russia Bans Diesel Exports 2026: Global Fuel Market Impact Explained

Strait of Hormuz Blockade 2026: Oil Prices Surge 9% as US-Iran Conflict Reignites

Private Credit Warning: Most BDCs Turn Unprofitable in 2026, Reuters Finds

IMF Cuts Pakistan Growth Forecast, Raises Inflation to 8.4%

Bitcoin $150k Milestone Achieved as US Sovereign Crypto Pivot Looms
Gulf Capital Retreat From Pakistan 2026: UAE Loan Freeze & What It Means

India Economic Rise 2026: How the Subcontinent Toppled Japan

Strait of Hormuz 2026: Why Markets Still Don’t Trust It’s Open

Argentina Economy 2026: Milei’s Fiscal Surplus, Inflation Drop to 29%, and What Comes Next

China Housing Market Turnaround: White‑List Model Stabilises Prices
-

 Markets & Finance7 months ago
Top 15 Stocks for Investment in 2026 in PSX: Your Complete Guide to Pakistan’s Best Investment Opportunities
-

 Analysis5 months ago
Johor’s Investment Boom: The Hidden Costs Behind Malaysia’s Most Ambitious Economic Surge
-

 Analysis5 months ago
Top 10 Stocks for Investment in PSX for Quick Returns in 2026
-

 Analysis6 months ago
Brazil’s Rare Earth Race: US, EU, and China Compete for Critical Minerals as Tensions Rise
-

 Banks6 months ago
Best Investments in Pakistan 2026: Top 10 Low-Price Shares and Long-Term Picks for the PSX
-

 Investment7 months ago
Top 10 Mutual Fund Managers in Pakistan for Investment in 2026: A Comprehensive Guide for Optimal Returns
-

 Global Economy7 months ago
15 Most Lucrative Sectors for Investment in Pakistan: A 2025 Data-Driven Analysis
-

 Global Economy7 months ago
Pakistan’s Export Goldmine: 10 Game-Changing Markets Where Pakistani Businesses Are Winning Big in 2025