
Economic Costs of Wars
Russia Overspends on Putin’s War in Ukraine by $28bn

The War Economy Blows Its Own Budget
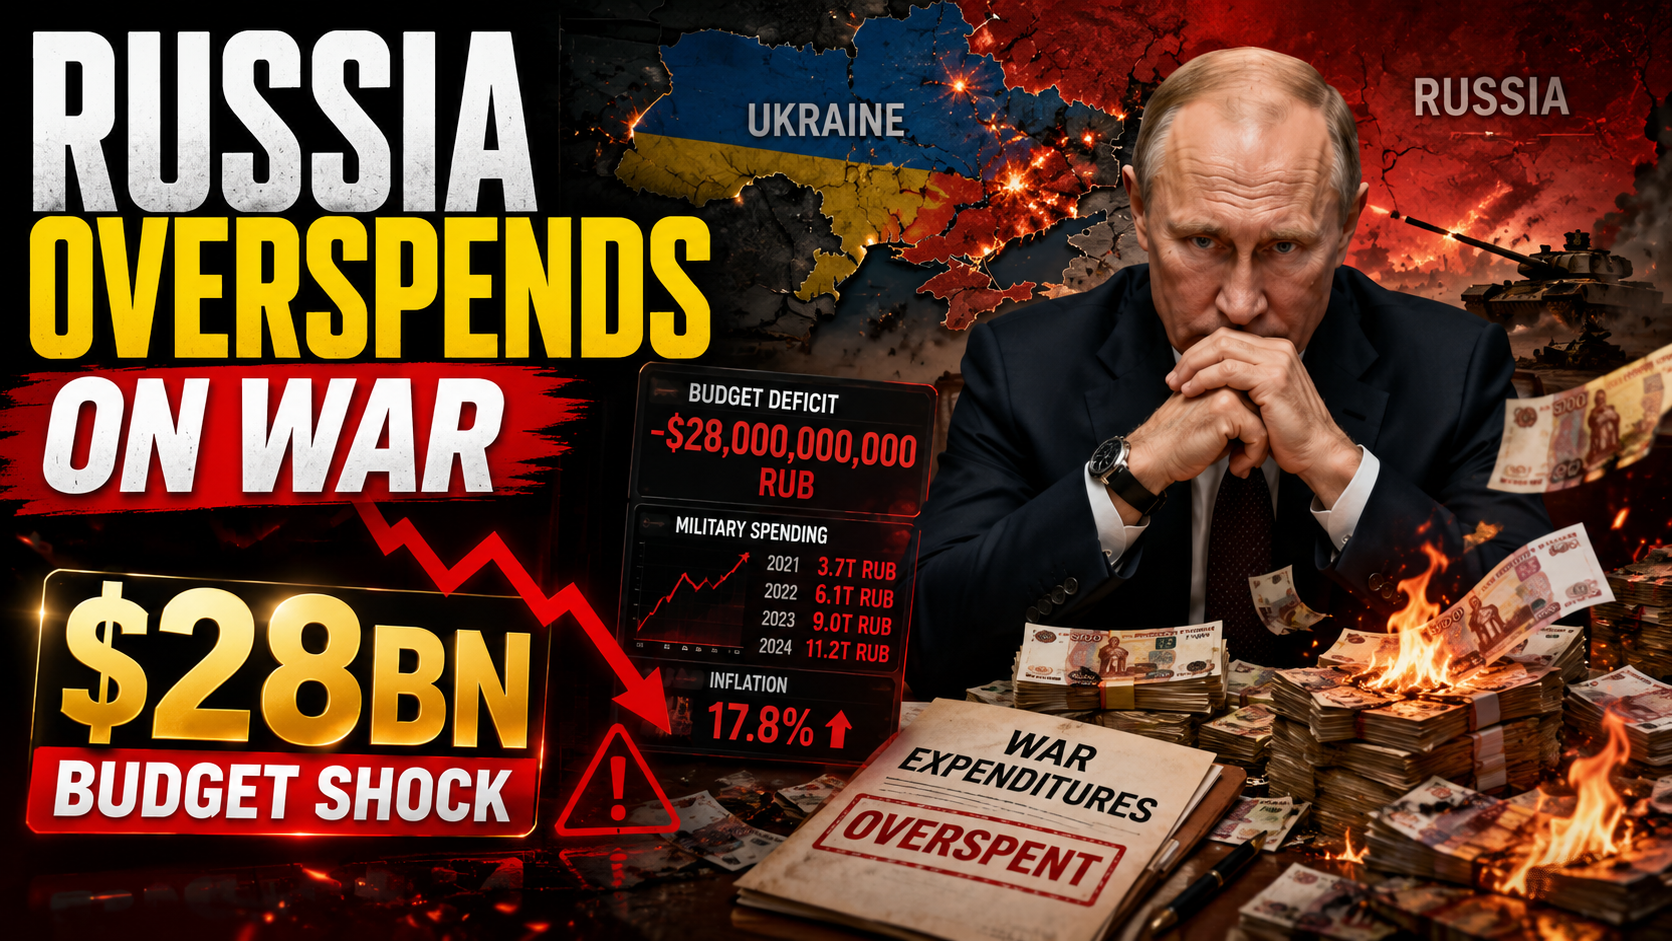
Russia entered 2025 with a plan. The Kremlin’s finance ministry had set a ceiling of 13.5 trillion rubles — roughly $162 billion at prevailing exchange rates — for national defence. That was already a record, already nearly a third of everything the state intended to spend. By year’s end, actual military expenditure had blown through that ceiling by the equivalent of $28 billion, finishing closer to $190 billion and consuming 7.5 percent of Russia’s entire GDP. That’s the highest share of economic output directed at war by any major power since the Soviet Union’s collapse. The numbers don’t just reveal the price of Vladimir Putin’s invasion of Ukraine. They describe a state that has lost control of its own fiscal arithmetic.
A Budget Built for a War Moscow Didn’t Plan to Last This Long
When Russia launched its full-scale invasion of Ukraine in February 2022, the Kremlin’s inner circle appeared to assume Kyiv would fall within days. The 2022 federal budget had been drafted without any visible preparation for prolonged conflict — military allocations that year tracked the long-established pre-war trend, reflecting an exercise in strategic deception as much as fiscal planning.
That confidence collapsed within a week. What followed was a four-year escalation in which each successive budget has broken the last year’s record.
Russia’s military spending grew by 5.9 percent in real terms in 2025, reaching $190 billion, according to the Stockholm International Peace Research Institute’s April 2026 annual survey — the most authoritative independent dataset on global defence expenditure. At 7.5 percent of GDP, this exceeds three times the global average of 2.5 percent. By comparison, the United States spent around 3.4 percent of GDP on defence in the same year.
The war’s cumulative toll on Russia’s treasury is staggering. From 2022 through 2025, total Russian war-related expenditures reached an estimated $522 billion in taxpayer funds — a sum that, according to analysts at United24, could have financed Russia’s entire higher education system for 24 years. Social spending, meanwhile, has fallen to just 25.1 percent of the federal budget, its lowest share in two decades.
The $28 Billion Overrun: What the Numbers Actually Mean
Russia’s military budget overrun is not a rounding error. It reflects a structural feature of wartime fiscal management: the gap between what Moscow publishes and what Moscow spends keeps widening with each passing quarter.
The mechanism is partly deliberate opacity. Roughly 84 percent of Russia’s defence-related spending sits in classified budget lines, a fact confirmed by SIPRI’s March 2026 analysis of the federal budget draft. Official “national defence” figures capture only the visible layer. The real number emerges from total federal expenditure, GDP estimates from Rosstat, and cross-referencing with the central bank’s monetary aggregates.
What those methods reveal is an economy that spent $2.7 billion per week on its war effort in 2025. According to year-end estimates, Russia’s military expenditures ran nearly 20 percent above initial plans for the year. The Center for Countering Disinformation in Kyiv, drawing on Russian Ministry of Defence disclosure and independent cross-checks, put total expected spending for the year at $198.8 billion — around $30 billion above the approved budget line.
The gap also reflects the brute economics of war inflation. Ammunition, drone components, soldier pay, and the mobilisation bonuses Moscow now offers to attract volunteers all carry price tags that budgeters set months in advance and actual combat burns through at a pace no spreadsheet predicted. Russia has been running the equivalent of a wartime procurement auction — and the prices keep rising.
In the first nine months of 2025 alone, Russia spent $146.4 billion from its federal budget on military needs. That is four times the level of 2021, accounting for 39 percent of total government outlays. The pre-war average, spanning 2019 to 2021, was roughly 15 percent.
Why Can’t Moscow Simply Stop?
This is the question that defines the strategic landscape — and the answer is more economically constrained than it might appear.
What does Russia’s war overspending mean for its domestic economy? In short: sustained overheating, rising debt servicing costs, and a structural squeeze that is redirecting resources away from civilian consumption faster than official commentary acknowledges. The Russian economy is not collapsing. But it’s running a temperature that no central banker can easily bring down.
In October 2024, the Bank of Russia raised its key policy rate to 21 percent in an attempt to choke inflation. The rate has since been reduced in stages to 17 percent, but borrowing costs remain prohibitive for businesses and consumers. The IMF forecast Russian GDP growth at just 0.6 percent in 2025 and 1.0 percent in 2026 — barely above stagnation. The Economic Forecasting Institute of the Russian Academy of Sciences was only marginally more optimistic.
Finance Minister Anton Siluanov has acknowledged the bind: revised GDP growth forecasts have been marked down repeatedly, credit demand has weakened under the weight of high interest rates, and oil and gas revenues — the Kremlin’s traditional fiscal shock absorber — fell 19.4 percent in ruble terms in the 12 months through November 2025. The National Welfare Fund, the sovereign savings buffer that Moscow spent years building as a hedge against oil price volatility, has been drawn down by 59 percent since the invasion began.
What follows, however, is the structural paradox that makes the spending unlikely to stop: the war economy has become self-sustaining in the worst possible way. Military production and military pay are now significant drivers of household income and regional employment in parts of Russia. Unwinding them would cause exactly the kind of visible economic pain that the Kremlin most fears — not invisible fiscal deterioration, but localised unemployment and wage deflation in communities that have organised around war contracts.
The Downstream Consequences: Markets, Sanctions, and Europe’s Calculation
The fiscal picture matters well beyond Moscow’s budget office. Russia’s defence spending trajectory carries second-order effects that are already reshaping decisions in European capitals, in bond markets, and in the corridors of international financial institutions.
For Western policymakers, the $28 billion overrun is simultaneously evidence of strain and evidence of resilience. Russia has overspent its plans — but it has, so far, found ways to fund the excess. The National Welfare Fund provided cash in earlier years. Now the vehicle is domestic debt. Yields on 10-year Russian state bonds (OFZ) have exceeded 15 percent, making meaningful borrowing from capital markets nearly impossible — the net debt raised in recent quarters barely exceeded $4 billion, or 0.16 percent of GDP. Yet the government continues to spend. The implication is a growing reliance on monetary financing — a path that historically ends in accelerating inflation, not managed fiscal consolidation.
For European NATO members, Russia’s spending trajectory has been a forcing function. Europe’s combined defence budgets surpassed Russia’s in 2025 only when measured at market exchange rates — $457 billion versus $462 billion when Russia’s spending is converted at purchasing power parity, according to IISS data cited by the Financial Times. Germany’s defence budget climbed 23 percent last year to $86 billion. The logic is clear: Russia has demonstrated a willingness to dedicate a share of economic output to its military that no European democracy has matched outside wartime.
For sanctions architects in Washington and Brussels, the overrun raises an uncomfortable question. Russia’s export earnings from goods sales ran at approximately $413 billion in 2025 — slightly below 2024’s $434 billion, but not dramatically so. The oil price cap and sanctions regime have trimmed revenues at the margins without yet reaching the structural chokepoint that would force Moscow to choose between guns and basic government functions.
That chokepoint may still come. Independent analysts estimate that tighter sanctions enforcement could reduce Russia’s oil revenues to as low as $46 billion in 2026, down from $155 billion in 2025 — a shock of that magnitude would render the current spending trajectory genuinely unsustainable. But that scenario requires political will in sanctioning capitals that has, so far, remained incomplete.
The Counterargument: Russia Has Surprised Before
It’s worth pausing before declaring the trajectory unsustainable.
Russia’s wartime fiscal position has been described as untenable by credible analysts at multiple points since February 2022 — and each time, Moscow has found a path forward. Energy revenues proved more durable than predicted. Inflation, though elevated, has not spiralled into the kind of hyperinflationary collapse that some early models forecast. The domestic banking system, dominated by state-owned institutions, has absorbed shocks through mechanisms that don’t translate neatly to Western financial frameworks.
SIPRI’s March 2026 analysis explicitly notes that higher oil prices resulting from the Iran war launched by Israel and the United States in early 2026 are likely to ease Russia’s budget position — potentially significantly. A $20 per barrel increase in Urals crude translates to tens of billions in additional revenue, which reshapes the deficit arithmetic in Moscow’s favour almost immediately.
There’s also the question of what “unsustainable” means politically. The Atlantic Council’s analysis of Russia’s wartime economy noted in December 2025 that Moscow does not appear willing to direct the share of resources toward defence that the Soviet Union did during the Cold War — suggesting the Kremlin is deliberately managing below its theoretical maximum, preserving political cushion. That judgement has since been complicated by the 2026 budget, which for the first time since the invasion nominally reduced national defence allocations to 14.9 trillion rubles, even as analysts universally expect the budget to be amended upward as the year progresses.
The picture is more complicated, in other words, than either “Russia is running out of money” or “Russia can absorb anything.” The truth lives in the narrow, uncomfortable band between those two claims.
The Reckoning Moscow Can’t Defer Forever
The $28 billion overrun is not the story’s headline. It’s the symptom. The story is that Russia has been conducting a war whose costs it systematically underestimated — in lives, in rubles, and in the slow erosion of the economic architecture it built during the 2000s oil windfall.
Putin signed the 2026 federal budget in December 2025, allocating nearly 40 percent of all expenditures to the military and security sector. The 2026 defence figure is nominally lower than 2025’s. Analysts don’t believe it will stay that way. They’ve been right before.
What’s changing — slowly, unevenly, but unmistakably — is the quality of the trade-offs Moscow is making. Debt servicing costs that ran at 0.9 percent of GDP before the war are heading toward 2 percent. Tax rates on corporations and individuals have been raised twice in recent years to plug gaps that oil revenues once papered over. Social spending is at a 20-year low. The National Welfare Fund is 59 percent depleted.
Russia can, as its officials insist, keep fighting. The more precise question — the one that neither the Kremlin’s propagandists nor the West’s most optimistic analysts have answered convincingly — is at what cumulative cost to the economic foundations that make sustained power projection possible in the first place.
Every $28 billion overrun brings that reckoning one budget cycle closer.
Discover more from The Economy
Subscribe to get the latest posts sent to your email.


Analysis
Rerun or Sequel? Naomi Klein, Astra Taylor, and the High-Tech Economics of ‘End Times Fascism’
Across boardrooms, political rallies, and the gated enclaves of Silicon Valley, a powerful narrative is taking hold: ecological collapse, social breakdown, and systemic instability are inevitable. But while the average citizen views this as a crisis to be solved, a new class of ultra-wealthy elites views it as an arbitrage opportunity.
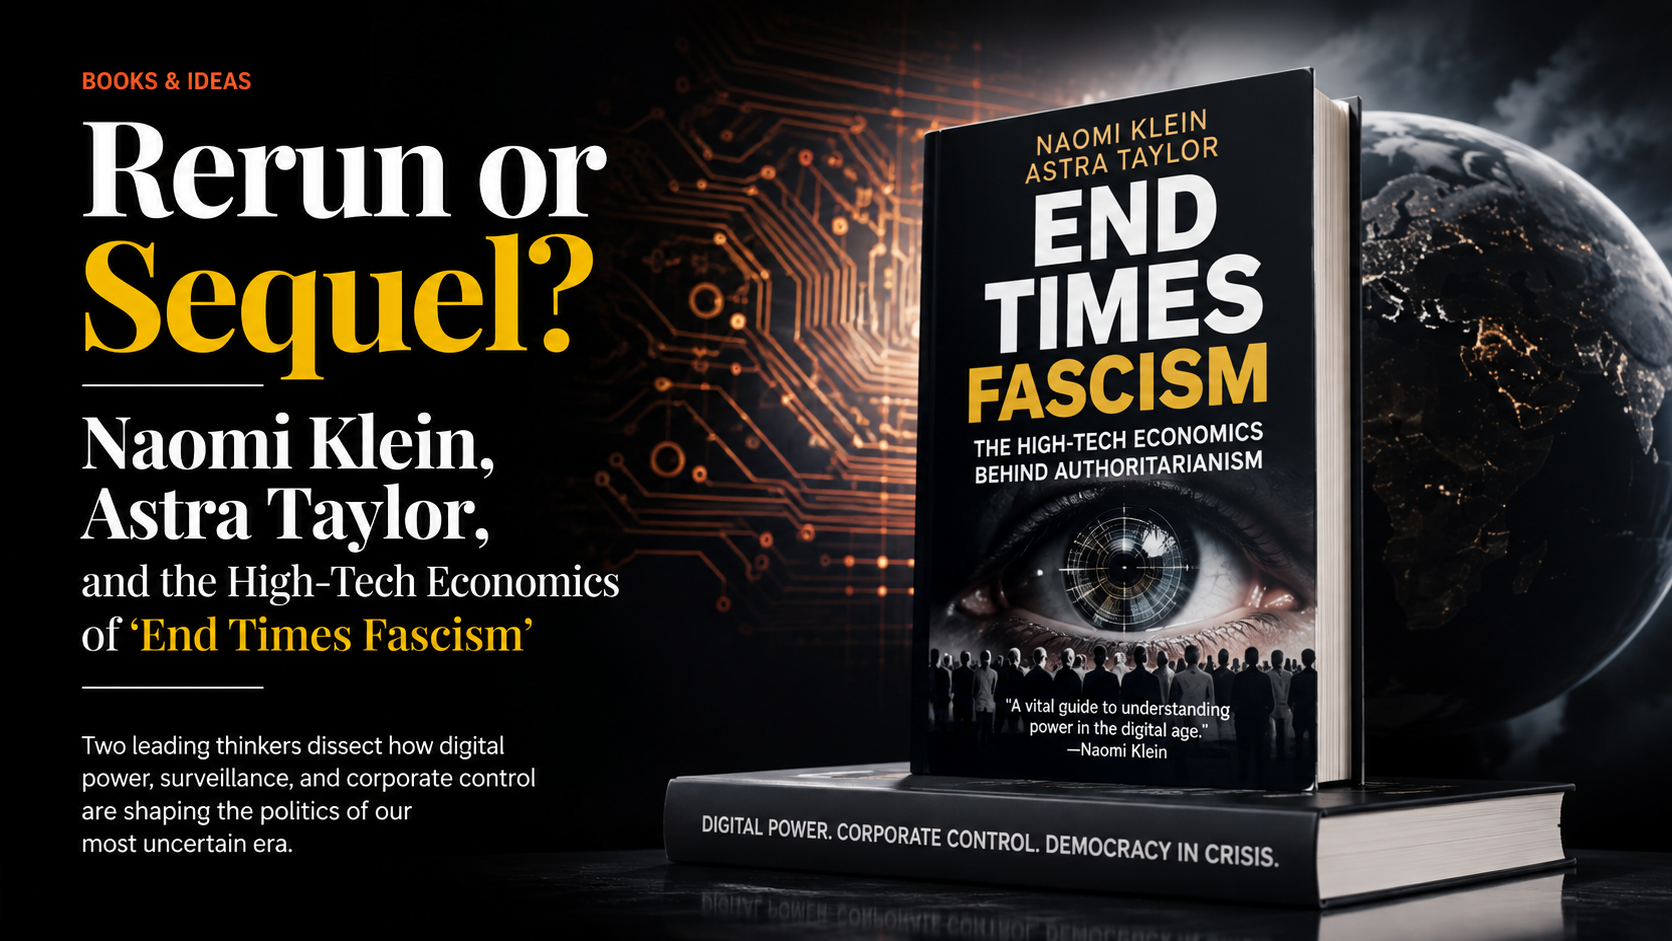
In their searing 2026 book, End Times Fascism and the Fight for the Living World, celebrated authors Naomi Klein and Astra Taylor diagnose a dangerous mutation in global politics. They argue that we are witnessing the rise of an “apocalyptic alliance”—a coalition of religious fundamentalists, ethno-nationalists, and Silicon Valley tech kings. United by the belief that a cleansing cataclysm is approaching, these groups are not trying to prevent the collapse of the biosphere or the social safety net. Instead, they are actively accelerating it, convinced they will be among the saved on the other side.
For investors, policymakers, and technologists, the central question is whether this political shift is simply a “rerun” of 20th-century authoritarianism or a terrifyingly high-tech “sequel.” Understanding the economics behind this movement—from AI deregulation to crypto cities—is crucial for navigating the next decade of geopolitical and financial instability.
The Rerun: Echoes of 20th-Century Disaster Capitalism
At first glance, the mechanics of modern authoritarianism look like a rerun of the 1930s. The political playbook still relies heavily on what Klein previously coined as the “shock doctrine”—the systematic exploitation of crises to consolidate wealth and power.
Whether triggered by a pandemic, soaring inflation, or extreme weather events, public disorientation is consistently used to justify aggressive wealth extraction. In this traditional model of disaster capitalism, the objective is simple: defund the public sector, slash corporate taxes, and channel government subsidies into private equity.
- Market Deregulation: We see the classic hallmarks of 20th-century fascism in the aggressive dismantling of environmental protections and labor rights, designed to maximize short-term corporate profits.
- Scapegoating and Division: The economic anxiety of the working class is redirected toward marginalized groups, a distraction tactic that allows the ultra-wealthy to avoid scrutiny for widening wealth gaps.
- The Merging of State and Corporate Power: Oligarchs increasingly treat the state not as a regulator, but as an enforcement arm for private monopolies.
Yet, to call this movement a mere rerun is to underestimate its technological sophistication. The 20th-century fascist required the state to build a war machine. The 21st-century tech baron wants to render the state obsolete entirely.
The Sequel: AI, Algorithms, and the Silicon Valley Secession
This is where Klein and Taylor’s thesis pivots from a historical critique into a futurist warning. Today’s End Times Fascism is a high-tech sequel driven by algorithms, artificial intelligence, and the Silicon Valley secession movement.
The tech elite are no longer satisfied with lobbying for lower taxes; they are actively seeking to secede from democratic oversight. This is manifesting through the push for “freedom cities,” crypto-fiefdoms, and “seasteading” (building autonomous communities in international waters). These spaces are envisioned as hyper-capitalist havens—gated communities free from democracy, taxes, and regulation, governed entirely by corporate terms of service.
- Regulatory Arbitrage via Crypto: By migrating wealth into decentralized finance (DeFi) and crypto-states, billionaires are insulating their capital from federal taxation and municipal law.
- AI Deregulation: The acceleration of unchecked artificial intelligence serves a dual purpose. First, it acts as a massive wealth-generating engine that replaces human labor. Second, it provides the surveillance and security infrastructure necessary to police these private enclaves without relying on public law enforcement.
- Data Privacy Laws as a Battlefield: As tech monopolies consolidate power, the fight over data privacy becomes a fight for civil liberties. The apocalyptic alliance relies on sweeping data extraction to train AI models that predict, manipulate, and ultimately control public behavior.
This is not the fascism of mass mobilization; it is the fascism of extreme isolation. It is a future where the elite are serviced by AI robots, financed by cryptocurrencies, and protected by private mercenaries.
The Billionaire Bunker Economy: Profiting from the Apocalypse
If the elite believe the end is near, they are investing accordingly. We are currently witnessing the boom of a billionaire bunker real estate market, a hyper-lucrative sector that caters to what Klein and Taylor call “supremacist survivalism”.
This is the ultimate expression of disaster capitalism investing. The most powerful people in the world are preparing for an end they are simultaneously accelerating through carbon emissions and algorithmic polarization.
- High-Net-Worth Real Estate: Developers are transforming abandoned missile silos in Kansas and vast tracts of land in New Zealand into fortified luxury compounds. These properties boast autonomous power grids, hydroponic food systems, and private medical facilities.
- Resource Hoarding: The bunker economy extends beyond real estate into the aggressive monopolization of arable land, fresh water aquifers, and critical minerals required for green energy grids.
- Exclusionary Security: The ideology underlying this economy is inherently violent. These fortressed escape pods are designed to lock out the masses displaced by climate change and economic collapse. It is a belief system that accepts mass casualties as a necessary byproduct of elite survival.
For wealth management firms and private equity, the “apocalypse” has become an asset class. But as Klein and Taylor reveal, these new survivalists are far from impregnable. Their fortresses are entirely dependent on the very supply chains and working-class labor they claim to be independent from.
Breaking the Doom Loop: The Economics of Resistance
End Times Fascism is not a book of despair; it is a blueprint for resistance. If the ultra-wealthy are betting against the future of the planet, the counter-movement must be rooted in what the authors call a “pro-life” politics—one that actually defends the living world.
Fighting this apocalyptic alliance requires shifting capital away from extraction and isolation, and toward collective resilience. The economics of resistance present massive opportunities for forward-thinking investors and communities:
- Sustainable ESG Investing: Despite political backlash from the far-right, genuine Environmental, Social, and Governance (ESG) frameworks remain the most viable tool for directing institutional capital toward climate mitigation rather than climate escape.
- Green Tech & Community-Owned Power: Breaking the monopoly of tech billionaires requires decentralizing power—literally. Investments in community-owned renewable energy grids make local populations resilient to both climate shocks and corporate extortion.
- Reclaiming the Commons: The fight for stringent AI regulation, robust data privacy laws, and anti-trust enforcement is the modern equivalent of the labor movements of the 1930s. It is the necessary friction to stop the Silicon Valley secession.
The fatalism of the tech-bros and the religious fundamentalists is a choice, not an inevitability. The vast majority of humanity does not want to live in a bunker or a managed crypto-fiefdom. They want a livable planet. By exposing the nihilism at the core of the billionaire survivalist fantasy, Klein and Taylor provide the clarity needed to break the doom loop. The future will not be decided by who builds the thickest walls, but by who has the vision to build a world where walls aren’t necessary.
FAQ: Understanding the ‘End Times’ Political Shift
What is “End Times Fascism” according to Naomi Klein?
“End Times Fascism” is a term coined by Naomi Klein and Astra Taylor to describe a modern political alliance of tech billionaires, ethno-nationalists, and religious fundamentalists. Rather than trying to prevent planetary crises like climate change, this group embraces catastrophe, believing they will safely survive the collapse in fortified luxury while the rest of humanity suffers.
How does AI intersect with modern authoritarianism?
In the modern “sequel” to authoritarianism, AI acts as an accelerator for wealth consolidation and surveillance. Tech oligarchs push for AI deregulation to maximize profits and replace human labor, while simultaneously using advanced algorithms to police private enclaves and manipulate democratic discourse without relying on traditional state mechanisms.
What are “freedom cities” and crypto-states?
“Freedom cities” and crypto-states (including concepts like “seasteading”) are privately owned, hyper-capitalist communities proposed by Silicon Valley elites. They are designed to operate outside of government jurisdiction, allowing the ultra-wealthy to avoid federal taxes, bypass democratic regulations, and govern entirely through corporate terms of service and cryptocurrency.
How can individuals resist disaster capitalism?
Individuals can resist disaster capitalism by engaging in collective, “pro-life” politics that defend the living world. Economically, this means supporting sustainable ESG finance, advocating for stringent AI and data privacy regulations, and investing in decentralized, community-owned infrastructure like local renewable energy grids to reduce reliance on tech monopolies.
Discover more from The Economy
Subscribe to get the latest posts sent to your email.
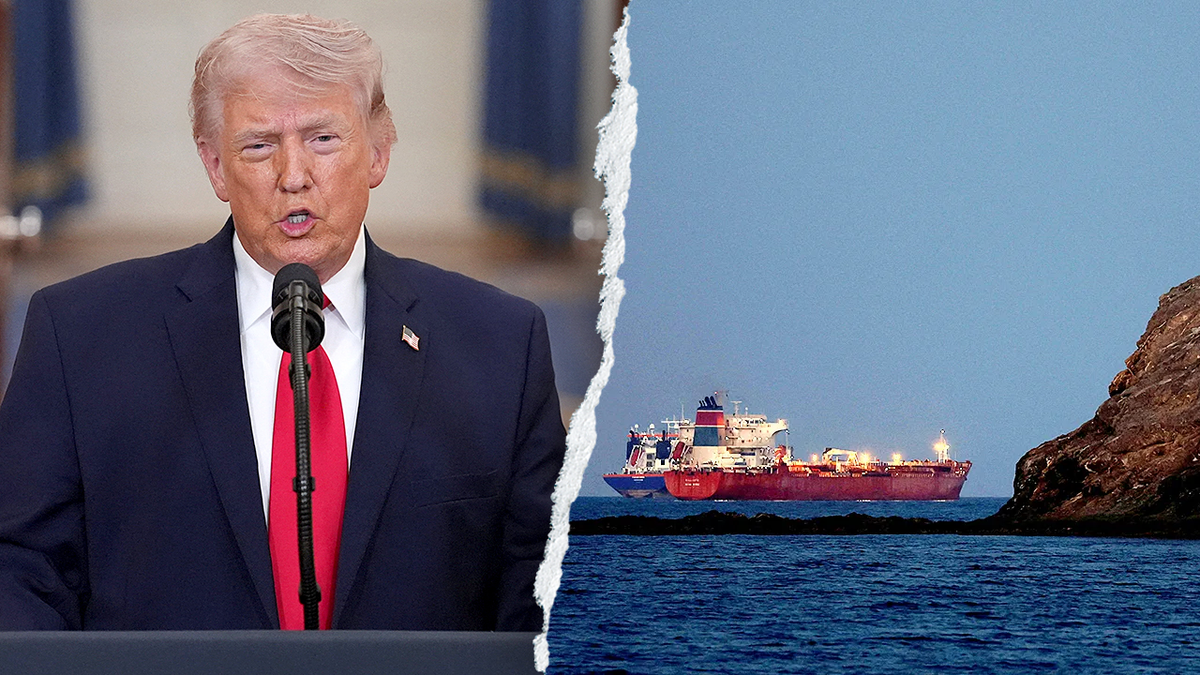
Oil markets spent Tuesday whipsawing between a one-month high and a partial retreat after President Donald Trump first threatened a 20% “reimbursement fee” on all cargo transiting the Strait of Hormuz, then abandoned the levy hours later in favour of bilateral investment pledges from Gulf states. Brent crude settled near $84–85 a barrel, roughly a third below April’s war peak but well above the pre-conflict baseline, as the US Navy reimposed a blockade on Iranian ports and Tehran’s Revolutionary Guard struck tankers with their transponders switched off (CNBC; Washington Post).
What most coverage has missed is that the toll episode, however short-lived, has functioned as a live stress test of exactly how exposed nine very different economies are to a chokepoint that carries roughly a fifth of the world’s oil and gas in peacetime. Vessel traffic through Hormuz collapsed from 37 ships a week earlier to just 14 on the Sunday before Trump’s announcement, according to Kpler tracking data, and the International Energy Agency’s hoped-for return to surplus by year-end now looks conditional on a durable ceasefire that has already broken down twice (CNBC; Al Jazeera).
The Toll That Never Was — But the Precedent That Might Be
The International Maritime Organization rejected the fee outright, calling mandatory transit tolls illegal under international law, while the US Treasury simultaneously warned that any shipper paying Iran for safe passage would be exposed to sanctions (NBC News). Shipping executives, including Chevron’s leadership, warned that a US-imposed toll would set a precedent allowing any country bordering an international strait — the Malacca Strait among them — to demand transit payments, a risk with direct relevance to Malaysia and Singapore’s shipping-dependent economies.
Asia’s Buffer Is Thinner Than Last Time
The South China Morning Post’s Hong Kong desk notes that Asian economies are “better placed to absorb the blow” than during April’s peak, but the buffer has eroded. Analysts at Sparta Commodities in Singapore flagged that strategic reserves drawn down during the earlier phase of the conflict leave less room to smooth a renewed shock (SCMP). For Singapore, whose Q2 growth already decelerated to 5.7% from a stronger prior quarter as AI-driven electronics exports failed to fully offset Middle East uncertainty, the mathematics are unforgiving (Free Malaysia Today).
Pakistan’s Remittance Channel Is the Overlooked Transmission Line
Pakistan receives roughly 9% of GDP in annual remittances, with 55% originating from the Gulf Cooperation Council states, according to the IMF’s most recent country report. A sustained disruption to GCC economies, or a return migration of workers amid regional instability, would strike directly at one of Pakistan’s most important financing sources for consumption and the balance of payments — a risk the Fund flags explicitly alongside compressed capital inflows from GCC banks, Pakistan’s largest source of short-term commercial financing (IMF Country Report 26/101). Islamabad’s current account is projected to worsen by 0.2 percentage points of GDP in FY26 and 0.4 points in FY27 under the Fund’s baseline, with the adverse scenario nearly doubling that hit.
The UK’s Energy Bill Arrives Months Late
British households and industry are only now absorbing the inflationary tail of the spring shock. The Bank of England’s Andrew Bailey has warned that higher energy costs already “in the pipeline” will keep headline inflation elevated into the fourth quarter even as spot oil prices ease, while the House of Commons Library estimates the indirect pass-through could add roughly a third of a percentage point to UK CPI through supply chains alone (UK Finance; Commons Library).
Why This Matters Beyond the Headline Number
The pattern across markets is consistent: the direct oil-price shock is only the first-order effect. The second-order effects — remittance flows, strategic reserve depletion, freight and insurance premiums, and the precedent risk to other global chokepoints — are where the durable economic damage is likely to concentrate, and where most competitor coverage has stopped short.
Discover more from The Economy
Subscribe to get the latest posts sent to your email.
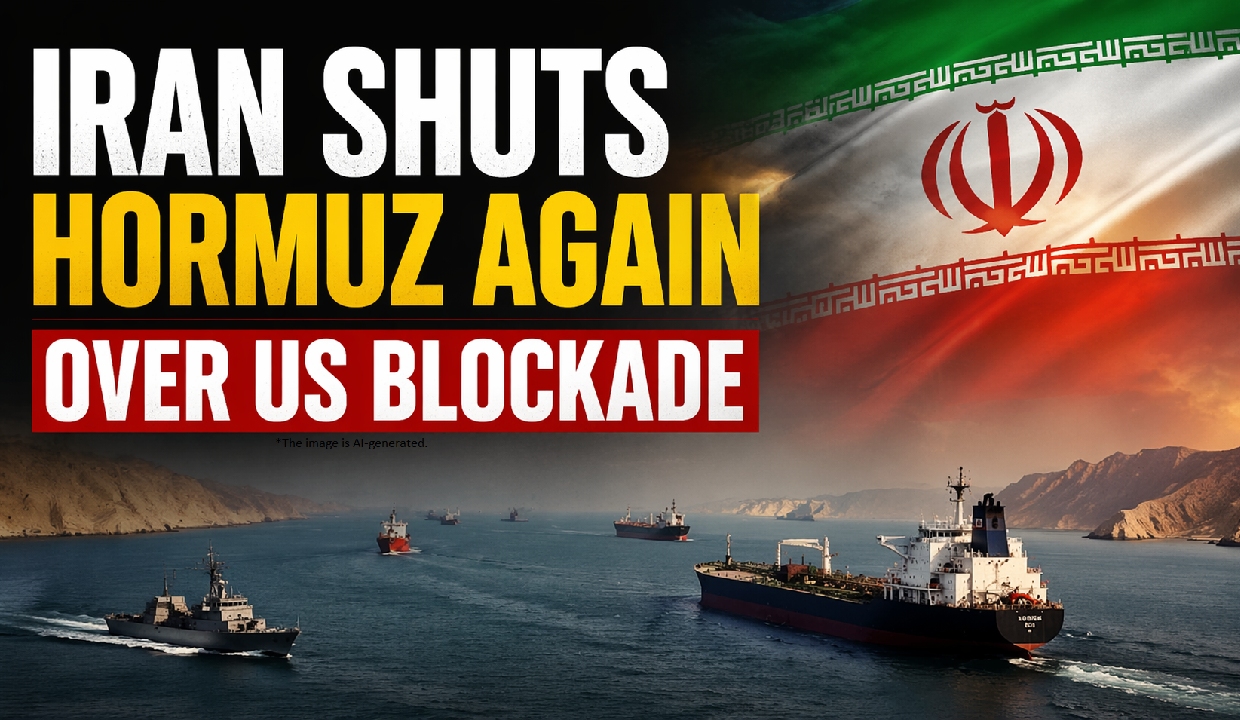
Brent crude posted its steepest one-day gain since May 2020 on July 13, 2026, after President Donald Trump announced the United States would reimpose a naval blockade on Iranian shipping through the Strait of Hormuz and impose a 20% toll on cargo transiting the waterway, shattering the fragile ceasefire that had held since June and reopening one of the biggest tail risks facing the global economy in 2026.
What Happened: The Blockade Announcement
Trump said on Truth Social that the U.S. would restore what he called the “Iranian Blockade,” stopping only Iranian vessels and their customers from entering or leaving Gulf waters, while declaring the Strait itself would remain open to all other nations. The blockade took effect at 4 p.m. ET on July 14, 2026, with U.S. Central Command authorized to intercept, board, and seize any vessel calling at Iranian ports without American clearance, according to The Street. The move followed a weekend in which U.S. forces struck more than 80 targets inside Iran and Iran’s Revolutionary Guard Corps responded by attempting to close the strait to shipping.
Brent futures jumped roughly 9.5% to trade above $83 a barrel, while U.S. benchmark WTI topped $78, levels not seen in weeks, based on data reported by Yahoo Finance. CNBC confirmed Brent’s 9.6% surge to $83.30 marked its best daily performance since May 2020, even as U.S. Central Command disputed Iranian claims that the strait had actually been closed, insisting traffic continued flowing to vessels “seeking to lawfully transit,” per CNBC.
Why the Strait of Hormuz Matters to the Global Economy
The Strait of Hormuz carries close to a fifth of global oil and gas shipments, making it the single most consequential chokepoint in energy markets. The International Maritime Organization pushed back on the legality of a mandatory transit toll, telling CNBC there is no legal basis for charging fees simply to pass through a strait recognized under international navigation law, a dispute reported by Motley Fool. Vessel traffic through the strait has already thinned dramatically, with maritime trackers noting only a handful of ships completing the transit in recent 12-hour windows.
Market Fallout: Equities, Chips, and Currency Moves
U.S. equities sold off on the news. The S&P 500 fell 0.79% to 7,515.34, the Nasdaq Composite dropped 1.55% to 25,873.18, and the Dow Jones Industrial Average slipped 138 points, according to CNBC’s markets desk. Asian chip stocks were caught in the crossfire as well, with South Korean semiconductor shares tumbling on renewed Middle East risk. Oil-importing economies across Asia — including Pakistan, Indonesia, and Singapore — face immediate pass-through pressure on fuel subsidies, current account balances, and inflation targets, compounding challenges already flagged by the IMF for the region.
What Comes Next for Oil Markets and Investors
Analysts caution that with global oil inventories already drawn down after five months of intermittent conflict, any sustained disruption to Hormuz traffic could push prices meaningfully higher than the July 13 spike. China’s refiners have reportedly stepped up crude imports even amid the volatility, signaling Beijing sees a buying opportunity rather than a reason to retreat, a dynamic also noted by Yahoo Finance. For markets in the UK, Canada, and the Gulf, the renewed blockade revives the stagflation debate central banks had hoped was fading, with the Bank of England, the Federal Reserve, and Gulf monetary authorities all now forced to reassess inflation trajectories against a second energy shock in the same calendar year.
For investors, the central question is whether this is a short-lived spike similar to prior flare-ups in the conflict, or the start of a structurally higher oil price regime that reshapes global growth, inflation, and monetary policy for the remainder of 2026.
Discover more from The Economy
Subscribe to get the latest posts sent to your email.

Macroeconomic Fallout of Middle Eastern Airspace Restrictions: Why U.S. Carriers Are Abandoning Gulf Hubs Through 2027

High-CPM Finance Niches 2026: Publisher Monetization Blueprint

IMF & World Bank 2026 Global Economic Outlook: Growth, Inflation, Debt

Pork Recall 2026: USDA Guanciale Listeria Recall in 8 States Explained

Zelda: Ocarina of Time Switch 2 Remake — Release Date & Everything Confirmed

Social Security Trust Fund 2032: OASI Depletion Timeline Explained

Oracle (ORCL) Stock Analysis: AI Cloud Growth Ahead of Sept 10 Earnings

2027 Social Security COLA: 3.5% Increase Explained

Non-State Actors and AI 2026: The Push for Global Guardrails

Mandatory Lobbying Registers 2026: Corporate Risk Guide

Beyond $100 Oil: Why the Geopolitical Shock at Hormuz Marks a Structural Turning Point

Digitally Deliverable Services: 56% of Global Trade in 2026

AI Data Center Real Estate 2026: Power & Grid Battle Guide

Smart Glasses Privacy Crisis 2026: Regulation & Compliance

State Farm’s $5B Dividend 2026: Who Qualifies & Payout Dates

US-China Relations in Q3 2026: Trade Tariffs and Supply Chain Risks

Gold’s Wild 2026: From a Record $5,600 Peak to a 24% Crash and Back Toward $4,500

Oil Surges as Strait of Hormuz Traffic Collapses Again

The Rocket That Won’t Quit: Inside SpaceX’s Falcon 9 Launch Machine

Bank of England Set to Hold Rates Through Year-End, Reuters Poll Shows

The 2026 Crypto Regulatory Shift: What It Means for Institutional Investors

SpaceX Starship Flight 14: First Orbital Attempt & Starlink V3 Launch Explained

Retail Earnings Week: What Home Depot, Target & Walmart Reveal

AI-Powered Training: The Next Multi-Billion Dollar Ecosystem in Fitness

AI Chip Stocks 2026: The Best Semiconductor Investments Beyond Marvell

Russia’s Black Sea Oil Exports Fall for a Fifth Straight Week

China’s Economy Has a Structural Problem: Factories Are Winning, Households Are Losing

Global Chip Selloff Deepens: What’s Driving the Aug. 19 Semiconductor Rout
-

 Markets & Finance8 months ago
Top 15 Stocks for Investment in 2026 in PSX: Your Complete Guide to Pakistan’s Best Investment Opportunities
-

 Analysis7 months ago
Johor’s Investment Boom: The Hidden Costs Behind Malaysia’s Most Ambitious Economic Surge
-

 Analysis7 months ago
Top 10 Stocks for Investment in PSX for Quick Returns in 2026
-

 Analysis7 months ago
Brazil’s Rare Earth Race: US, EU, and China Compete for Critical Minerals as Tensions Rise
-

 Banks8 months ago
Best Investments in Pakistan 2026: Top 10 Low-Price Shares and Long-Term Picks for the PSX
-

 Investment8 months ago
Top 10 Mutual Fund Managers in Pakistan for Investment in 2026: A Comprehensive Guide for Optimal Returns
-

 Global Economy9 months ago
15 Most Lucrative Sectors for Investment in Pakistan: A 2025 Data-Driven Analysis
-

 Global Economy9 months ago
Pakistan’s Export Goldmine: 10 Game-Changing Markets Where Pakistani Businesses Are Winning Big in 2025