
Analysis
US Inflation Hits 4.2% in May 2026 on Energy Shock

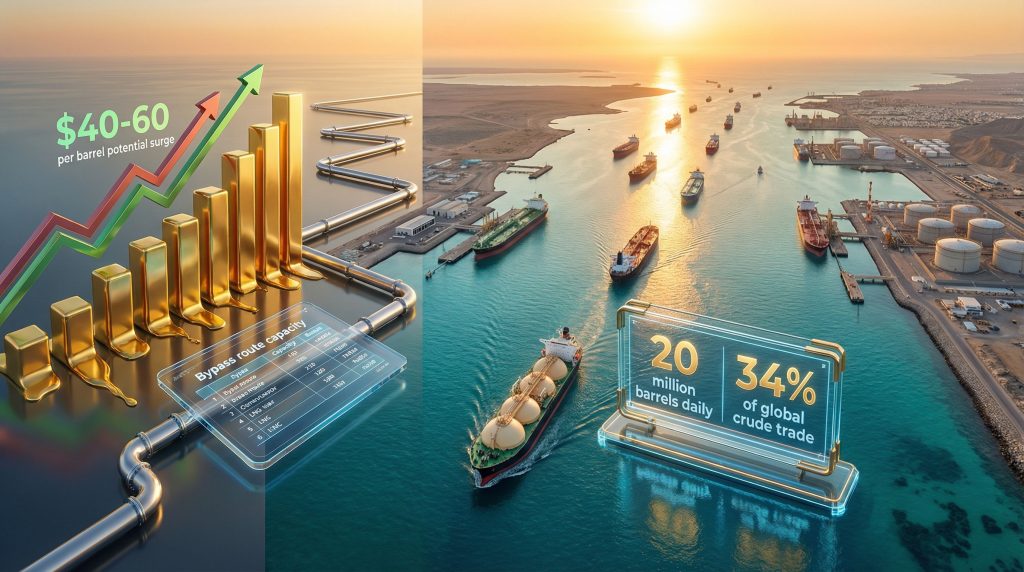
The numbers landed like a thunderclap across trading floors at 8:30 a.m. Eastern on June 10. Headline consumer prices in the United States had leapt 4.2% in the year through May, the Bureau of Labor Statistics reported, rocketing past every consensus forecast. The print — the highest since the inflationary inferno of 2022 — was powered by a 17.3% monthly surge in gasoline, itself the shockwave of a military blockade in the Strait of Hormuz that had throttled global crude flows for 37 days and counting. In Chicago, soybean futures halted limit-down. In Washington, the phones inside the Eccles Building began ringing before the data hit the wire.
The 4.2% figure ends a fragile, hard-won disinflation that had taken the consumer price index from 9.1% in June 2022 to 3.8% as recently as April 2026. For 22 months, the Federal Reserve had held the federal funds rate at 5.25%–5.50%, betting that restrictive policy could finish the job without cracking the labour market. May’s report — a 0.9% month-on-month jump in the headline index — suggests that bet has been overrun by events 6,200 nautical miles away. Core CPI, which strips out food and energy, rose 0.4% for the month and 3.7% year-on-year, a sobering reminder that underlying price pressures have not been vanquished. The energy shock is now bleeding into services, shelter, and transportation, the categories that determine whether inflation becomes embedded in the daily life of every American.
The catalyst is no mystery. On 3 May, Iran’s Revolutionary Guard Corps mined the western approaches of the Strait of Hormuz and deployed fast-attack craft after the collapse of the Vienna 3 nuclear talks. Within 48 hours, Brent crude had vaulted from $78 to $124 a barrel. The physical market seized up: 21 million barrels a day of crude and condensate transit the strait, and insurers declared most hulls uninsurable north of Fujairah. By the final week of May, the US national average retail price for regular gasoline touched $5.12 a gallon, [according to AAA](https://gasprices.aaa.com/), up $1.44 from the week before the blockade. Jet fuel and diesel rose even faster, compressing airline margins and adding a fresh layer of freight costs to an economy still scarred by the logistics snarls of 2021–22. The BLS energy index climbed 12.4% in May alone — the largest one-month increase since March 2022, when Russia’s invasion of Ukraine scrambled global hydrocarbons.
For motorist Carla Jefferson, filling the tank of her 2019 Honda CR-V at a Shell station on West Florissant Avenue in St. Louis, the arithmetic was brutal. “It was $91. I’ve never paid $91 for a tank of regular,” she said on the morning of the CPI release, studying the receipt as though it might contain a clerical error. “I manage a daycare. I can’t just not drive.” Her experience is the granular translation of an index number that, in Washington and New York, is traded and hedged and dissected in decimal points. For households earning under $60,000, energy and food together consume roughly 22% of post-tax income, more than double the share of the top quintile. When gasoline gallops, those households have no alternative: demand is inelastic, and the price is paid in forgone prescriptions, skipped credit-card payments, and cheap calories that often worsen health outcomes. The 4.2% headline is an average that conceals a regressive tax.
What caused the jump in US inflation to 4.2% in May 2026? The Strait of Hormuz disruption sent gasoline prices up 18.3% and overall energy costs up 12.4%, adding roughly 1.8 percentage points to headline CPI. Core services inflation stayed stubborn at 4.1%, driven by shelter, insurance, and medical care, confirming that even without the energy shock, price stability was not assured. The BLS release noted that shelter costs, the largest component of core CPI, rose 0.5% for the month and 5.2% year-on-year, propelled by a lagged pass-through of home prices and a multi-year insurance premium spiral in coastal states exposed to climate-linked disasters.
The bond market’s reaction was swift and brutal. The two-year Treasury yield, the most sensitive to Fed policy expectations, leapt 28 basis points to 4.89% within an hour of the release — the sharpest intraday move since March 2023, when regional banks were failing. The ten-year yield pierced 4.70% for the first time in 16 months, and the yield curve bear-steepened in a way that historically signals markets pricing a policy error. Fed funds futures, which as late as April implied two rate cuts in the second half of 2026, abruptly flipped to price a 62% probability of a quarter-point hike at the July meeting, according to CME FedWatch. Rate traders are now assigning a non-trivial chance — 14%, by one options-based model — that the terminal rate could breach 6% before year-end.
What follows, however, is not a straightforward replay of 2022. The American economy of June 2026 is more leveraged, more fiscally constrained, and more politically brittle than the one that absorbed the post-pandemic price surge. Federal debt held by the public has crossed $38 trillion, and net interest outlays are running at an annualised $1.4 trillion, exceeding the defence budget. Every additional 100 basis points of Fed tightening adds roughly $380 billion to annual interest costs within two years, a fiscal accelerator that the Congressional Budget Office has flagged as the single largest risk to long-term solvency. The political calendar compounds the arithmetic: midterm elections are five months away, and a Democratic president is defending a single-digit House majority. The White House released a statement at 9:12 a.m. pledging to “use every tool at our disposal,” including a new round of Strategic Petroleum Reserve releases, but the SPR holds just 19 days of net import cover after the drawdowns of 2022 and the replenishment delays of 2024–25. The powder is damp.
Fed Chair Jerome Powell, speaking at a European Central Bank forum in Sintra on 9 June, acknowledged the inflation spike as “a supply-driven shock that complicates the path to our 2% objective,” but his words were carefully hedged. “We will not overreact to a single print, however uncomfortable, when the source is clearly a geopolitical event whose duration we cannot forecast,” he said. “But we will not hesitate to act if expectations become unanchored.” The University of Michigan’s preliminary June survey of consumers, released on the same day as the CPI, offered an early warning: five-to-ten-year inflation expectations ticked up to 3.4%, the highest since 1995, from 3.0% in May. That metric, which the Fed’s own research identifies as a critical leading indicator of wage-price dynamics, will likely dominate the internal debate at the Federal Open Market Committee’s 17–18 June meeting.
The picture is more complicated than a mechanical pass-through from oil to inflation. The US economy is running hotter than most models recognised. Payrolls grew by 287,000 in May, and average hourly earnings accelerated to 4.4% year-on-year, a pace inconsistent with 2% inflation unless productivity growth has accelerated well beyond its current 1.6% trend. The Atlanta Fed’s GDPNow model was tracking 3.1% real growth for the second quarter as of 6 June, driven by a consumption binge that household balance sheets cannot sustain indefinitely. This is not stagflation; it’s an overheating economy absorbing a supply shock, a combination that leaves monetary policymakers with no clean choices. If they hike into the shock, they risk crushing demand at precisely the moment the economy needs flexibility to reallocate resources. If they wait, they risk letting the 1970s genie out of the bottle — and the 1970s genie, once freed, required a 20% funds rate and a double-dip recession to re-cork.
A competing view, articulated forcefully by Mohamed El-Erian, chief economic adviser at Allianz and president of Queens’ College, Cambridge, insists the Fed should hold steady and accept a temporarily higher inflation rate rather than compound the supply shock with demand destruction. “The central bank cannot print oil, it cannot reopen a strait, and it cannot unilaterally cool shelter inflation that is driven by a decade of underbuilding,” El-Erian wrote in a Bloomberg opinion column on 9 June. “Tightening now would be an unforced error — the equivalent of shooting the patient because the fever hasn’t broken.” The argument has intellectual heft: core goods inflation actually declined 0.2% in May, and the supply-chain pressures index maintained by the New York Fed remains below its long-run average. If the Strait of Hormuz reopens — and diplomatic backchannels between Oman and Tehran have intensified in recent days — energy prices could fall as fast as they rose, pulling headline inflation back toward 3.5% by September.
Yet that position assumes that the inflation expectations genie stays docile. The Michigan survey suggests it’s already stirring. And there is a deeper, more structural worry: the energy shock is not a one-off. It is the third major supply disruption in five years, following COVID-era factory closures and the Russia-Ukraine commodity crisis. Firms that spent the 2010s optimising for just-in-time efficiency are now aggressively reconfiguring for resilience — reshoring, dual-sourcing, building inventory buffers. That insurance carries a cost, and the cost is structurally higher prices. A working paper published by the Bank for International Settlements in April 2026 estimated that the shift from efficiency to resilience in global supply chains could add 0.8 to 1.2 percentage points to advanced-economy inflation over the medium term, independent of cyclical forces. If the BIS is even half right, the Fed’s 2% target may be incompatible with the geopolitical realities of the mid-2020s.
The second-order effects are already cascading. Mortgage rates, which had drifted down to 6.3% in April on hopes of Fed easing, shot back above 7% in the first week of June, freezing the spring housing market. The National Association of Realtors’ affordability index dropped to its lowest level since October 1985. In corporate credit markets, spreads on high-yield bonds widened 65 basis points in two weeks, and a major airline — already squeezed by jet fuel costs — postponed a $3.2 billion debt refinancing, citing “adverse market conditions.” Emerging-market currencies, from the Indonesian rupiah to the South African rand, sold off sharply as the dollar index climbed 2.7% in five trading sessions. A strong dollar, coupled with expensive energy, is a classic recipe for balance-of-payments stress in the developing world. The IMF’s managing director warned on 8 June that the institution is “preparing for a wave of emergency lending requests” if crude prices stay elevated beyond the third quarter.
For American businesses, the calculus is simple and unforgiving. The producer price index for May, released 24 hours after the CPI, showed a 0.9% monthly rise, with goods inputs up 1.6% — nearly all of it energy and energy-linked chemicals. Margins, which cushioned the early phase of the post-pandemic inflation, are now compressing. The S&P 500’s aggregate operating margin fell to 11.9% in the first quarter, the lowest since late 2020, and second-quarter guidance from consumer-discretionary CEOs has been laced with warnings about “elasticity exhaustion” — the point at which customers simply stop accepting price increases. Procter & Gamble, which has raised prices in 17 of the last 19 quarters, reported a 1.8% volume decline in its North American segment for the three months to March. If energy costs persist, the next round of earnings calls will be a stress test for the pricing power that Wall Street has taken for granted.
The disinflation that preceded May’s shock was real but fragile. It rested on three pillars: healing supply chains, a cooling labour market, and anchored expectations. The Middle East crisis has knocked out the first pillar. The second pillar is wobbling: the quits rate, a reliable predictor of wage pressure, rose to 2.6% in April from 2.3% in January, and the ratio of job openings to unemployed workers ticked back above 1.6. The third pillar — expectations — is now under direct assault. History suggests that once expectations begin to drift, the cost of restoring them rises nonlinearly. The Fed’s own 2022 Tealbook simulations showed that a one-percentage-point increase in expected inflation, if not countered quickly, adds 0.7 points to actual inflation within 12 months. The Michigan reading of 3.4% is not yet a one-point jump, but its trajectory is steeper than anything observed since 1991.
What makes this episode distinct is the speed with which the energy shock has transmitted into core services. In the 1973–74 oil embargo, it took roughly six quarters for higher crude prices to fully work their way into non-energy consumer prices. In 2026, that lag has compressed to what San Francisco Fed economists estimate as three to four months, owing to the prevalence of energy surcharges in service contracts, algorithmic pricing software that reprices airline seats and hotel rooms in real time, and indexed wage agreements in logistics and healthcare. The “stickier” the inflation becomes, the more painful the cure. Diane Swonk, chief economist at KPMG US, captured the anxiety in a client note on the morning of the release: “This is not 1973, but it is also not 2022. We are in a third regime — one where supply shocks are more frequent, pass-through is faster, and the Fed’s margin for patience is thinner than markets assume.”
The thin margin is evident in the options market. The Cboe Volatility Index, the VIX, closed at 29.8 on 10 June, its highest since the regional banking turmoil of March 2023. But more telling was the move in the MOVE index, which tracks Treasury volatility: it hit 158, a level that historically has preceded recessions. Bond traders are not merely pricing a rate hike; they are pricing a regime change in the structure of the economy. The term premium on the ten-year note — the compensation investors demand for bearing the risk that inflation and rates could deviate from expectations — turned positive in May for the first time since 2020 and has since widened to 42 basis points. That shift alone has added roughly $120 billion to the present value of the federal debt stock, a figure that will quietly appear in the Treasury’s next quarterly refunding announcement.
What comes next will hinge on three variables: the duration of the Strait of Hormuz closure, the reaction function of the FOMC, and the resilience of the American consumer. The first is unknowable. The second will be revealed on 18 June, when the committee releases its Summary of Economic Projections; traders will scrutinise the “dot plot” for any shift in the 2026 median. The third is measurable in real time. Real average hourly earnings, adjusted for the May CPI, fell 0.6% for the month and are now down 1.3% year-on-year. Households are drawing down the last of their pandemic-era savings buffers; the San Francisco Fed estimates that excess savings, which peaked at $2.3 trillion in mid-2021, fell below $150 billion in April. Credit card delinquencies at smaller banks have risen to 7.1%, the highest in data going back to 1991. The consumer is not broken, but the cracks are widening.
The afternoon of the CPI release, a modest two-paragraph statement from the Treasury Department confirmed that Secretary Wally Adeyemo had convened an emergency meeting of the President’s Working Group on Financial Markets. The statement named no date, no agenda. It didn’t need to. The silence was the message.
The US economy has absorbed energy shocks before, and it has absorbed inflation before. It has rarely absorbed both while sitting on a federal debt-to-GDP ratio above 120%, a housing market frozen by 7% mortgage rates, and a geopolitical map that grows more incendiary by the quarter. The 4.2% print is not a crisis. It is a warning, printed in the only language financial markets truly respect. Whether Washington and the Eccles Building heed it is a question that will be answered not in the coming weeks, but in the long, brittle months ahead. The only certainty is that the margin for error has vanished.
Discover more from The Economy
Subscribe to get the latest posts sent to your email.



Navigating Mortgage and Loan Refinancing in a High-Yield Environment
Global public debt crossing critical thresholds has kept central bank policies volatile, resulting in fluctuating US Treasury yields throughout 2026. For homeowners and commercial property holders burdened by previous high-interest borrowing cycles, finding optimal refinance windows has become a high-stakes financial puzzle. Stalled disinflation and stubborn employment numbers mean rate cuts are incremental, requiring borrowers to act with precision.
Timing your mortgage or commercial loan refinance in this environment requires a deep understanding of yield curve movements and lender risk appetites.
Decoding 2026 Refinance Dynamics
The 10-Year Treasury Yield Benchmark
Mortgage rates continue to track closely with the 10-year US Treasury yield. When macroeconomic anxiety spikes debt issuance, yields rise, tightening consumer borrowing capacity. Savvy borrowers monitor weekly Treasury auctions to lock in rates during brief dip windows.
Hybrid ARMs and Alternative Structures
With fixed rates remaining elevated, 7/1 and 10/1 adjustable-rate mortgages (ARMs) have surged in popularity. These products offer lower initial monthly payments, giving borrowers breathing room until central bank easing cycles fully materialize.
| Loan Product | Current Rate Range | Best For | Key Risk Factor |
| 30-Year Fixed Mortgage | 6.2% – 6.8% | Long-term predictability | Higher initial monthly outlay |
| 7/1 Hybrid ARM | 5.5% – 5.9% | Short-term ownership / flipping | Rate reset risk after year 7 |
| Commercial Refinance | 7.0% – 8.2% | Corporate asset restructuring | Strict DSCR lender covenants |
Actionable Steps for Successful Refinancing
To maximize your chances of securing favorable refinance terms in a volatile market, follow a disciplined preparation strategy.
Boost Your Credit Score Immediately: Lenders in 2026 are applying stringent credit tiering; a 20-point increase can drop your APR by a crucial quarter-point.
Shop Regional Credit Unions: Smaller financial institutions often offer portfolio loans with more flexible underwriting than major national banks.
Calculate the Break-Even Point: Ensure your total closing costs are recouped through monthly savings within 24 months of closing.
“Market Strategist View: Refinancing in 2026 is an exercise in opportunistic timing. Borrowers must maintain immaculate financial profiles ready to strike the moment Treasury yields dip.”
Mastering the complexities of today’s debt environment ensures you can successfully lower your debt service costs and protect your long-term financial stability.
Discover more from The Economy
Subscribe to get the latest posts sent to your email.

The days of pulling generic auto insurance quotes based purely on your zip code and age are officially over. In 2026, insurance comparison engines are powered entirely by generative AI and real-time telematics. These platforms digest thousands of live data points—ranging from your driving smoothness via connected vehicle sensors to real-time traffic congestion patterns—to generate hyper-personalized premiums instantly.
For consumers, this evolution represents both a massive opportunity for savings and a hidden trap for penalty pricing. Understanding how AI algorithms evaluate risk is essential for anyone looking to lower their monthly auto insurance premiums.
How AI Comparison Engines Evaluate Your Risk Profile
Behavioral Telematics and Connected Cars
Modern cars stream performance data directly to insurance aggregators. Generative AI models analyze braking sharpness, acceleration curves, cornering G-forces, and phone distraction metrics. Drivers who maintain smooth, defensive habits are rewarded with dynamic rate cuts of up to 40% compared to traditional rating tiers.
Predictive Traffic and Weather Modeling
AI tools now cross-reference your daily commute route with predictive weather and accident probability models. If your standard parking location or driving corridor has a statistically higher incidence of uninsured motorist claims, your quotes will reflect that hyper-local risk assessment.
| Comparison Factor | Traditional Rating Model | 2026 Generative AI Model | Impact on Premium |
| Mileage & Usage | Annual estimated odometer reading | GPS tracking & live trip duration | High (up to 35% savings) |
| Driving Behavior | MVR driving record & accidents | Real-time braking, speed, & G-force | Critical (determines tier) |
| Vehicle Tech | Make, model, and safety rating | ADAS calibration & repair cost data | Moderate |
Strategies to Lower Your AI-Driven Insurance Quote
To outsmart the algorithm and secure the lowest possible premium in 2026, drivers must proactively manage their digital footprint on insurance platforms.
Opt-In for Telematics Trial Periods: Many insurers offer immediate 15% discounts just for installing their driving app; let it track safe habits for 30 days to lock in permanent savings.
Scrub Unverified Public Records: Ensure your motor vehicle report is free of clerical errors that AI risk models misinterpret as reckless behavior.
Compare AI Aggregators: Use platforms that integrate multi-carrier API feeds rather than single-brand comparison sites to find the best risk-adjusted rate.
“Industry Note: AI-driven pricing rewards transparency and precision. Drivers who actively manage their telematics data consistently out-save those relying on legacy quote calculators.”
Embracing AI comparison tools allows savvy policyholders to customize coverage limits precisely to their driving habits, eliminating wasted premium spend while ensuring robust protection.
Discover more from The Economy
Subscribe to get the latest posts sent to your email.

Despite decades of bans and strict handling mandates, asbestos remains a silent killer across legacy manufacturing plants, shipyards, and modern green-energy infrastructure retrofits. In 2026, regulatory changes by the EPA and tightened occupational health standards have triggered a fresh wave of mesothelioma litigation. Manufacturers attempting to fast-track industrial transitions are encountering catastrophic oversight, exposing workers to legacy toxins and opening corporate parent companies to unprecedented liability.
Navigating a mesothelioma claim in 2026 requires understanding how modern industrial supply chains intersect with historical exposure. Trusts established decades ago are being audited under stricter transparency laws, altering payout ratios and accelerating fast-track settlements for terminally ill plaintiffs.
Modern Industrial Exposure Hotspots
Green Retrofitting and Renewable Energy Infrastructure
A primary source of 2026 asbestos exposure occurs during the decommissioning and retrofitting of older industrial facilities for renewable energy production. Workers insulating electrical grids, modernizing HVAC systems, or upgrading manufacturing floors frequently disturb encapsulated asbestos materials that were improperly documented or ignored during facility audits.
Automotive and Aerospace Supply Chains
With advanced manufacturing booming, workers handling specialized friction materials, gaskets, and heat shields face ongoing risks. Supply chain tracing has become more sophisticated, allowing legal teams to pinpoint exact corporate entities responsible for raw material distribution across multinational borders.
| Industry Sector | Primary Exposure Risk | Legal Venue / Trust | Avg. Claim Value Range |
| Green Energy Retrofit | Disturbed insulation, pipe lagging | Federal Tort / Manufacturer Trust | $1.2M – $3.5M |
| Shipbuilding & Marine | Boiler insulation, structural seals | Asbestos Bankruptcy Trusts | $800K – $2.4M |
| Automotive Manufacturing | Brake components, high-heat gaskets | Third-Party Product Liability | $600K – $1.8M |
Securing Maximum Compensation: Steps for Plaintiffs
Time is of the essence in mesothelioma cases. Plaintiffs and their families must act decisively to secure financial recovery before statutes of limitations expire.
Retain Specialized Counsel: Work exclusively with national mesothelioma law firms possessing deep historical databases of asbestos-containing products.
Audit Employment History: Document every job site, supervisor name, and equipment brand encountered throughout your career.
Expedite Medical Filings: Secure a formal pathological diagnosis quickly to qualify for expedited trust fund distribution and priority trial settings.
“Expert Insight: Modern asbestos litigation is no longer just about historical tracking; it is about holding modern corporations accountable for failing to conduct rigorous environmental safety audits before initiating industrial retrofits.”
By combining meticulous work history reconstruction with aggressive multi-trust filings, victims can secure substantial financial relief to cover specialized immunotherapy and family support.
Discover more from The Economy
Subscribe to get the latest posts sent to your email.

Balance of Payments (BOP)

The Falkland Islands Dispute: Sovereign Wealth, Offshore Drilling, and Market Impacts

Gross Domestic Product (GDP): Nominal vs. Real

What is Inflation and the Consumer Price Index (CPI)?

US-China Trade Competition 2026: Supply Chain Relocation Guide

Oil Prices Break $100 in 2026: Middle East Conflict & Energy Markets

South-South Trade Expansion: Digital Integration and Emerging Market Growth

$166B Tariff Refund Tapering Fast: Is Your Business Missing Out?

Stock Market Today: Dow Climbs 500 Points as Markets Shake Off Inflation Jitters

14th WTO Conference 2026: Tariffs & Global Supply Chain Impact

Swish Secures $24M Funding to Disrupt India’s $100B Food Market

Physical AI and Driverless Tech: The Next Trillion-Dollar Industrial Revolution

Enterprise AI Platforms Disrupting B2B SaaS in 2026: Full Analysis

Crypto vs. Safe Haven Assets 2026: Where Institutions Are Hedging

State Farm’s $5B Dividend 2026: Who Qualifies & Payout Dates

US-China Relations in Q3 2026: Trade Tariffs and Supply Chain Risks

Gold’s Wild 2026: From a Record $5,600 Peak to a 24% Crash and Back Toward $4,500

Oil Surges as Strait of Hormuz Traffic Collapses Again

The Rocket That Won’t Quit: Inside SpaceX’s Falcon 9 Launch Machine

Bank of England Set to Hold Rates Through Year-End, Reuters Poll Shows

SpaceX Starship Flight 14: First Orbital Attempt & Starlink V3 Launch Explained

The 2026 Crypto Regulatory Shift: What It Means for Institutional Investors

AI Chip Stocks 2026: The Best Semiconductor Investments Beyond Marvell

Retail Earnings Week: What Home Depot, Target & Walmart Reveal

AI-Powered Training: The Next Multi-Billion Dollar Ecosystem in Fitness

Russia’s Black Sea Oil Exports Fall for a Fifth Straight Week

Global Chip Selloff Deepens: What’s Driving the Aug. 19 Semiconductor Rout

Tween Back-to-School Trends 2026: What’s Driving the $85B Season
-

 Markets & Finance8 months ago
Top 15 Stocks for Investment in 2026 in PSX: Your Complete Guide to Pakistan’s Best Investment Opportunities
-

 Analysis7 months ago
Johor’s Investment Boom: The Hidden Costs Behind Malaysia’s Most Ambitious Economic Surge
-

 Analysis7 months ago
Top 10 Stocks for Investment in PSX for Quick Returns in 2026
-

 Analysis7 months ago
Brazil’s Rare Earth Race: US, EU, and China Compete for Critical Minerals as Tensions Rise
-

 Banks8 months ago
Best Investments in Pakistan 2026: Top 10 Low-Price Shares and Long-Term Picks for the PSX
-

 Investment8 months ago
Top 10 Mutual Fund Managers in Pakistan for Investment in 2026: A Comprehensive Guide for Optimal Returns
-

 Global Economy9 months ago
15 Most Lucrative Sectors for Investment in Pakistan: A 2025 Data-Driven Analysis
-

 Global Economy9 months ago
Pakistan’s Export Goldmine: 10 Game-Changing Markets Where Pakistani Businesses Are Winning Big in 2025