
Analysis
Kevin Warsh Fed Rate Hike 2026: What His Hawkish Pivot Means for Markets
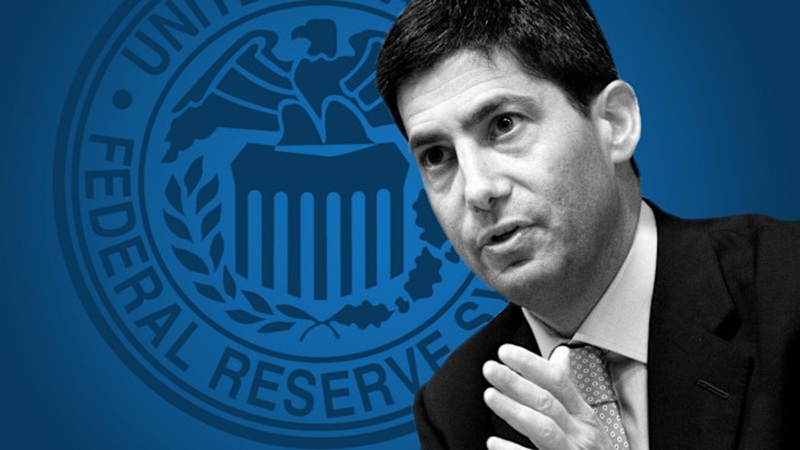
New Fed Chair Kevin Warsh surprised markets with a hawkish stance at his first FOMC press conference. Here’s how his rate-hike signals are rippling through stocks, bonds, mortgages, and gold. The Federal Reserve’s first policy meeting under new Chair Kevin Warsh sent shockwaves through global financial markets on June 17, 2026—not because policymakers moved rates, but because of what nine of them signaled they might do next.
Warsh, appointed by President Trump after months of public attacks on his predecessor Jerome Powell, arrived in Washington carrying expectations of a dovish turn. He had championed rate reductions while angling for the chairmanship, and the White House broadly supported looser monetary conditions. What markets got instead was a coldly hawkish institution that spent the better part of two hours dismantling those assumptions in real time.
The Meeting That Changed the Calculus
The Federal Open Market Committee held the federal funds rate unchanged at its existing range, but nine of 18 committee members penciled in at least one rate hike before year-end in the central bank’s updated Summary of Economic Projections—the dot plot. Six of those nine indicated support for two quarter-point increases. The shift represented a dramatic departure from the March projections, in which no policymaker had envisioned a hike, and the committee as a whole had forecast one cut.
The Dow Jones Industrial Average fell 507 points, or 0.98%, in the session. The S&P 500 lost 1.21% and the Nasdaq Composite dropped 1.34%. Two-year Treasury yields—the instrument most sensitive to near-term rate expectations—jumped 16 basis points to 4.21%, their highest reading in more than a year. Traders scrambled to reprice Fed futures, with CME FedWatch data showing the probability of a September hike jumping to 49% from 27% the previous session.
Warsh’s Statement Was Deliberately Brief—and Deliberately Alarming
The published FOMC statement was unusually short. Warsh stripped language that had previously signaled the Fed’s next move would be a cut and replaced it with a blunt acknowledgment that inflation remains “elevated”—a legacy partly of energy “supply shocks” stemming from the conflict in the Middle East.
“We’ve missed on inflation for five years and we’re going to fix that,” Warsh told reporters. “When we deliver on our price stability objectives—which we will—the American people will feel as though the hardships they’ve been living through are in the rear-view mirror.”
U.S. inflation hit 4.2%—double the Fed’s 2% target and its highest level in three years—leaving the committee little political room to stay passive. Warsh declined to submit a personal rate forecast to the dot plot, an unusual act of institutional reticence that some analysts read as an attempt to preserve maximum flexibility.
Bank of America Changes Its Forecast
Within days, Bank of America overhauled its rate outlook. Analysts at the bank predicted the Fed would raise the benchmark rate by a quarter point three times in 2026, lifting it from the current 3.5%–3.75% range to 4.25%–4.5%. The bank’s prior base case had been for rates to hold steady all year.
“The risk that they might need to raise rates has clearly risen,” said Matthew Luzzetti, chief U.S. economist at Deutsche Bank. BofA analysts acknowledged that Warsh could still be “strategically hawkish”—gaining anti-inflation credibility while actually buying time to cut later—but said the door to that interpretation was closing as incoming data showed persistent price pressure.
The hawkish turn unfolded against an unusual institutional backdrop. Warsh became the first new Fed chairman in more than 70 years to inherit an active predecessor on the governing board. Powell, whose term as chair Warsh replaced, remained as a board governor and voted at the June meeting—a fact that gives every subsequent public utterance from the former chair a level of market weight that Warsh’s team cannot easily ignore.
The Housing Market Reads a New Era
The rate signals carried immediate consequences for American homebuyers. Chen Zhao, head of economics research at Redfin, called it “a new era” and warned that mortgage rates were unlikely to retreat significantly in the near term. Bill Banfield of Rocket Mortgage noted that home sales were responding more to labor market strength than to rate movements and that determined buyers would continue entering the market—though the affordability calculus had shifted.
Vishal Garg, CEO of AI mortgage platform Better, cut to the practical point: “The Fed doesn’t set mortgage rates, but mortgage rates track long-term Treasury yields, which move based on investor expectations for inflation, growth, and the Fed’s next step.”
Warsh has separately announced five internal task forces to examine the Fed’s communication practices, data sources, and inflation-analysis frameworks—a structural reform effort that signals he intends a longer-term overhaul of the institution rather than a cosmetic change of tone.
What Comes Next
The path forward for markets hinges on three variables: whether consumer prices moderate fast enough to make hikes unnecessary, whether the labor market stays strong enough to absorb higher borrowing costs, and whether Warsh can maintain independence from a White House that publicly installed him to cut.
Kristina Hooper, chief market strategist at Man Group, summed up the market’s posture after the meeting: “Markets were holding out hope that Chair Warsh would throw them some kernels of real dovishness that they obviously felt they didn’t get.”
With BofA now projecting a rate corridor that would be the highest since 2007, and with inflation stubbornly running at twice the Fed’s target, the calculation Warsh faces is one no new Fed chair has confronted in a generation: tighten into a White House headwind or validate exactly the critics who warned his appointment was political.
Discover more from The Economy
Subscribe to get the latest posts sent to your email.


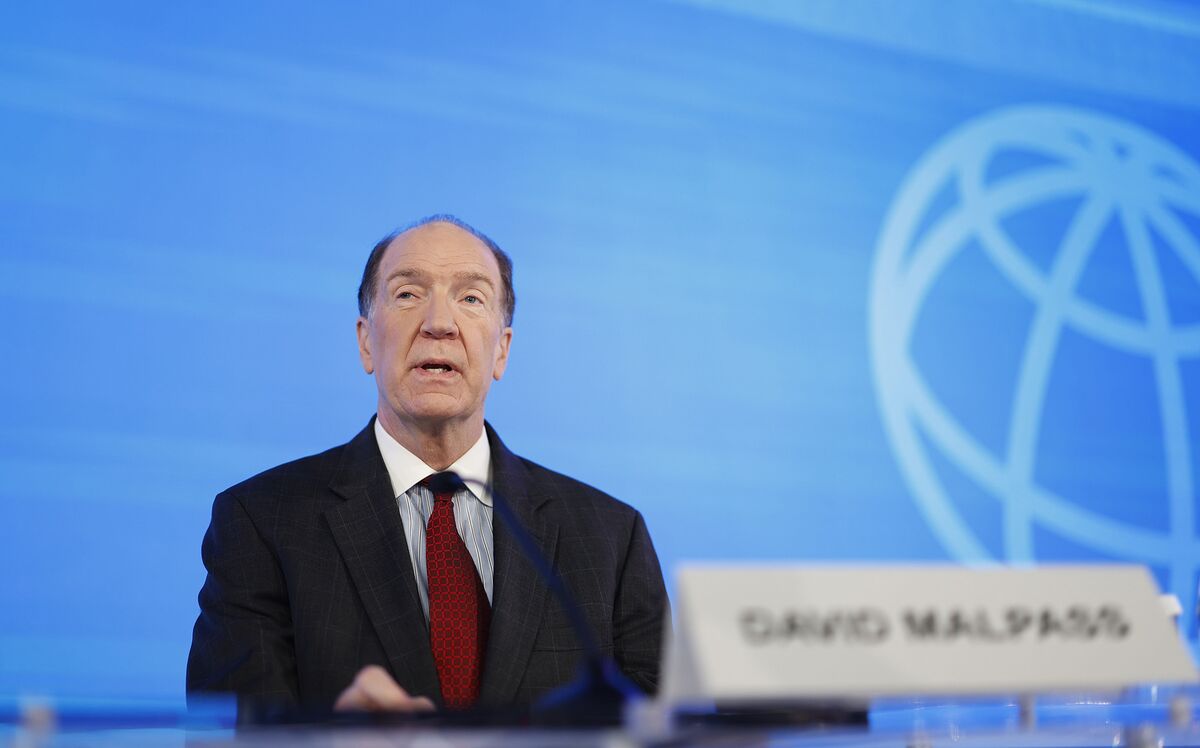
The World Bank projects global growth at 2.5% in 2026, the weakest since the pandemic, as the US-Iran conflict drives energy price spikes, inflation, and tighter monetary policy worldwide.The World Bank’s mid-2026 baseline carries a number that markets have had to absorb slowly: global GDP growth of 2.5% this year — the weakest since the pandemic — and the culprit is clear.
The World Bank’s latest Global Economic Prospects report identifies the US-Iran conflict that began in late February 2026 as the central shock reshaping the international economic outlook. Energy prices have risen sharply, inflation has re-accelerated across multiple continents, and central banks that had been on the verge of easing cycles have instead begun signalling hikes. The combination has compressed household incomes, widened fiscal deficits, and created a global policy dilemma — fight inflation or protect growth — that has no clean answer.
The Anatomy of the Slowdown
Emerging market and developing economies (EMDEs) face what the World Bank characterises as their weakest per capita income growth since the pandemic era. Growth is projected to decelerate across all EMDE regions in 2026, with the Middle East, North Africa, Afghanistan, and Pakistan bearing the worst damage given direct exposure to the conflict, higher energy import costs, and disrupted shipping. South Asia remains the fastest-growing EMDE region but has nonetheless seen forecasts revised downward.
The mechanism of transmission is threefold. Direct energy price exposure drives headline inflation and suppresses real consumer spending. Disruptions to Strait of Hormuz shipping — which handles roughly 20% of global oil trade — have compressed supply chains and added a risk premium to shipping costs more broadly. And the expectation of prolonged tighter monetary policy has pushed sovereign borrowing costs higher for indebted developing economies.
The Rio Times Global Economy Briefing captured the daily rhythm of the uncertainty: “Whether the US-Iran ceasefire holds. Renewed strikes would push oil higher and add to the inflation problem the Fed is already confronting.” As of the week of June 28, markets remained on edge about the durability of the ceasefire following reports of Iranian targeting of US military assets, which temporarily pushed Brent crude higher and triggered a brief equity sell-off before the market recovered.
Advanced Economies: Slow But Not Collapsing
Advanced nations face a different but related challenge: growth that was already below trend has been further dragged by energy costs and the policy response to inflation. Deloitte’s 2026 Global Economic Outlook noted that after years of disruptive US trade policy, the global trading system has partially reorganised — with numerous bilateral trade deals struck between non-US countries as an alternative to the US-centric framework.
France is projecting GDP growth of just 0.9% in 2026, according to Banque de France, with the contribution of net exports turning negative. Germany and Japan face their own exposure to the China Shock 2.0, as Chinese high-tech exports crowd into categories where both countries previously held competitive advantage. The US itself is navigating a narrowing current account deficit that reflects weaker domestic demand rather than export strength — an ambiguous signal that the Federal Reserve has explicitly flagged as complicating its rate decisions.
Fiscal Pressure and the Poverty Gap
One consequence of the conflict-driven slowdown that policy discussions often underweigh is the distributional impact on the world’s poorest economies. Low-income countries are projected to grow at 5.4% in 2026 — 0.3 percentage points below prior forecasts — as energy import costs consume fiscal space that would otherwise go to infrastructure, healthcare, and education. The World Bank projects that gains in per capita income, averaging 2.7% annually through 2027–28, will be “insufficient to significantly reduce poverty” given the breadth of the setback.
Fiscal pressures will limit governments’ ability to reduce food insecurity and create jobs — a combination the World Bank regards as a medium-term political risk as well as a humanitarian one. A newly identified Ebola outbreak in a low-income economy adds a further downside tail to the forecast.
The 2027 Recovery Thesis
The World Bank’s forward guidance is that a recovery should materialise in 2027–28, driven by an assumed decline in energy prices as supply adjusts and the conflict’s acute phase passes, and a rebound in global trade activity. That recovery is explicitly conditional on the ceasefire holding and conflict not escalating to involve Gulf oil infrastructure more directly. Recoveries are projected across all EMDE regions in 2027–28, but the pace will depend heavily on policy buffers — many of which were depleted fighting the post-pandemic inflation.
The upside scenario, acknowledged in the World Bank report, involves broader AI adoption lifting productivity and economic activity. Estimates of the productivity impact of AI vary “widely,” and the report notes that different scenarios “could lead to markedly different growth paths.” The AI tailwind is real but front-loaded in advanced economies, and access to the technology in lower-income countries remains constrained by infrastructure gaps and digital divides.
Discover more from The Economy
Subscribe to get the latest posts sent to your email.
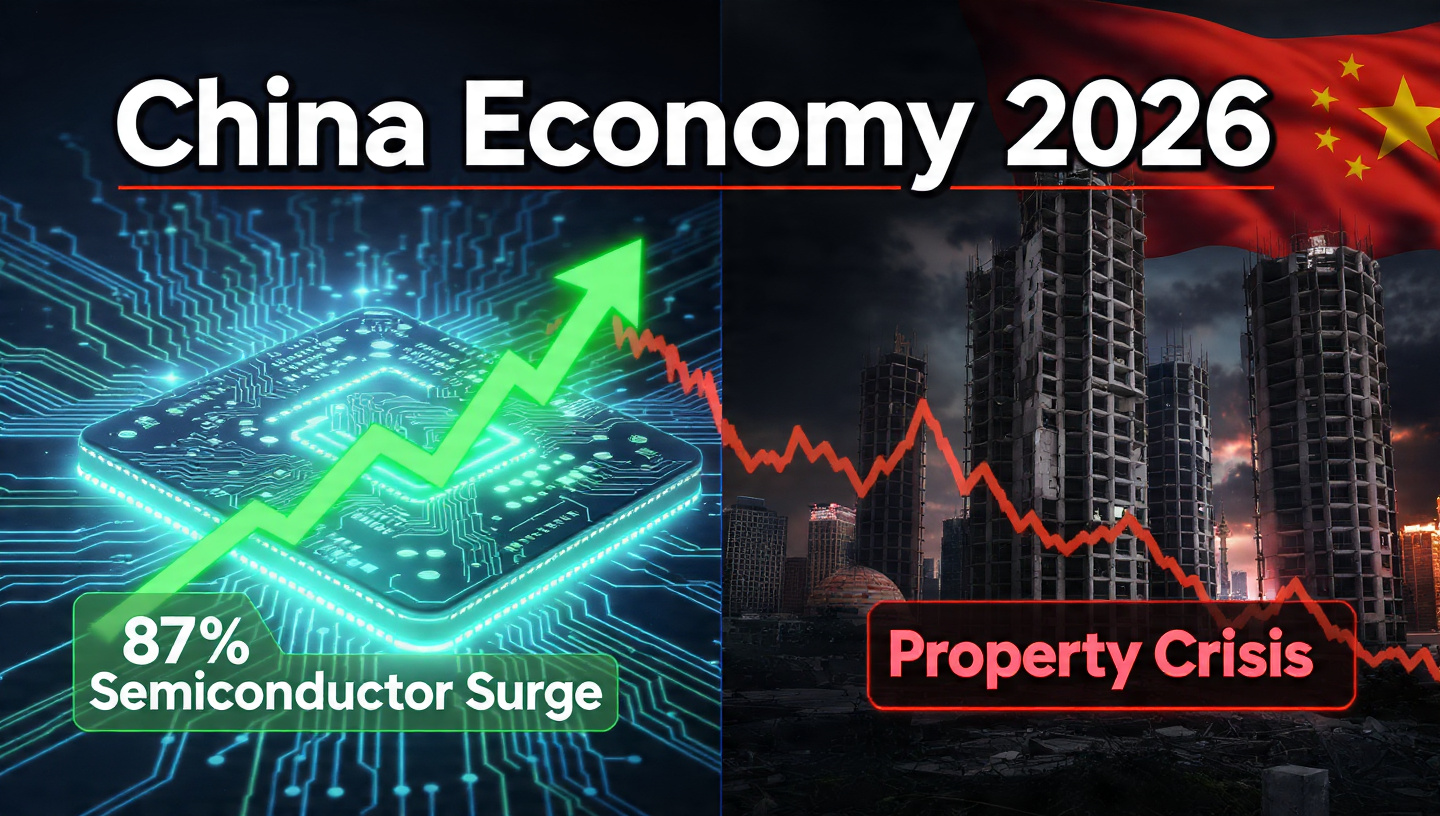
China’s May 2026 data shows high-tech manufacturing up 15.1% while property investment fell 16.2%. How Beijing’s export-led gamble is reshaping global supply chains.
The National Bureau of Statistics’ May 2026 release confirmed what economists had begun calling China’s “industrial divergence.” Scale-above industrial value-added output grew 4.5% year-on-year in May, accelerating 0.4 percentage points from April, with high-tech manufacturing surging 15.1%. The semiconductor sector was the standout: domestic output jumped 87% from the prior year, while China’s exports of semiconductors were up 110% from a year earlier, exports of mobile phones climbed 44%, and automatic data-processing machines rose 66%.
The Export Engine Running at Full Throttle
China‘s May exports (denominated in US dollars) were up 19.6% from a year earlier — the second biggest monthly increase since January 2022. The first two months of 2026 had registered an extraordinary 39.6% gain. Over all of 2025, China recorded a trade surplus exceeding $1.2 trillion — the largest ever posted by any country — as manufactured goods, particularly in advanced technology categories, poured into global markets.
The strength carries a double driver. First, the global AI boom has generated extraordinary demand for semiconductors and related hardware, where China‘s manufacturing base has rapidly scaled. Second, as domestic demand softened, manufacturers redirected capacity toward export markets. Gary Ng, senior Asia Pacific economist at Natixis, characterised this as the operative dynamic: “China’s exports have decelerated as the Iran war starts to affect global demand and supply chains,” though he noted the moderation was from record levels.
China’s economy in mid-2026 resembles a dual exposure photograph — one frame showing a technology powerhouse outpacing global rivals, the other depicting a property market in structural retreat that is slowly draining household wealth.
Goldman Sachs had projected 5–6% annual growth in China’s exports and raised its 2026 real GDP forecast to 4.8% — above both IMF projections and Bloomberg consensus. That upgrade rested on the observation that Chinese exports demonstrated resilience even against elevated US tariffs that hit 100% in April 2025 before settling at 30% in May following a bilateral agreement. Chinese exports of chips, semiconductors, autos, and auto parts continued to expand despite the tariff headwinds.
The Property Hole That Will Not Close
The other side of the ledger is less encouraging. In the first five months of 2026, fixed-asset investment fell 4.1% year-on-year — the steepest decline since May 2020. Within that, property investment dropped 16.2%. Given that roughly two-thirds of Chinese household wealth is held in real estate, the wealth destruction is persistent and consequential. Consumers saving to restore depleted balance sheets rather than spending is the logical response — and it explains why domestic retail demand has been chronically soft despite headline economic growth of 5% in 2025.
The Economist Intelligence Unit’s Nick Marro captured the strategic bet underlying Beijing’s trajectory: “There’s a strong emphasis on doubling down on manufacturing and ensuring that China’s competitive positioning in global supply chains remains sticky.” China‘s 15th Five-Year Plan (2026–2030), approved in late 2025, explicitly prioritises advanced manufacturing, semiconductors, AI, renewable energy, and digital infrastructure — doubling down on supply-side transformation rather than demand-side stimulus.
The Global Spillover: China Shock 2.0
The US-China Economic and Security Review Commission flagged a “14 percent surge in China Shock 2.0,” noting that developing markets are bearing the brunt of an export deluge driven by China’s market distortions. Unlike the original China Shock of the 2000s — which displaced labour-intensive, low-value manufacturing in rich economies — China Shock 2.0 is crowding out high-tech, high-value manufacturing in Europe and Japan. Goldman Sachs estimates that for every 1 percentage point of export-driven boost to Chinese GDP, other economies may see a 0.1 to 0.3 percentage point drag, with tech-intensive producers facing acute pressure.
Meanwhile, China’s voracious appetite for advanced chips it cannot yet manufacture domestically has produced a paradox: China imported a record $135 billion in semiconductors in the most recent quarter as AI investment accelerates. The country remains dependent on foreign-made advanced logic chips dominated by ASML, creating a structural vulnerability that its Five-Year Plan is designed to remedy — but may not resolve within this decade.
The Endgame of the Xi Gamble
The Economist captured the existential dimension of Beijing‘s strategy by quoting Johns Hopkins University‘s Yuen Yuen: “At no time in modern history has a large country gone all in on investment in high-end technology while also navigating a slowing economy and a local-government debt crisis.” Xi Jinping’s wager is that the technology-driven growth model scales faster than the old property-and-construction model collapses. The data through mid-2026 suggest the race is closer than Beijing’s official narrative acknowledges.
China’s GDP growth target for 2026 is the lowest since 1991 at 4.5–5%. Meeting it will depend on whether AI and green technology exports can sustain momentum against an Iran-related global slowdown that is already beginning to weigh on overall demand. The outcome will shape global trade balances, supply chain geography, and the AI chip economy for the next decade.
Discover more from The Economy
Subscribe to get the latest posts sent to your email.

Oracle’s stock collapsed 24% in 2026 as $130 billion in AI debt and negative free cash flow of $23.7 billion rattled markets. Inside the hyperscaler’s existential reckoning.
Larry Ellison’s audacious pivot to AI infrastructure is drawing comparisons to the dot-com implosion — and for good reason.
Oracle Corp. closed out the week of June 27, 2026 with a stock price of $148.53, down 19% in a single week — the worst weekly performance since the 2001 technology bust. The collapse has shaken not just Oracle shareholders but the entire ecosystem of AI infrastructure optimism that has dominated capital markets for the better part of two years. What began as a generational pivot into cloud computing has become a cautionary tale about how quickly leverage can transform ambition into crisis.
The Numbers Behind the Nosedive
The arithmetic is stark. Oracle’s capital expenditures surged 162% to nearly $56 billion in fiscal year 2026, leaving the company with negative free cash flow of $23.7 billion — a dramatic deterioration from just a $394 million deficit in fiscal 2025. Long-term debt ballooned to approximately $124.7 billion by the end of the third fiscal quarter, making Oracle one of the most leveraged technology companies in history relative to its operating cash generation.
Despite posting total revenue of $67.4 billion for fiscal 2026 — a 17% year-on-year gain — investors focused on what was missing rather than what was achieved. Cloud infrastructure revenue did surge 93% to $5.8 billion in the fourth quarter, and total cloud revenue climbed 47% to $9.9 billion, demonstrating genuine demand. But those gains are being funded by capital markets in a way that is testing the boundaries of investor patience.
Having already raised $43 billion in debt and $5 billion in equity during fiscal 2026, Oracle announced plans to secure a further $40 billion in fiscal 2027 — on top of a previously disclosed $20 billion at-the-market equity programme. The announcement sent shares tumbling roughly 10% in after-hours trading on the day of the earnings call.
The OpenAI Dependency Problem
Central to investor anxiety is Oracle‘s lopsided reliance on OpenAI. The ChatGPT developer accounts for the majority — at least $300 billion — of Oracle’s remaining performance obligations. The concentration risk is extraordinary for a company of Oracle’s scale. If OpenAI stumbles in its own fundraising or fails to monetise its products at the projected pace, the cascade effects on Oracle’s revenue backlog — which rose 325% to an eye-catching figure that initially thrilled analysts — could be severe.
D.A. Davidson analysts warned in a December 2025 note that, “considering Oracle is already barely hanging on to an investment grade rating, we would be concerned about Oracle’s ability to live up to these obligations without restructuring its OpenAI contract.” The concern is not hypothetical: the cost to insure Oracle’s debt against default on credit default swap markets has hit record levels, a signal that bond investors are demanding higher risk premiums.
Morgan Stanley estimates that AI-related global debt issuance will more than double to nearly $570 billion in 2026, with hyperscaler spending potentially exceeding $1 trillion by 2027. Oracle sits at the most precarious position in that ecosystem — large enough to be systemic, but without the balance sheet cushion of Amazon, Microsoft, or Alphabet to absorb multi-year cash burn.
The Margin Trap
There is a structural problem embedded in Oracle’s strategy that goes beyond near-term financing concerns. The company’s traditional enterprise software business carries gross margins of approximately 77%. Infrastructure — the business it is pivoting toward — runs at margins closer to 49% at maturity, according to FactSet analyst consensus. That is a punishing dilution for a company that has historically been valued on premium software economics.
Analysts estimate Oracle will burn roughly $34 billion in cumulative free cash flow over the next five years before the infrastructure business turns cash-flow positive in 2029. “Four or five years is a long time,” Eric Lynch, managing director at Suncoast Equity Management, told Bloomberg. “That’s just not within our investment discipline.” The concern is compounded by reports — which Oracle denied — that completion dates for data centres tied to OpenAI contracts had been pushed back from 2027 to 2028.
Meanwhile, headcount declined 13% to 141,000 employees in fiscal 2026, with pullbacks concentrated in sales and marketing — the exact functions needed to defend the existing software business from AI-native competitors. Larry Ellison, absent from the most recent earnings call, has been surpassed on the global wealth rankings by Larry Page, Sergey Brin, Jeff Bezos, and Michael Dell as the stock’s decline eroded the paper value of his stake.
What Evercore and the Bulls Are Still Saying
Not every analyst has abandoned the thesis. Evercore maintained a buy recommendation, noting that “financing/leverage and the pace of equity issuance” would remain the central investor debate “even as demand signals stay strong.” The company’s fiscal 2027 revenue guidance of $90 billion was left intact, and adjusted EPS targets were nudged higher to $8.05. Evercore analysts argue that the backlog growth and infrastructure demand pipeline are real — the question is whether markets will extend the runway needed to prove it.
The broader tech software sector offers context: the iShares Expanded Tech-Software ETF (IGV) is down 16% year-to-date in 2026, while Oracle has fallen 24% — worse than the index but not in isolation. The investor thesis on enterprise software has broadly softened on fears that large language models will automate away categories of software that have historically commanded subscription premiums.
The Systemic Warning
Oracle’s distress carries implications well beyond its own share price. Fortune reported that Morgan Stanley wealth management’s Lisa Shalett flagged Oracle’s credit default swap widening as an early warning indicator for the broader AI investment complex. If confidence in Oracle’s ability to service its debt erodes, it signals that markets are beginning to reprice the risk embedded in the entire hyperscaler debt stack — a reassessment that could spread to data centre REITs, AI chip suppliers, and enterprise cloud vendors.
The debt load, the leadership transition to dual CEOs Clay Magouyrk and Mike Sicilia, the OpenAI concentration risk, and the structural margin compression collectively make Oracle the most visible stress test of the AI infrastructure buildout in 2026. Whether it passes or fails that test will shape capital allocation across the technology sector for years to come.
Discover more from The Economy
Subscribe to get the latest posts sent to your email.

Global Economic Growth 2026: World Bank Cuts Forecast to 2.5%

Gold Price 2026: J.P. Morgan Forecasts $6,000/oz as Inflation, Iran War

US Section 301 Tariffs 2026: 60 Countries Face 12.5% Duties on Forced Labour Goods

China Economy 2026: 87% Semiconductor Surge, Property Crisis

Kevin Warsh Fed 2026: Rate Hold, Hawkish Dot Plot, and the End of Forward Guidance

SpaceX IPO 2026: $2 Trillion Valuation, Retail Frenzy, and the Risks

Oracle AI Debt Crisis 2026: $130 Billion Gamble Triggers Worst Stock Crash Since Dot-Com Bust

Male Labor Force Participation Rate 2026: Why Men Are Leaving & Economic Impact

Trump Tariffs 2026: Economic Impact, Household Costs & Trade War Outlook

China Economy 2026: Export Boom Masks Property Crisis & Investment Slump

US Inflation 4% May 2026: Is the Worst Over? Fed, Oil Prices

AI Memory Chip Shortage 2026: Nvidia, Apple & What Comes Next

US $39 Trillion National Debt 2026: Bond Market Warning Signs Explained

Ray Dalio US Suez Moment 2026: Dollar Decline, $39 Trillion Debt & Empire’s End

PwC China Partner Payouts Cut Amid Evergrande Audit Fraud

Broadcom Market Value Loss: Revenue Forecast Disappoints

Investors Pile Into Bullish Dollar Bets as ‘US Exceptionalism’ Trade Returns

Here’s How Much It’ll Cost You to Be Part of SpaceX’s Record-Breaking $75 Billion IPO

Nasdaq Tumbles 4% as Chip and Memory Stocks Sink: A $1.2 Trillion Wipeout

How to Fix Pakistan’s Debt Economy: A Structural Blueprint

Smash Capital Leads $200M Funding for Allen Control Systems

Democrats Draw a Red Line Around Military AI — And the Pentagon Is Already Pushing Back

New Investment Super-Cycle: AI, Green Energy & Re-Shoring

Xponential Fitness Franchise Lawsuit: The $3.97M Judgment

Middle East Conflict Oil Prices: The $4 Surge Explained

Grinding the Already Ground: Pakistan’s Inflation Crisis

The End of the Chatbot: Why OpenAI is Tearing Up Its Most Successful Product

Musk’s SpaceX Lines Up Retail Investors for Record IPO Allocation
-

 Markets & Finance6 months ago
Top 15 Stocks for Investment in 2026 in PSX: Your Complete Guide to Pakistan’s Best Investment Opportunities
-

 Analysis4 months ago
Top 10 Stocks for Investment in PSX for Quick Returns in 2026
-

 Analysis5 months ago
Brazil’s Rare Earth Race: US, EU, and China Compete for Critical Minerals as Tensions Rise
-

 Analysis4 months ago
Johor’s Investment Boom: The Hidden Costs Behind Malaysia’s Most Ambitious Economic Surge
-

 Banks5 months ago
Best Investments in Pakistan 2026: Top 10 Low-Price Shares and Long-Term Picks for the PSX
-

 Investment6 months ago
Top 10 Mutual Fund Managers in Pakistan for Investment in 2026: A Comprehensive Guide for Optimal Returns
-

 Global Economy6 months ago
15 Most Lucrative Sectors for Investment in Pakistan: A 2025 Data-Driven Analysis
-

 Global Economy6 months ago
Pakistan’s Export Goldmine: 10 Game-Changing Markets Where Pakistani Businesses Are Winning Big in 2025