
Markets & Finance
Gold Price 2026: Will Gold Hit $6,000? JPMorgan Forecast, Drivers & Investment Guide

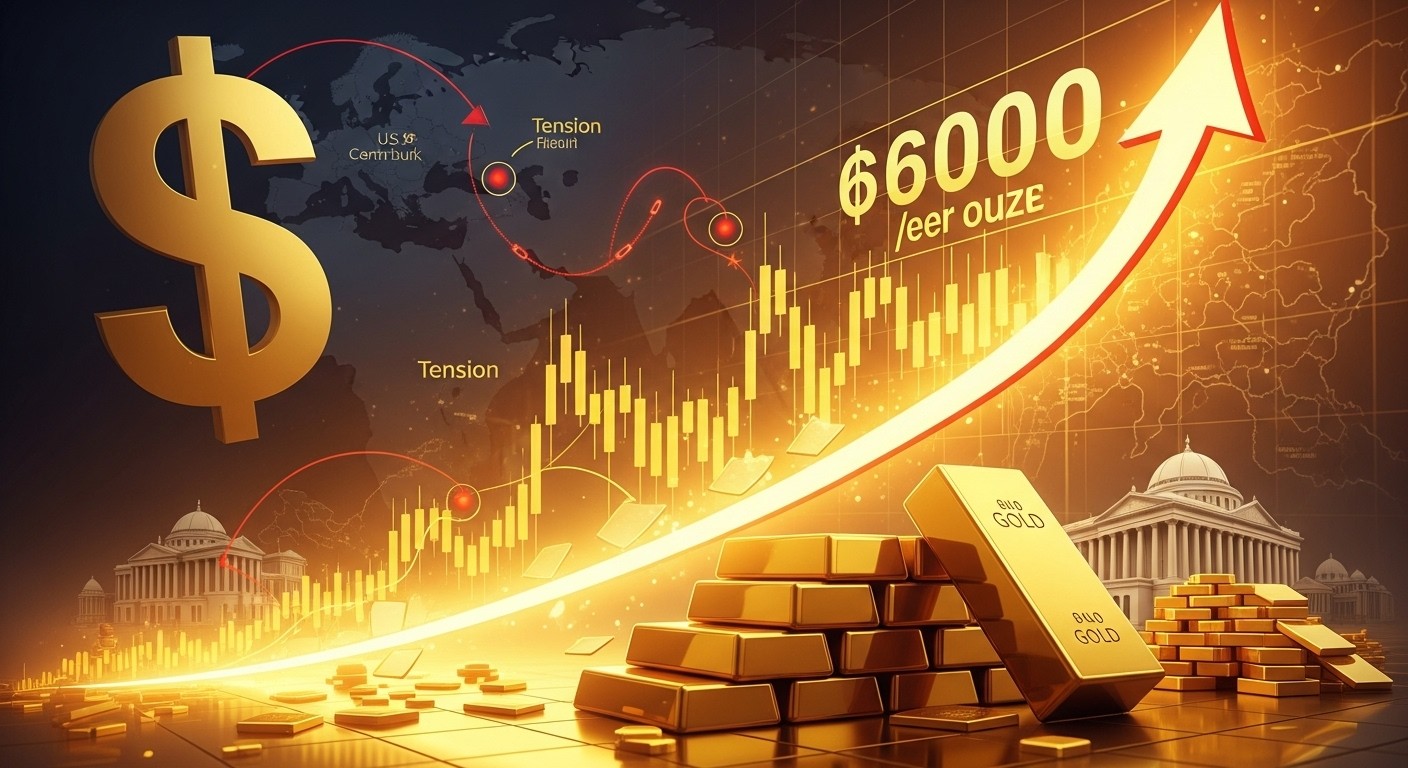
Gold hit an all-time high of $5,589 in January 2026 and JPMorgan forecasts $6,300 by year-end. Here’s the full breakdown of what’s driving gold prices and whether $6,000 is realistic.
In January 2026, gold set an all-time record of $5,589 per troy ounce. At the time, that number felt like a ceiling. Six months later, it increasingly looks like a waypoint.
JPMorgan has set a gold price target of $6,300 per ounce for 2026. Its rival Morningstar also sees continued strength. Between May 2025 and May 2026, gold’s price rose from $3,335 to $4,732 — a 41% gain that crushed equity returns on a risk-adjusted basis. Even after the partial easing of Middle East tensions, gold remains elevated, supported by a confluence of structural and cyclical forces that show no sign of reversing.
The question for investors is no longer whether gold has had a remarkable run. It is whether the factors driving that run are durable enough to push it toward $6,000 — and whether the risk-reward balance justifies increasing exposure.
What Is Driving Gold’s Historic Rally
1. Inflation at a Three-Year High
US inflation reached 4.2% year-over-year in May 2026 — double the Federal Reserve’s 2% target and the highest reading since early 2023. Gold is historically the primary hedge against sustained inflation, and the current environment is providing textbook conditions for precious metals demand. When consumer purchasing power erodes, gold’s finite supply makes it a preferred store of value for both institutional and retail investors.
2. Central Bank Accumulation
Global central banks have been systematically reducing their exposure to the US dollar and increasing gold reserves since 2022. The trend accelerated in 2025 and 2026 as geopolitical fragmentation — between the US-led West and the China-Russia-led multipolar bloc — reduced confidence in dollar-denominated assets as neutral reserve instruments.
Emerging market central banks in particular have been consistent buyers, with China, India, Turkey, and several Gulf states adding meaningfully to official gold reserves. This structural demand acts as a price floor that was not present in previous commodity cycles.
3. Dollar Weakness
The US Dollar Index declined significantly in 2025, reflecting concerns about the US fiscal trajectory, elevated debt levels, and uncertainty about Federal Reserve policy under a new chair. A weaker dollar makes gold cheaper for international buyers, stimulating demand and supporting prices. The recent hawkish turn from the Fed has provided some dollar support in June — gold fell more than 2% on the day of Warsh’s debut FOMC meeting — but the structural dollar weakening trend remains intact.
4. Geopolitical Risk Premium
The US-Iran conflict that erupted in February 2026, the Strait of Hormuz closure, and broader Middle East instability triggered a significant safe-haven premium in gold pricing. Even as the ceasefire agreement provides partial relief, gold has retained much of its war-premium valuation because the 60-day ceasefire framework leaves significant uncertainty about what follows.
Events like wars, higher tariffs, or trade disputes consistently trigger surges in gold prices. The current environment contains all three simultaneously — a combination that has driven some of the most rapid gold appreciation in recorded history.
5. Retail Democratisation of Gold Buying
Gold is more accessible to retail investors in 2026 than at any previous point in history. Major retailers including Costco have made gold coins and bullion bars available for purchase at scale. Online platforms offer fractional gold ownership. Gold ETFs have seen record inflows. The result is a broadening of the gold buyer base beyond institutional and central bank demand — adding a new structural layer of retail demand that amplifies price movements in both directions.
The JPMorgan $6,300 Forecast — What It Requires
JPMorgan’s $6,300 target for 2026 is not a base case; it is JPMorgan’s central forecast under current conditions. For it to be achieved, several things would need to continue:
Sustained central bank buying — which the data suggests will continue
US inflation remaining above 3% — currently at 4.2%, the direction is uncertain
Geopolitical risk premium persisting — the 60-day Hormuz ceasefire is not a permanent resolution
Dollar weakness — currently under pressure from Warsh’s hawkish stance
Continued retail demand — showing no signs of abating
The primary downside risks to the $6,300 target are a genuine resolution of Middle East tensions, a significant Fed tightening cycle that strengthens the dollar sharply, or a deflationary growth shock that collapses commodity demand broadly.
The Current Gold Price and What the Numbers Show
Gold’s recent trajectory illustrates the tension between safe-haven demand and real interest rate sensitivity:
- January 28, 2026: All-time high of $5,589 per ounce
- March 2026: Prices briefly retested $5,000 before pulling back
- April 2026: Oil shock and Hormuz closure pushed gold higher with energy-driven inflation
- June 17, 2026: Gold fell 2%+ on the Fed’s hawkish FOMC outcome
- Late June 2026: Prices remain well above year-start levels despite recent volatility
The gold-oil correlation has been particularly notable in 2026. Rising oil prices increase inflationary expectations, which support gold. The current oil price decline — as Hormuz traffic partially resumes — has created some near-term headwind for gold. But the structural inflation dynamic is not resolved by an oil price correction.
How to Invest in Gold in 2026: Six Approaches
1. Physical Gold (Bars, Coins, Bullion)
Direct ownership of physical metal provides maximum protection against counterparty risk and currency devaluation. Costs include storage, insurance, and dealer premiums. Retailers like Costco and specialist online dealers have dramatically lowered the access threshold.
2. Gold ETFs
Exchange-traded funds like SPDR Gold Shares (GLD) or iShares Gold Trust (IAU) offer liquid, low-cost exposure to gold prices without storage costs. Appropriate for most retail investors seeking portfolio diversification.
3. Gold Mining Stocks
Miners provide leveraged exposure to the gold price — when gold rises, mining margins improve disproportionately. The risks are operational (mining accidents, cost overruns) and jurisdictional (political risk in mining regions). Major producers like Barrick Gold and Newmont have performed strongly in 2026.
4. Gold Futures
Futures contracts allow investors to express directional views on gold prices with significant leverage. Appropriate only for sophisticated investors with risk management frameworks in place.
5. Gold IRAs
For US investors, a Gold IRA allows holding physical gold within a tax-advantaged retirement account structure. Setup costs and custodian fees apply.
6. Gold Royalty and Streaming Companies
Companies like Franco-Nevada and Wheaton Precious Metals provide gold exposure with different risk profiles — they finance miners in exchange for royalties on future production, offering upside participation with reduced operational risk.
Portfolio Allocation: How Much Gold Is Right?
Financial planners generally recommend allocating 5%–15% of a diversified portfolio to gold, with the higher end appropriate for investors with significant exposure to US dollar assets and elevated inflation sensitivity.
Gold’s role is as a store of value and portfolio stabiliser, not as a primary growth asset. Its returns are driven by different factors than equities, bonds, and real estate — which makes it a genuine diversifier. However, gold pays no dividend and generates no cash flow, so it should complement — not replace — income-generating assets.
The current environment — elevated inflation, geopolitical uncertainty, a hawkish Fed, and potential further dollar volatility — is historically one of the most supportive for gold allocations within diversified portfolios.
Will Gold Reach $10,000?
For gold to reach $10,000 per ounce within the next decade, the following would be required: sustained high inflation across major economies, significant further currency devaluations (particularly in the US dollar), continued central bank accumulation, and a structural breakdown in confidence in traditional financial assets.
None of these scenarios is impossible, but collectively they represent a significant deviation from the historical baseline. Morningstar and most mainstream analysts do not forecast $10,000 within the decade, though the scenario is increasingly discussed.
The Bottom Line
Gold’s rally in 2026 is not a bubble. It is a rational response to a rare confluence of factors — sustained inflation, central bank accumulation, geopolitical disruption, dollar weakness, and broadened retail demand — that are individually significant and collectively unprecedented in their simultaneous intensity.
JPMorgan’s $6,300 target requires the status quo to persist. The status quo, as of late June 2026, shows no sign of a fundamental reversal.
For investors without gold exposure, the question is not whether to buy. It is how much, in what form, and at what entry point in the current cycle.
FAQs
Q: What is JPMorgan’s gold price forecast for 2026?
A: JPMorgan projects gold will reach $6,300 per ounce in 2026, citing continued central bank buying, elevated inflation, and persistent geopolitical uncertainty as the primary drivers.
Q: Why is gold going up in 2026?
A: Gold’s 2026 rally reflects a combination of US inflation at 4.2% — a three-year high — geopolitical risk from the US-Iran conflict and Strait of Hormuz disruption, continued central bank gold accumulation, a weakening US dollar, and strong retail investor demand.
Q: Should I buy gold in 2026?
A: Financial planners generally recommend 5%–15% gold exposure in a diversified portfolio as an inflation hedge and store of value. The current macroeconomic environment — elevated inflation, geopolitical uncertainty, potential further dollar weakness — is historically supportive for gold. Individual circumstances and risk tolerance determine the appropriate allocation.
Q: What was gold’s all-time high?
A: Gold set an all-time high of $5,589 per troy ounce on January 28, 2026. Between May 2025 and May 2026, gold’s price rose 41%, from $3,335 to $4,732 per ounce.
Discover more from The Economy
Subscribe to get the latest posts sent to your email.



The US economy is expanding but sending mixed signals in mid-2026. Here are the four threats that could tip it into recession — and how investors and households can prepare.The US economy is, by most conventional measures, still growing. GDP expanded 1.6% in Q1 2026. The Federal Reserve Bank of Atlanta’s GDPNow model pointed to stronger second-quarter growth. The labour market has surprised three consecutive months to the upside. Goldman Sachs trimmed its recession probability estimate to just 15% following the US-Iran ceasefire agreement.
And yet something feels wrong.
Inflation sits at 4.2% year-over-year — its highest reading in three years. The Federal Reserve just delivered its most hawkish signal in years, with nine officials projecting rate hikes in 2026. Consumer spending rose just 0.1% in April, while the savings rate fell from 3.6% to 2.6%. Credit card delinquencies are rising. The AI bull market is running almost entirely on anticipation.
“The economy is literally moving at two speeds,” said David Schneider, a certified financial planner and president of Schneider Wealth Strategies. “Businesses and affluent households are stimulating growth, fuelled by AI spending and record asset prices, while the average person is increasingly anxious and financially exhausted.”
That bifurcation is not a sign of health. It is a sign of fragility.
The Four Threats That Could Tip the US Into Recession
Threat 1: Policy and Geopolitical Shocks
The Trump administration’s tariff regime — which lifted the effective tariff rate from 2.1% to an estimated 11.7% as of January 2026 — has created sustained uncertainty for businesses, consumers, and investors alike. Evidence suggests that more than 50% of these tariff costs have been passed through to consumers, adding a meaningful burden to household budgets that was not present two years ago. A 10% global baseline tariff remains in effect following the Supreme Court’s rejection of many of the more aggressive executive tariff actions.
The US-Iran war — which began on February 28 with airstrikes by the US and Israel — added an acute geopolitical shock on top of this chronic policy uncertainty. The Strait of Hormuz closure drove oil prices above $120 per barrel, fed directly into headline inflation, and complicated the Federal Reserve’s ability to normalise policy.
The 60-day ceasefire framework provides temporary relief, but a resumption of hostilities — or any new Middle East escalation — would rapidly reverse the oil price decline and reignite inflationary dynamics.
Threat 2: The Fed’s Inflation Dilemma
The Federal Reserve has tolerated inflation above its 2% target for five consecutive years. But Kevin Warsh’s debut as Fed chair in June 2026 signalled a clear shift: the Fed’s patience with above-target inflation appears to be ending.
The dilemma is acute. Raising rates aggressively to bring inflation from 4.2% to 2% risks choking off the economic growth that is sustaining employment and corporate earnings. Not raising rates risks allowing inflation expectations to become unanchored, which would ultimately require far more aggressive tightening later.
Bank of America now projects three quarter-point hikes by year-end, lifting the federal funds rate to 4.25%–4.50%. Each 25 basis point increase adds approximately $6–8 billion annually to US government debt servicing costs at current debt levels — a fiscal dynamic that compounds over time.
For households, the transmission is more direct: mortgage rates, credit card APRs, and auto loan costs all respond to the federal funds rate, directly squeezing discretionary spending.
Threat 3: Consumer Exhaustion
The American consumer has been the engine of post-pandemic growth. But that engine is increasingly sputtering.
Personal consumption expenditures rose just 0.1% in April 2026 — barely above zero. The personal savings rate fell to 2.6%, down from 3.6% the previous month — a level that implies consumers are drawing down savings to maintain spending levels. Rising delinquency rates on credit cards and auto loans suggest the pressure is not confined to lower-income households.
“Cracks beneath the surface — rising delinquencies and slowing job growth — could compound the effects on an already stressed consumer,” noted one investment strategist at a major asset manager.
High interest rates throughout 2024 and 2025 have eroded household balance sheets. Many consumers entered 2026 carrying record debt loads at elevated interest rates. Any additional shock — from higher energy costs, a job market softening, or rising borrowing costs — could trigger a spending contraction that is far harder to reverse than it was to initiate.
Threat 4: The AI Bubble
Artificial intelligence is simultaneously the most important driver of 2026 economic optimism and its most significant latent risk.
The Stanford Institute for Economic Policy Research identified AI as a central concern in its 2026 economic outlook, noting that “concerns about an artificial intelligence bubble” represent a material tail risk for the broader market. The Centre for Economic and Policy Research has gone further, launching an “AI Bubble Monitor” to track signs of speculative excess across AI-related valuations and capital deployment.
The SpaceX IPO at $2 trillion, OpenAI’s confidential S-1 filing at $1 trillion-plus, and Anthropic’s $965 billion pre-IPO valuation collectively represent approximately $3.8 trillion in market capitalisation targeting a public investor base. If AI companies prove unable to monetise their infrastructure investment at the pace their valuations require — a scenario that their current cash-flow realities make plausible — the resulting correction could cascade through technology equities, credit markets, and the broader economy in ways that are difficult to model.
The AI tail risk is not that the technology fails. It is that the business models required to justify current valuations take a decade longer to mature than current investor timelines anticipate.
What the IMF Is Saying
The International Monetary Fund revised its 2026 global growth forecast to 3.1%, down from 3.4% in 2025, in its April World Economic Outlook. The IMF framed the downgrade around three interlocking risks: the Middle East conflict, trade uncertainty, and inflationary pressure — the same factors defining the US domestic outlook.
Emerging market growth is expected to slow disproportionately, particularly in conflict-proximate economies and those with high external debt vulnerabilities. Advanced economies, including the US, are expected to see “more moderate, though still subdued” slowdowns.
Goldman Sachs, for its part, cut its US recession probability to 15% after the ceasefire agreement — a number that reflects genuine resilience in the data but leaves meaningful probability mass on the downside scenario.
Mixed Signals: Growth and Fragility Coexisting
The current US economic picture is genuinely unusual. Two opposing realities are simultaneously true:
Signs of Resilience:
- GDP grew 1.6% in Q1 2026
- Non-farm payrolls surprised to the upside for three consecutive months
- The three-month average of private payrolls reached 166,000 — its highest since June 2023
- Corporate earnings have generally remained resilient
- AI-related capital expenditure continues to support investment
Signs of Strain:
- Inflation at a three-year high of 4.2%
- Consumer spending barely above zero in April
- Savings rate falling to 2.6%
- Rising credit card and auto loan delinquencies
- A Fed now signalling tightening rather than relief
The outcome of 2026 will depend on whether the top-heavy spending — concentrated among businesses and affluent households — can continue to compensate for the exhaustion of median households. History suggests this divergence has limits.
How to Protect Your Portfolio and Finances
For Investors
Diversify away from concentrated AI exposure. The Magnificent Seven have outperformed for three consecutive years on AI enthusiasm. If AI valuations compress — whether from a bubble pop or simply from normalisation — concentrated positions in technology equities carry significant downside.
Increase fixed-income exposure cautiously. With rates potentially rising further, bond prices face near-term headwinds. But shorter-duration Treasuries and investment-grade corporate bonds offer yields that have not been available since 2007.
Consider defensive equity sectors. Healthcare, utilities, and consumer staples have historically outperformed in late-cycle environments and provide some protection against both inflation and a growth slowdown.
Maintain a gold allocation. As discussed, gold remains the most reliable hedge against the simultaneous risks of inflation, dollar weakness, and geopolitical shock.
For Households
Pay down floating-rate debt. If the Fed raises rates further, credit card APRs and home equity lines of credit will become more expensive. Every percentage point of variable-rate debt eliminated before tightening reduces exposure.
Build your emergency fund. A 2.6% savings rate implies the median American household has limited buffer for an income disruption. Three to six months of expenses in liquid savings provides the cushion that prevents a job loss or unexpected expense from becoming a financial crisis.
Lock in fixed-rate borrowing. If you are considering a mortgage or auto loan, a fixed-rate product eliminates the tightening risk that variable-rate instruments carry into an uncertain rate environment.
The Bottom Line
A US recession in 2026 is not the base case — Goldman’s 15% probability estimate captures the consensus. But the combination of elevated inflation, a hawkish Fed, exhausted consumers, geopolitical fragility, and an AI valuation premium built on unproven cash flows creates a risk profile that warrants genuine preparation rather than complacency.
The US economy is not heading off a cliff. But it is walking close enough to the edge that the positioning decisions made now — by investors, households, and policymakers — will materially determine how the second half of 2026 unfolds.
FAQs
Q: Will there be a recession in 2026?
A: As of late June 2026, a recession is not the base case. Goldman Sachs puts the probability at 15% following the US-Iran ceasefire. However, the combination of 4.2% inflation, a hawkish Fed, slowing consumer spending, and AI valuation risks creates a meaningful tail risk.
Q: What are the warning signs of a US recession in 2026?
A: Key indicators to watch include consumer spending growth slowing below zero, credit delinquency rates rising, the unemployment rate climbing, the yield curve inverting further, and any significant AI-related market correction.
Q: What is US GDP growth in 2026?
A: US GDP grew 1.6% in Q1 2026. The Federal Reserve Bank of Atlanta’s GDPNow model pointed to stronger Q2 growth, but the full-year outlook depends heavily on whether the Fed tightens further and how the consumer holds up.
Q: How do I protect my money in a potential recession?
A: Key steps include reducing floating-rate debt, building an emergency fund of 3–6 months of expenses, diversifying equity exposure away from concentrated AI positions, and maintaining a gold allocation as an inflation and safe-haven hedge.
Discover more from The Economy
Subscribe to get the latest posts sent to your email.
Markets & Finance
Global Stock Markets 2026: S&P 500 at Record Highs Amid War, Inflation & Rate Risk

The S&P 500 is trading near 7,400. The Nasdaq Composite sits above 25,000. The Dow Jones Industrial Average has traded above 51,000. Germany’s DAX is near record levels. European bourses broadly have recovered from the shock of the Middle East conflict.
None of this is supposed to make sense. The United States is managing the aftermath of a war with Iran. Inflation is at a three-year high. The Federal Reserve has just delivered its most hawkish signal in years. Oil inventories are at their lowest levels since 2003. And yet equities are — by most historical valuation measures — significantly overvalued and refusing to reflect the risks that seem obvious from the headlines.
How is this possible? And more importantly for investors: how long can it last?
The Paradox of the Resilient Market
To understand why global equity markets are elevated in 2026, the conventional frameworks need updating. The pre-war, pre-AI-boom mental model — where high inflation leads to rate hikes which lead to multiple compression which leads to market declines — is too linear.
What 2026 markets are doing is more complex: they are simultaneously pricing AI-driven earnings optimism and geopolitical risk relief, while discounting the slow-moving structural risks that have not yet crystallised into specific negative events.
This is not irrational. Markets are discounting mechanisms. They do not price what is visible in today’s headlines; they price what investors collectively believe will be visible in earnings, rates, and economic conditions 12–18 months from now. In 2026, the collective bet appears to be:
- The US-Iran ceasefire holds and oil prices remain subdued
- AI capex generates genuine earnings growth in the technology sector
- The Fed’s hawkish signal does not translate into aggressive tightening that chokes growth
- Consumer spending slows but does not collapse
- The AI bubble deflates gradually rather than popping catastrophically
If all five of those things are true simultaneously, the current market valuation is defensible — though stretched. If any one of them fails materially, the downside repricing could be sharp.
The AI Premium: Real or Illusory?
The single most important driver of US equity market performance since 2023 has been the AI premium embedded in technology sector valuations. The Magnificent Seven — Apple, Microsoft, Alphabet, Amazon, Nvidia, Meta, and Tesla — have collectively driven a disproportionate share of S&P 500 returns.
The valuation premium they carry is based on a belief that AI will generate secular earnings growth that justifies current multiples. This is not pure speculation — there is real revenue evidence:
- Microsoft‘s Azure cloud business is growing rapidly on AI-driven demand
- Alphabet is monetising AI through search and cloud
- Meta has seen significant advertising efficiency gains from AI-driven targeting
- Nvidia‘s AI chip revenue has exceeded all prior forecasts
But the premium also contains genuine speculative excess. According to GuruFocus, the S&P 500 as represented by the SPY ETF was priced at approximately $754.83 in mid-June 2026, while its GF Value — a fundamental intrinsic value estimate — stood at $650.66. That represents approximately 16% overvaluation on a fundamental basis.
Sixteen percent overvaluation is not a bubble by historical standards. The peak of the dot-com bubble involved overvaluations an order of magnitude larger. But 16% above intrinsic value, combined with the macro risks described above, implies limited margin of safety.
European Markets: The Recovery That Surprised
European equity markets have been among the more surprising performers in 2026. Germany’s DAX closed 1.59% higher in the week of June 16, France’s CAC 40 rose 1.40%, and Italy’s FTSE MIB gained 2.31% — all strong weekly performances in an uncertain macro environment.
The UK’s FTSE 100 was the notable outlier, slipping 0.69% in the same period — weighed down by political uncertainty following reports that presumptive next prime minister Andy Burnham intends to reassign Chancellor Rachel Reeves to a more junior role. The BBC and Financial Times reports prompted a sharp currency and equity reaction, underscoring how much political risk premium UK assets carry ahead of a potential change in government.
Europe’s resilience despite weak fundamentals is partly explained by composition. The major European indices have lower technology weighting and higher exposure to financial services, industrials, and energy — sectors that have benefited from the rate environment and, in energy’s case, from the elevated commodity price environment.
The eurozone trade deficit — which swung to a EUR 1 billion deficit in April against expectations of a EUR 7.8 billion surplus — is a concerning signal about European competitiveness. The surprise deficit was driven by a growing energy trade deficit and a shrinking machinery and vehicles surplus. Germany’s wholesale prices rose 5.9% year-over-year in May, down from 6.3% in April — still elevated, with petroleum products and nonferrous metals leading increases.
The ZEW Indicator of Economic Sentiment rose sharply in June 2026 to its first positive reading since the start of the Middle East conflict — a sign that European investor confidence is recovering as energy prices ease, even if the underlying data remains mixed.
Emerging Markets: Divergent Fortunes
Emerging market equity performance in 2026 has been shaped primarily by three variables: commodity prices, US rate expectations (which drive dollar strength and capital flow dynamics), and geopolitical proximity to the Middle East conflict.
South Korea had one of the most dramatic EM stories — a near-100% Kospi rally through mid-2026, driven by semiconductor and AI supply chain positioning, followed by a sharp 10% correction as global tech sentiment shifted.
Brazil is navigating a genuine policy dilemma. The central bank cut its benchmark Selic rate by 25 basis points to 14.25% — its third consecutive cut — but delivered a cautious statement acknowledging that both economic activity and inflation have accelerated. The Selic rate remains among the highest real interest rates of any major economy, a legacy of Brazil’s own inflation challenge.
Indonesia remains under watch from index providers, with the MSCI Indonesia review a key near-term catalyst for the Jakarta Composite. A potential upgrade or downgrade from MSCI — depending on market accessibility improvements and foreign ownership rule changes — could drive significant capital flows into or out of Indonesian equities.
China presents the most complex EM story, as detailed elsewhere: a property sector in structural contraction, a technology sector in aggressive expansion, and a PBOC navigating carefully between domestic stimulus needs and external currency management constraints.
The Rotation Trade: Away From Growth, Toward Value
One of the defining equity market dynamics of 2026 has been the rotation from growth to value — from high-multiple technology stocks to financials, industrials, healthcare, and consumer staples.
This rotation is classically associated with the late phase of an economic expansion: when growth expectations moderate, when rates are elevated or rising, and when investors are seeking earnings certainty over earnings optionality.
The rotation does not require a market crash. It can proceed while the overall index trades sideways or grinds modestly lower. But it does imply that passive index investing in the S&P 500 — with its heavy technology weighting — faces a structural headwind as long as the rotation continues.
Active managers with the flexibility to overweight financials, healthcare, and defensive sectors relative to technology may outperform in this environment. The case for active management versus passive is stronger in late-cycle environments than at any other point in the economic cycle.
The Three Scenarios for 2H 2026
Scenario 1: Soft Landing (Base Case — 50% Probability)
The ceasefire holds, oil prices stabilise in the $70–$85 range, the Fed hikes once or twice but growth remains positive, consumer spending muddles through, and AI earnings broadly meet elevated expectations. Markets grind sideways to modestly higher. S&P 500 ends 2026 in the 7,200–7,600 range.
Scenario 2: Hawkish Shock (Elevated Probability — 30%)
The Fed hikes three times as BofA forecasts, pushing the federal funds rate to 4.25%–4.50%. Mortgage rates rise, consumer spending contracts, and the AI premium compresses on rate-driven multiple contraction. S&P 500 pulls back to 6,400–6,800. Technology and growth stocks underperform defensives significantly.
Scenario 3: Geopolitical Escalation (Tail Risk — 20%)
The 60-day ceasefire framework breaks down, oil prices spike above $100, inflation expectations become unanchored, and the Fed faces the impossible choice of fighting inflation in a stagflationary environment. S&P 500 could fall to 5,800–6,200 in an acute shock scenario. Gold surges, bonds rally as the growth scenario deteriorates, and defensives outperform sharply.
The Bottom Line
Global stock markets are elevated not because investors are ignoring the risks of 2026 — inflation, war, tariffs, AI bubble concerns, and an uncertain Fed path — but because they are betting the good scenarios outweigh the bad.
That bet may be correct. The US economy has demonstrated remarkable resilience. AI infrastructure investment is real and growing. The ceasefire has provided oil price relief. Corporate earnings, while not accelerating, have not collapsed.
But the margin of safety has been consumed by three years of AI-driven multiple expansion. Markets that are 16% above intrinsic value, with a hawkish Fed, geopolitical uncertainty, and consumers under pressure, do not crash automatically — but they do not recover easily from negative surprises.
Investors who position for resilience — through diversification, defensive sector exposure, fixed-income duration management, and commodity hedging — are better placed for 2H 2026 than those who extrapolate the last three years of AI momentum indefinitely forward.
FAQ
Q: Why is the stock market so high in 2026?
A: Markets remain elevated primarily due to AI-driven earnings optimism in the technology sector, geopolitical relief from the US-Iran ceasefire, and resilient corporate earnings. However, valuations are approximately 16% above fundamental intrinsic value, leaving limited margin of safety.
Q: Is the S&P 500 overvalued in 2026?
A: By GF Value estimates, the S&P 500 is approximately 16% overvalued as of mid-June 2026. This is not an extreme overvaluation by historical standards, but it does imply limited margin of safety against macro risks including a Fed tightening cycle, geopolitical escalation, or AI earnings disappointment.
Q: What could cause a stock market crash in 2026?
A: The primary downside scenarios include: a resumption of Middle East conflict pushing oil back above $100; an aggressive Fed tightening cycle compressing technology multiples; a rapid AI bubble deflation if leading AI companies miss earnings expectations; or a consumer spending contraction driven by debt exhaustion and rising borrowing costs.
Q: What is driving global stock market gains in 2026?
A: The primary driver is AI-related technology sector performance. Secondary drivers include geopolitical risk relief from the US-Iran ceasefire, resilient corporate earnings, and accommodative financial conditions in parts of Europe and emerging markets.
Discover more from The Economy
Subscribe to get the latest posts sent to your email.

Concerns over economic sovereignty are driving a global push to create alternatives to Visa and Mastercard. From BRICS payment systems to CBDCs, here is the complete picture of the financial infrastructure revolution underway in 2026.
The Invisible Infrastructure That Runs the World
Every time you tap your credit card, swipe at a terminal, or pay online, a transaction flows through a network that most people never think about — a duopoly controlled by two American companies: Visa and Mastercard. Together, they process trillions of dollars in transactions annually, connecting over 100 million merchant locations across 200 countries.
For decades, this arrangement was simply the background infrastructure of global commerce. Now it is a geopolitical flashpoint. Concerns over economic sovereignty are fueling a global search for alternatives to Visa and Mastercard. The Iran war, US sanctions policy, and the dollar’s role as a financial weapon have combined to create unprecedented urgency — from Moscow to Beijing to Riyadh to New Delhi — for payment systems that cannot be switched off by Washington.
The Weaponization Moment: How the Iran War Changed the Calculus
The 2026 US-Iran conflict provided the clearest demonstration yet of what financial exclusion looks like in practice. When the United States launched airstrikes against Iran in February 2026, sanctions were tightened almost simultaneously. Iranian entities were cut off from SWIFT, the international messaging system for bank transfers. Visa and Mastercard suspended operations for Iranian-linked institutions. Trade with Iran — which many Asian nations depended on for energy — was financially complicated overnight.
For policymakers from India to Indonesia to Turkey, watching Iran get cut off from global payment infrastructure was not an abstract lesson. It was a direct preview of what could happen to them if they were ever on the wrong side of US foreign policy. The race to build alternatives has been accelerating ever since.
The Alternatives Taking Shape
BRICS Pay and Regional Systems: The BRICS bloc — Brazil, Russia, India, China, South Africa, and its newer members — has been developing a cross-border payment system that bypasses both SWIFT and US dollar settlement. Progress has been slow, but the political will is stronger than ever. China’s CIPS (Cross-Border Interbank Payment System) already handles renminbi-denominated transactions and is expanding.
Central Bank Digital Currencies (CBDCs): Over 130 countries are now in some stage of CBDC development. China’s digital yuan (e-CNY) is the most advanced, with tens of millions of users and cross-border pilots underway with several Asian nations. The Bank for International Settlements is facilitating a “mBridge” project linking central bank digital currencies across multiple jurisdictions, designed explicitly to reduce dependence on dollar-denominated correspondent banking.
India’s UPI Global Expansion: India’s Unified Payments Interface has become the world’s largest real-time payment system domestically and is now being extended internationally, with partnerships in Singapore, the UAE, France, and several African nations. It represents a model of national payment sovereignty that other emerging markets are studying.
Regional Card Networks: The Middle East has seen accelerated development of regional card networks following the Iran crisis. Gulf states, acutely aware of their own potential vulnerability to sanctions, have been investing in payment infrastructure that routes domestically rather than through New York correspondent banks.
Why This Matters for the Dollar
The dollar’s role as the world’s reserve currency has been underpinned in part by the dollar-dominated infrastructure of global payments and trade finance. If significant volumes of international trade — particularly commodity trade — shift to payment systems that bypass dollar settlement, the structural demand for dollars would decline over time.
This is a long-term, slow-moving process rather than an imminent disruption. Visa and Mastercard’s network effects, the liquidity of dollar markets, and the trust built over decades are enormous advantages that no emerging competitor can replicate quickly. But the direction of travel is clear, and the Iran crisis has significantly accelerated the timeline.
For the United States, the challenge is existential at the margins: the more aggressively it uses financial exclusion as a geopolitical tool, the more it incentivizes the world to build systems that reduce its leverage. The dollar dilemma is real and growing.
FAQ
Q: Why are countries trying to build Visa/Mastercard alternatives? Primarily for economic sovereignty — to ensure that US sanctions policy cannot cut off their access to global payments. The Iran war demonstrated in real time how quickly American financial infrastructure can be used as a weapon. Countries from China to India to Brazil are developing alternatives to reduce this vulnerability.
Q: What is a CBDC? A Central Bank Digital Currency is a digital form of a country’s official currency, issued and backed by the central bank. Unlike cryptocurrencies, CBDCs are centrally controlled and can be programmed with specific features. Many countries are developing CBDCs partly as a tool for reducing dependence on US-dominated payment infrastructure.
Q: Can any system realistically replace Visa and Mastercard? In the near term, no. Visa and Mastercard’s network effects, global merchant acceptance, and consumer trust make them extremely difficult to displace. But the alternatives being built are not trying to replace them globally — they are trying to create parallel corridors for specific trade relationships that can function outside US financial oversight.
Discover more from The Economy
Subscribe to get the latest posts sent to your email.

Gold Price 2026: Will Gold Hit $6,000? JPMorgan Forecast, Drivers & Investment Guide

US Recession 2026: Four Key Threats, Warning Signs & How to Protect Your Portfolio

AI Energy Demand 2026: Data Centres, Power Grids & the $725B Infrastructure Boom

AI Semiconductor Selloff 2026: Micron Crash, Nasdaq Pullback & What Comes Next

US Tariffs 2026: How Trump’s 11.7% Effective Rate Is Reshaping Global Trade & Inflation

Global Stock Markets 2026: S&P 500 at Record Highs Amid War, Inflation & Rate Risk

Spain Near 100M Tourists: A Structural Travel Map Shift : Booming Travel Economy

Wellness Tourism’s $1 Trillion Rise Is Rewriting Travel Rules

Warsh’s Fed Kills the Rate-Cut Trade:Inflation, and Your Money

Indonesia vs. MSCI, Greenspan’s Legacy vs. Warsh’s Revolution, Micron vs. the Memory Shortage: A Global Finance Scorecard for Mid-2026

The End of Visa and Mastercard’s Monopoly? Rise of Alternatives

AI’s Energy Hunger Is Rewriting Global Power Markets: Reshaping the World Economy

UK Political and Economic Turmoil: Rachel Reeves’ Fall, Britain’s Fiscal Crisis

China’s Export Miracle Masks a Property Disaster: Growing Without Its People

KPMG Australia CEO Resigns After Whistleblower Claims Exposed Investigation Failures

PwC China Partner Payouts Cut Amid Evergrande Audit Fraud

Broadcom Market Value Loss: Revenue Forecast Disappoints

Investors Pile Into Bullish Dollar Bets as ‘US Exceptionalism’ Trade Returns

Here’s How Much It’ll Cost You to Be Part of SpaceX’s Record-Breaking $75 Billion IPO

Nasdaq Tumbles 4% as Chip and Memory Stocks Sink: A $1.2 Trillion Wipeout

How to Fix Pakistan’s Debt Economy: A Structural Blueprint

Smash Capital Leads $200M Funding for Allen Control Systems

Democrats Draw a Red Line Around Military AI — And the Pentagon Is Already Pushing Back

New Investment Super-Cycle: AI, Green Energy & Re-Shoring

Russia Overspends on Putin’s War in Ukraine by $28bn

Xponential Fitness Franchise Lawsuit: The $3.97M Judgment

Musk’s SpaceX Lines Up Retail Investors for Record IPO Allocation

The End of the Chatbot: Why OpenAI is Tearing Up Its Most Successful Product
-

 Markets & Finance6 months ago
Top 15 Stocks for Investment in 2026 in PSX: Your Complete Guide to Pakistan’s Best Investment Opportunities
-

 Analysis4 months ago
Top 10 Stocks for Investment in PSX for Quick Returns in 2026
-

 Analysis5 months ago
Brazil’s Rare Earth Race: US, EU, and China Compete for Critical Minerals as Tensions Rise
-

 Analysis4 months ago
Johor’s Investment Boom: The Hidden Costs Behind Malaysia’s Most Ambitious Economic Surge
-

 Banks5 months ago
Best Investments in Pakistan 2026: Top 10 Low-Price Shares and Long-Term Picks for the PSX
-

 Investment6 months ago
Top 10 Mutual Fund Managers in Pakistan for Investment in 2026: A Comprehensive Guide for Optimal Returns
-

 Global Economy6 months ago
15 Most Lucrative Sectors for Investment in Pakistan: A 2025 Data-Driven Analysis
-

 Global Economy6 months ago
Pakistan’s Export Goldmine: 10 Game-Changing Markets Where Pakistani Businesses Are Winning Big in 2025