
Global Economy
The Reform Dividend Realized: Why India Earned 2025’s Economic Crown amongst Developing Nations

How a decade of structural transformation, digital revolution, and resilient policymaking propelled the world’s most populous nation to become the year’s undisputed growth champion
The Economy researched the massive list of Super performers but randomly selected India for the crown . India claims 2025’s economic crown with 8.2% GDP growth, historic poverty reduction, and digital revolution. How structural reforms and resilient policy made India the year’s undisputed growth champion.
On a humid morning in September 2025, Rajesh Kumar stood outside his small electronics shop in Pune’s Kothrud neighborhood, watching customers stream in to pay via QR codes displayed on his storefront. Five years ago, 80% of his transactions involved cash; today, that figure has inverted. His story mirrors millions across India: 18.39 billion UPI transactions in June 2025 alone, processing $285 billion monthly—more than Visa’s global volume. Behind these numbers lies a transformation
far more profound than payment rails. India in 2025 achieved what few emerging economies manage: translating structural reforms into sustained, broad-based prosperity while navigating unprecedented global headwinds.
The verdict from international institutions is unequivocal. India’s GDP expanded 7.8% year-over-year in the April-June quarter of fiscal 2025-26, surging past market expectations and the previous year’s 6.5%, then accelerated to 8.2% in Q2. Following economic expansion of 6.5% in FY2024/25, the IMF projects real GDP will grow 6.6% in FY2025/26. In a year when Germany stagnated, China decelerated to 4.8%, and advanced economies struggled with inflation aftershocks, India stood alone among major powers as the undisputed engine of global growth.
This achievement transcends simple GDP arithmetic. India’s 2025 performance represents the culmination of reforms planted years earlier finally bearing fruit—a story of political will meeting economic opportunity at precisely the right moment. From the GST overhaul to labor code implementation, from fintech democratization to infrastructure acceleration, this is how India earned its designation as 2025’s Economy of the Year.
The Numbers That Rewrite Expectations
GDP Growth: Beating Forecasts Across the Board
The surprise wasn’t merely India’s real GDP growth rising to 8.2% in Q2 of fiscal year 2025-26 compared to 5.6% in the same quarter the previous year, marking a six-quarter high, but the narrow differential between real and nominal GDP growth at just 8.7%. This compression signals genuine productivity gains rather than inflation-driven expansion.
Quarterly momentum tells the acceleration story vividly:
- Q1 FY25-26: 7.8% growth
- Q2 FY25-26: 8.2% growth
- Combined first-half performance: 8.0% average, exceeding all major forecasts
Among the top 50 largest economies, Ireland leads with 9.11% growth, followed by India at 6.65% and Vietnam at 6.46%. India’s sustained pace across consecutive quarters, however, demonstrates resilience that episodic oil booms or one-off windfalls cannot match.
The sectoral composition reveals balanced expansion rather than narrow dependency:
- Services sector: 9.3% growth, driven by financial services, IT, and hospitality
- Secondary sector (manufacturing and construction): 7.6% expansion
- Agriculture: 2.9%, constrained by weather variability but stabilizing
Notably, GVA growth registered 7.6% in April-June 2025, while India is projected to reach GDP of $5 trillion by 2027 and become the world’s third-largest economy with projected GDP of $7.3 trillion by 2030.
Per Capita Progress: Quality Alongside Quantity
Absolute growth means little without per capita improvement. The estimated GNI per capita for India in 2025 is $2,878 at current prices according to IMF World Economic Outlook, while in 2023 India’s GNI per capita increased by 6.72% reaching $2,540. Over the past three years, per capita income has climbed 35.12% in constant terms—tangible improvement in living standards for 1.4 billion people.
Investment and Capital Formation
To sustain high growth and reach high-income status by 2047, India needs to increase total investment from the current 33.5% of GDP to 40% by 2035. The groundwork is being laid: The Production-Linked Incentive programme launched in 2020 across 14 sectors attracted ₹1.76 lakh crore in committed investment and created over 1.2 million jobs by March 2025, with government disbursals crossing ₹21,500 crore.
Financial Stability Metrics
India’s fiscal discipline strengthened even amid growth acceleration:
- Fiscal deficit reduced from 6.4% to 5.9% of GDP in FY24, stabilizing public debt around 83% of GDP.
- The financial and corporate sectors remained resilient, supported by adequate capital buffers and multi-year low non-performing assets.
- FDI equity inflows for FY26 (April-June 2025) surged 13% to $18.62 billion, with significant investments in services and computer software sectors.
The Reform Foundation: Policy Architecture That Delivered
India’s 2025 breakthrough wasn’t accidental—it emerged from systematic reform implementation reaching critical mass. Three policy domains converged to create conditions for breakout growth.
GST 2.0: Turning Tax Simplification Into Growth Fuel
The GST 2.0 reforms moved tax rates on essential goods from 12% to 5% and many items from 28% to 18%, alongside exemptions for essentials like food staples, reducing household costs by up to 13%. This wasn’t mere rate adjustment—it represented philosophical reorientation toward consumption-driven growth.
Gross GST collections for October 2025 stood at ₹1.96 lakh crore, marking a 4.6% increase over the prior year. More importantly, the system’s maturation reduced compliance friction. The four-slab structure of 5%, 12%, 18% and 28% simplified decision-making for businesses, while reforms reduced costs and enabled seamless movement of goods across states.
The multiplier effects cascaded through the economy. Higher disposable income from income tax exemptions up to ₹12 lakh for individuals led to increased spending, particularly in consumer-driven sectors, supporting domestic demand and economic growth. Automobile sales surged 15.8% year-over-year in October, while real estate transactions accelerated as home loan costs dropped approximately 7-8% following RBI rate cuts.
Labor Codes: Unlocking India’s Demographic Dividend
The four labour codes on wages, industrial relations, social security, and worker safety enacted on 21 November 2025 represent perhaps the most transformative reforms. Decades of fragmented regulation across 29 central laws finally consolidated into coherent framework.
The reforms’ significance extends beyond legal tidiness. To sustain growth acceleration, India must increase overall labor force participation from 56.4% to above 65% and raise female labor force participation rates from 35.6% to 50% by 2047. Early indicators suggest movement in the right direction: Employment growth outpaced working-age population expansion since 2021-22, with rising employment rates among women, while urban unemployment fell to 6.6% in Q1 FY24/25—the lowest since 2017-18.
The Employment-Linked Incentive scheme targets 35 million new jobs over 2025-2027, offering wage subsidies to first-time employees and support to employers. Combined with skilling initiatives under the Skill India Mission that trained over 60 million citizens, India addresses both job creation and workforce readiness simultaneously.
Monetary Policy: Threading the Needle
India’s consumer price inflation fell to 0.25% in October 2025 from 1.44% in September—the lowest on record and well below the RBI’s 4% target. This remarkable disinflation occurred even as growth accelerated, testament to supply-side improvements and effective monetary transmission.
Food prices, accounting for nearly half the CPI basket, dropped 2.28%—the largest decline since a record 2.65% fall in December 2018. The RBI’s cumulative 100 basis point rate cuts in 2025 supported growth without reigniting price pressures, demonstrating mature central banking in emerging markets.
The Digital Revolution: Infrastructure as Competitive Advantage
If reforms provided the foundation, India’s digital public infrastructure delivered the acceleration mechanism. The transformation extends far beyond convenience—it represents fundamental rewiring of economic relationships.
UPI: From Payment Rails to Global Standard
In FY 2024-25, UPI achieved a landmark with 185.87 billion transactions amounting to ₹261 lakh crore in value. With over 640 million daily transactions and 18.39 billion transactions in June 2025 alone worth ₹24 lakh crore, UPI officially overtook Visa in volume, cementing its position as the world’s most used real-time payments infrastructure.
The numbers merely hint at deeper transformation. UPI facilitates over 20 billion transactions monthly and accounts for 84% of India’s digital retail payments, with over 504 million users and 65 million merchants. This democratization brought formal financial services to hundreds of millions previously excluded.
India’s 87% fintech adoption rate compares to 67% globally, while India achieved 80% financial inclusion in just 6 years—a process that normally takes 50 years. The Pradhan Mantri Jan Dhan Yojana opened over 555 million accounts with deposits exceeding ₹2.57 lakh crore, transforming welfare delivery through Direct Benefit Transfer that has transferred over ₹44.34 lakh crore directly into beneficiary accounts.
UPI now accounts for 85% of India’s digital transactions and contributes to nearly 60% of all real-time digital transactions globally. International expansion proceeded rapidly, with UPI active in seven countries and partnerships established across Singapore, UAE, France, Mauritius, Sri Lanka, Bhutan, Qatar, and Malaysia.
Fintech Ecosystem: Innovation at Scale
India’s digital economy’s productivity is five times higher than other sectors, with its share in Gross Value Added expected to reach 20% by 2029-30, potentially adding up to $1 trillion to GDP by 2030. The fintech sector specifically is projected to reach $990.45 billion by 2032, growing at 30.26% CAGR from 2024.
By 2024, more than 10,000 fintech firms operated in India, raising over $28 billion through 1,486 agreements between 2014 and 2023, creating 26 unicorns including one decacorn. The IPOs of Groww and Pine Labs in 2025 demonstrated public market confidence in scaled fintech models, while companies like Razorpay and Cashfree expanded into cross-border remittances, targeting India’s $29 billion annual outward remittance market.
Digital Infrastructure: The Competitive Moat
Beyond payments, India’s Digital Public Infrastructure created lasting advantages. DigiLocker spurred over 77.6 billion digital document verifications as of December 2024, while Co-WIN managed the national vaccination drive and e-governance platforms made services accessible. Aadhaar, the biometric identification system launched in 2009, now underpins everything from welfare delivery to KYC processes, reducing friction across the economy.
Investments in cybersecurity are projected to reach $35 billion by 2025 from $4.50 billion in 2018, reflecting awareness that digital infrastructure requires robust protection. The regulatory sandbox provided by RBI allows controlled experimentation, fostering innovation while managing risk.
The Resilience Factor: Navigating Headwinds
India’s 2025 achievement gains significance from the hostile external environment it overcame. Under the baseline assumption of prolonged 50% US tariffs, India maintained robust growth supported by favorable domestic conditions.
Managing Currency and Capital Flows
India witnessed foreign equity outflow of about ₹1.57 trillion in 2025, while the rupee experienced pressure. Yet India recorded FDI inflow of $81.04 billion in FY 2024-25, marking a 14% increase from $71.28 billion in FY 2023-24—the highest level in three years.
The composition shifted strategically: Services sector emerged as the top FDI recipient, attracting 19% of total inflows and rising 40.77% to $9.35 billion, while manufacturing FDI grew 18% reaching $19.04 billion. Capital expenditures in greenfield projects surged 28% to $110 billion in 2024 according to UNCTAD, with India leading South Asia in FDI despite regional challenges.
Inflation Control Amid Global Volatility
While developed economies wrestled with persistent inflation, India engineered remarkable disinflation. Headline inflation declined markedly to 0.25% in October 2025, driven by subdued food prices, marking the ninth consecutive month below the RBI’s 4% target. Improved weather supported agriculture production, while GST rationalization tempered goods inflation.
This achievement allowed accommodative monetary policy supporting growth without compromising price stability—a luxury few central banks enjoyed in 2025.
Energy and Commodity Management
Global commodity volatility typically devastates import-dependent emerging markets. India’s diversified energy sourcing and strategic reserves management mitigated exposure. Renewable capacity additions accelerated, reducing fossil fuel dependency while positioning India favorably in the global energy transition.
The Human Dimension: Inclusive Growth Beyond Aggregates
Poverty Reduction at Historic Pace
Extreme poverty living on less than $2.15 per day fell from 16.2% in 2011-12 to 2.3% in 2022-23, lifting 171 million people above the threshold. Rural poverty declined from 69% to 32.5% while urban poverty dropped from 43.5% to 17.2%, narrowing the rural-urban gap from 25 to 15 percentage points.
The five most populous states—Uttar Pradesh, Maharashtra, Bihar, West Bengal, and Madhya Pradesh—accounted for 65% of India’s extreme poor in 2011-12 and contributed to two-thirds of the overall decline by 2022-23. This broad-based progress demonstrates reforms reached those most in need.
Multidimensional poverty declined from 29.17% in 2013-14 to 11.28% in 2022-23, reflecting improvements beyond income in health, education, and living standards. Direct Benefit Transfer eliminated intermediaries, saving the government over $27 billion by 2022 while ensuring welfare reached intended beneficiaries.
Employment: Quantity and Quality
The unemployment rate in India stands at 4.9% according to PLFS 2024-25, with rural unemployment at 4.2% and urban at 6.7%. Employment growth outpaced working-age population expansion since 2021-22, with rising employment rates among women, while urban unemployment fell to 6.6% in Q1 FY24/25—the lowest since 2017-18.
Self-employment rose, particularly among rural workers and women, contributing to economic participation, while female labor force participation showed improvement though remaining at 35.6%. The shift from unpaid family labor toward formal employment accelerated, indicating quality improvement alongside job creation.
The Production-Linked Incentive program’s 1.2 million jobs and the Employment-Linked Incentive scheme’s 35 million job target over 2025-2027 demonstrate government commitment to employment generation beyond natural market forces.
Income Distribution: Progress and Persistence
The consumption-based Gini index improved from 28.8 in 2011-12 to 25.5 in 2022-23, indicating reduced inequality. Yet challenges persist: The median earnings of the top 10% were 13 times higher than the bottom 10% in 2023-24, reflecting persistent income inequality, while youth unemployment remained high at 13.3%, increasing to 29% among tertiary education graduates.
These disparities underscore that growth quality requires continued attention. Infrastructure investment reaching tier-2 and tier-3 cities, rural skill development, and educational access expansion remain critical priorities.
The Global Context: Geopolitical Positioning
India’s 2025 economic performance occurred against skillful diplomatic navigation. The “China Plus One” supply chain diversification trend accelerated, with multinational manufacturers establishing Indian operations. The number of source countries for FDI increased from 89 in FY 2013-14 to 112 in FY 2024-25, underscoring India’s growing global appeal.
Free trade agreements with 50 nations including the US, European Union, and Eurasia are being negotiated, with the UK agreement concluded in July 2025. These negotiations recognize India’s market size, democratic governance, and strategic importance in an increasingly multipolar world.
The government’s dual strategy—deepening economic integration while maintaining strategic autonomy—allowed India to benefit from Western supply chain shifts while preserving relationships with traditional partners. This balancing act, increasingly difficult in fragmented geopolitical landscape, enhanced India’s positioning as reliable partner and attractive destination.
By cultivating a more resilient and formalized economy, India enhances its strategic autonomy and attractiveness as an investment destination, offering a scalable and democratic alternative for manufacturing and services in global supply chain strategies.
Shadows on the Horizon: Sustainability Questions
Celebrating 2025’s achievement requires acknowledging risks that could derail momentum.
External Vulnerabilities
Further deepening of geoeconomic fragmentation could lead to tighter financial conditions, higher input costs, and lower trade, FDI, and economic growth. US tariff uncertainty, though partially absorbed in 2025, remains variable that could impact export sectors. Europe’s stagnation threatens key markets, while Middle East tensions create energy price volatility.
Global FDI declined 11% year-over-year in 2024 according to UNCTAD’s World Investment Report 2025, while weak global demand impacted exports with April 2025 marking the steepest export decline since 2012 according to S&P Global Manufacturing PMI.
Fiscal Space Constraints
States’ increasing subsidies including farm waivers and cash transfers pose fiscal problems, with 14 states potentially spending ₹1.9 lakh crore annually (~0.6% of GDP) on women-targeted schemes by 2025. Balancing welfare imperatives with fiscal sustainability requires discipline as election pressures mount.
Public debt stabilization around 83% of GDP leaves limited buffer for counter-cyclical measures should global shocks materialize. Infrastructure investment needs compete with social spending demands in resource allocation.
Implementation Challenges
Execution remains critical as banks must swiftly transmit rate cuts, businesses must pass on GST savings, and government must finalize rules under labour codes to avoid ambiguity. Regulatory clarity gaps could stall private investment essential for sustaining growth.
The IMF noted risks among non-bank financial institutions and rising input costs that could affect investor confidence. Credit quality in personal loan and credit card segments warrants monitoring given unsecured nature and high interest rates.
Environmental and Climate Pressures
Unpredictable weather shocks could affect crop yields, adversely impacting rural consumption and reigniting inflationary pressures. Climate adaptation requires substantial investment—resources diverted from immediate growth-enhancing projects.
Rapid urbanization strains infrastructure and creates air quality challenges. Balancing growth imperatives with environmental sustainability demands policy innovation and resource mobilization.
Skills and Education Gaps
Youth unemployment remained high at 13.3%, increasing to 29% among tertiary education graduates, indicating persistent skill mismatches. Educational institutions must align curricula with evolving industry needs, particularly in technology sectors.
Female labor force participation at 35.6%, though improving, significantly lags peers and constrains growth potential. Cultural barriers and lack of supporting infrastructure limit women’s economic participation.
The Road Ahead: Consolidating Gains
India’s 2025 performance established platform for sustained expansion—if policymakers navigate wisely.
Near-Term Priorities
The World Bank recommends four critical areas: enabling states to grow faster together through differentiated approaches; increasing total investment to 40% of GDP by 2035; raising labor force participation above 65%; and accelerating overall productivity growth.
The RBI must balance supporting growth through accommodative policy against inflation vigilance as global conditions evolve. Further financial sector reforms recommended by the 2024 FSAP and FATF require implementation. Exchange rate flexibility with strategic intervention will help absorb external shocks.
Medium-Term Reforms
Labor market integration remains incomplete despite code enactment. Effective implementation, particularly expanding formal employment and social security coverage, will determine whether demographic dividend converts to demographic disaster.
Educational quality improvement, vocational training expansion, and digital literacy enhancement must accelerate. The Atal Tinkering Labs, expanded IIT capacity, and AI centers represent starting points requiring scale-up.
Agricultural productivity lags potential despite sector employing 45.5% of workforce while contributing just 18.4% of GDP. Modernization, value chain integration, and climate-resilient practices offer substantial growth opportunity.
Infrastructure development through PM GatiShakti and the National Logistics Policy improved India’s logistics ranking, but continued investment in ports, highways, railways, and digital connectivity remains essential. The ₹1.5 lakh crore interest-free loans to states for infrastructure must deploy effectively.
Long-Term Structural Transformation
India aims to reach high-income status by 2047, requiring average growth of 7.8% over the next 22 years—ambitious but achievable given recent acceleration.
Manufacturing sophistication must increase, moving up value chains from assembly to design and innovation. The Production-Linked Incentive program across 14 sectors provides framework, but private sector dynamism and R&D investment determine outcomes.
Services sector, already 55% of GDP, offers continued expansion potential particularly in high-value segments like financial services, IT, healthcare, and education. Digital infrastructure advantages position India favorably in globally tradeable services.
Environmental sustainability cannot remain afterthought. Renewable energy capacity expansion, circular economy principles, and green technology adoption must integrate with growth strategy rather than constraining it. The energy transition, supported by concessional financing access, offers leapfrogging opportunity.
Comparative Perspective: Lessons for Emerging Markets
India’s 2025 success offers instructive contrasts with alternative models and peer experiences.
South Sudan recorded 24.3% projected growth while Guyana ranks third with 9.3% driven by oil export boom. These resource-driven spurts lack India’s structural foundations and diversification. Single-commodity dependence creates volatility and vulnerability that sustainable development requires transcending.
China’s 4.8% growth in 2025 reflected maturing economy facing structural challenges, while India’s higher growth occurred with improving rather than deteriorating demographics. China’s development model—export-led industrialization with authoritarian governance—contrasts with India’s consumption-driven growth within democratic framework.
The comparison with East Asian tigers decades earlier is instructive. South Korea in the 1980s and China in the 2000s achieved similar growth rates during industrialization phases. India’s services-led growth and democratic governance create different trajectory—potentially more sustainable but requiring different policy toolkit.
What distinguishes India’s 2025 performance is holistic nature: fiscal responsibility, monetary stability, reform implementation, and digital transformation converging simultaneously. Too often, emerging markets achieve growth by mortgaging future through unsustainable debt, tolerating inflation, or depending on commodity windfalls. India demonstrated growth with stability is possible.
The Investment Case: Market Recognition
India’s benchmark equity indices—BSE Sensex and NSE Nifty—are poised to close 2025 with 9.5% and 10.7% gains respectively, underperforming global peers’ stronger returns. The BSE Sensex recorded its highest-ever closing figure at 86,159.02 points on December 1, 2025, while the Nifty 50 climbed to 26,325.80 points.
Market performance lagged GDP growth for several reasons. Foreign equity outflows of ₹1.57 trillion reflected global fund reallocation toward China and Japan, which attracted $96,225 million and $46,979 million respectively as of September 2025. India’s limited exposure to AI hardware and platforms weighed on sentiment compared to markets benefiting from technology concentration.
Yet fundamentals support optimism. The IPO pipeline for 2026 appears robust, with lending and payments fintechs likely to lead. Analysts expect domestic institutional flows to offset foreign volatility, while improved earnings growth should support valuations.
While the Nifty rose only 8-9% in 2025, its five-year CAGR of 17.98% demonstrates sustained wealth creation. India’s equity market capitalization crossing milestones reflects deepening of financial sector and growing retail participation—structural positives for long-term development.
Conclusion: A Moment, or a Movement?
India’s designation as 2025’s Economy of the Year recognizes achievement already in the books. The critical question is whether this represents inflection point or temporary acceleration.
Several factors suggest sustainability. Reforms implemented in 2025 were years in gestation—GST simplification, labor codes, digital infrastructure maturation. Their benefits will compound rather than exhaust. The demographic dividend has decades to run if policy converts population into productive workforce. Infrastructure investment creates foundation for future productivity gains rather than one-time stimulus.
The global environment favors India structurally. Supply chain diversification from China creates manufacturing opportunities. Services digitalization plays to India’s strengths. The democratic governance model attracts partners seeking reliable alternatives to authoritarian regimes.
Yet complacency threatens derailment. External shocks remain possible and potentially severe given global fragmentation. Domestic political economy could prioritize short-term populism over long-term foundations. Implementation lapses could undermine well-designed reforms. Environmental pressures could constrain growth if unaddressed.
The comparison India faces is not between success and failure but between good and great. Achieving 6-7% growth through 2047 seems likely; whether India can sustain 7.5-8% determining high-income attainment requires excellence across policy domains.
What makes India’s 2025 story compelling isn’t just numbers—impressive as 8% growth, 2.3% extreme poverty, 185 billion UPI transactions, and $81 billion FDI are—but the transformation they represent. A decade ago, India symbolized bureaucratic sclerosis, infrastructure deficits, and unrealized potential. Today, it demonstrates that democratic developing nations can execute complex reforms, harness technology for inclusion, and deliver broad-based prosperity.
For policymakers in Jakarta, Lagos, or Mexico City grappling with similar challenges, India’s experience offers roadmap: invest in digital public infrastructure, simplify tax and regulatory systems, empower rather than direct private sector, maintain fiscal and monetary discipline, and recognize that sustainable growth requires patience and persistence.
Rajesh Kumar in Pune’s Kothrud neighborhood embodies the transformation. His electronics shop uses digital payments, accesses credit through fintech platforms, files taxes online, and reaches customers via e-commerce. His children attend improved schools, his family benefits from direct subsidy transfers, and his business navigates less corrupt bureaucracy. Multiply his experience across millions of shops, farms, and enterprises, and India’s economic crown becomes comprehensible.
The question for 2026 and beyond is whether India consolidates this momentum or allows it to dissipate. The tools exist—reformed institutions, digital infrastructure, human capital, democratic resilience. Whether the political will sustains and external environment permits will determine if 2025 marked beginning of India’s great acceleration or merely another promising start unfulfilled.
For now, India has earned its moment. The world watches to see if moment becomes movement.
Discover more from The Economy
Subscribe to get the latest posts sent to your email.


Banks
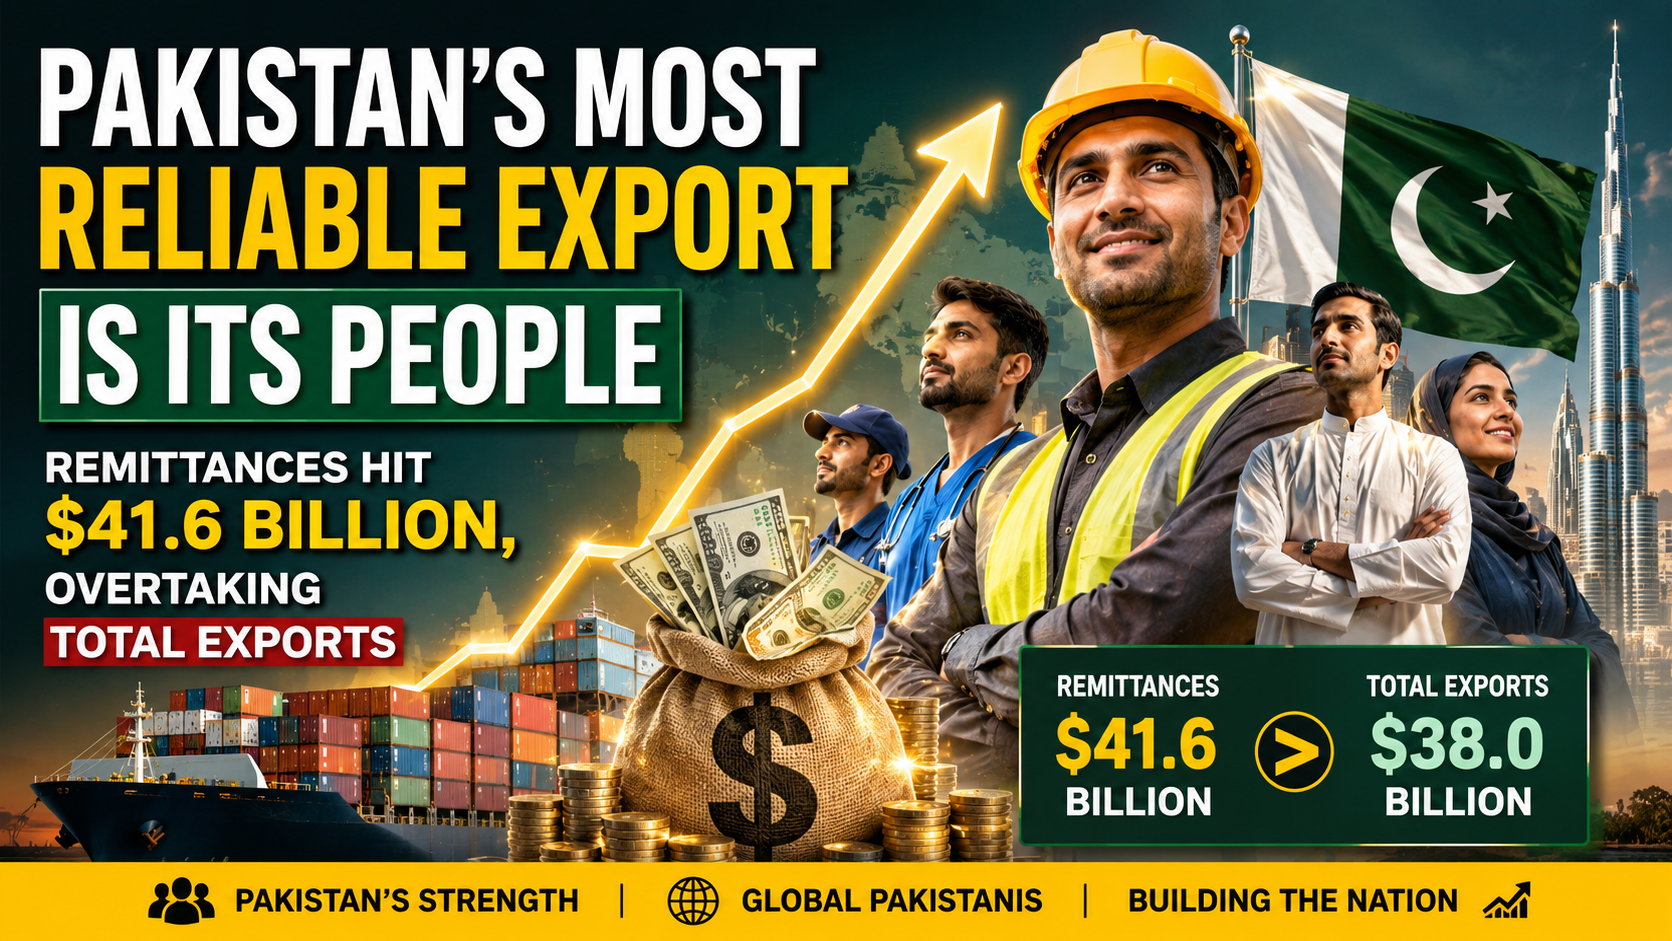
Pakistan’s Most Reliable Export Is Its People: Remittances Hit $41.6 Billion, Overtaking Total Exports
Introduction
For the first time in the country’s history, money sent home by Pakistan’s overseas workers has exceeded the value of everything Pakistan actually sells abroad. Remittances hit a record $41.6 billion in the fiscal year ending June 30, 2026, according to State Bank of Pakistan data — surpassing total merchandise exports for the same period and cementing a structural shift that economists are increasingly uneasy about (VOI World/State Bank of Pakistan).
The Numbers Behind the Milestone
Remittance inflows rose 8.6% year-on-year in FY26, up from $38.3 billion in FY25 (VOI World). Some reporting puts the full 11-month figure even higher at $38 billion before the final month was tallied, with May 2026 alone contributing $4.25 billion — an amount roughly equal to what the entire country spends on imports in a single month (Express Tribune). A separate Express Tribune report puts the full FY26 total even higher, at $41.58 billion, an increase of nearly $3.29 billion over the prior year, delivered “without structured educational, training or welfare support” for the overseas workforce generating it (Express Tribune — Remittances Without Structured Support).
Saudi Arabia remained the single largest source of remittances in June 2026 at $829.6 million, followed by the UAE ($792.3 million), the United Kingdom ($514.9 million) and the United States ($296.8 million), with Italy and Oman each contributing more than $100 million (VOI World). That geographic concentration matters: a substantial share of Pakistan’s remittance base originates from the Gulf, leaving the country’s external account exposed to labor market reforms, economic cycles and geopolitical developments concentrated in a single, currently volatile region (Business Recorder Editorial).
Exports Have Been Stuck for Years
The remittance surge stands in sharp contrast to Pakistan’s export performance, which has shown little sustained dynamism despite years of concessional financing, preferential tariff regimes and subsidized energy for exporters (Business Recorder Editorial). The textile sector — long considered the backbone of Pakistan’s export economy — has been stuck in a $15–18 billion annual range for years, even as a handful of forward-thinking textile groups have managed to grow exports and diversify product lines under the exact same operating conditions others cite as prohibitive (Express Tribune). Separately reported nine-month data for the fiscal year showed exports contracting 5.8% to $23.3 billion even as imports rose nearly 8% to $46.8 billion, widening the trade gap further (Minute Mirror).
Over the three fiscal years from 2023 to 2025, Pakistan received $95.8 billion in remittances compared with $91 billion in merchandise exports — a gap that reflects, according to Business Recorder analysis, a deliberate policy orientation that has effectively institutionalized remittances as the default tool for stabilizing the current account rather than addressing the underlying export weakness (Business Recorder Opinion).
The Dutch Disease Warning
Independent economists have begun explicitly framing this pattern as a precursor to Dutch disease — the phenomenon where a large, easy source of foreign currency inflow reduces the pressure and incentive to build a competitive tradeable export sector (Business Recorder Opinion). The policy dimension is not incidental: under IMF program conditions, a long-standing subsidy that had encouraged banks to actively mobilize remittance transfers was withdrawn in the 2026 Budget, contributing to a temporary slowdown in inflows during the early months of the fiscal year before the government released Rs30 billion from its contingency fund to help revive momentum (Business Recorder Opinion).
A Business Recorder editorial published in July 2026 was blunt about the implication: Pakistan’s overseas workers have effectively become the country’s “most reliable export,” with its own people functioning as its largest export commodity — a framing the editorial explicitly calls an unsustainable foundation for long-term development strategy (Business Recorder Editorial).
The Silver Linings
The remittance boom has provided genuine macroeconomic stabilization. Total liquid foreign reserves crossed $23.98 billion as of early July 2026, including $18.47 billion held by the State Bank of Pakistan itself, with the rupee holding relatively steady around Rs278 per dollar in the interbank market (Express Tribune — Remittances Without Structured Support). Inflation has also been easing, and large-scale manufacturing showed signs of recovery with 5.9% growth in earlier-reported data, while agricultural lending rose 14.4% during July–February, extending credit access to farmers (Minute Mirror). Separately, Pakistan has reportedly repaid roughly Rs4,722 billion in debt ahead of schedule and posted a historic milestone in IT sector exports, suggesting pockets of genuine structural improvement exist alongside the broader export stagnation (Radio Pakistan).
Why This Matters Beyond Pakistan
Pakistan’s experience is a useful case study for other remittance-dependent emerging economies navigating IMF program conditions. The core tension — using a reliable, low-effort capital inflow to paper over a harder structural problem in the tradeable goods sector — is not unique to Pakistan, but few economies illustrate the scale of the imbalance as starkly as a country where remittances now formally exceed total exports.
Key Takeaways
- Pakistan’s FY26 remittances hit a record $41.6 billion, surpassing total merchandise exports for the first time in the country’s history.
- Saudi Arabia and the UAE remain the largest single sources, concentrating external account risk in the Gulf region.
- Textile exports have been stuck between $15–18 billion annually for years despite sustained government support.
- Economists are increasingly framing the remittance-export imbalance as a Dutch disease risk rather than a stabilization success story.
- Reserves have strengthened to nearly $24 billion and the rupee has stabilized, but the underlying export competitiveness problem remains unresolved.
Sources: VOI World, Express Tribune — Remittances Dwarf Exports, Express Tribune — Remittances Without Structured Support, Business Recorder Opinion, Business Recorder Editorial, Minute Mirror, Radio Pakistan
Discover more from The Economy
Subscribe to get the latest posts sent to your email.
Markets & Finance
Indonesia’s Confidence Problem: Record Investment, a Sinking Rupiah, and a Widening Credibility Gap

Introduction
Indonesia’s economic story in mid-2026 is one of genuine contradiction. On one hand, the government posted a record Rp1,010.6 trillion ($56.1 billion) in realized investment for the first half of the year, up 7.2% from a year earlier and on pace to hit its full-year target (Antara News). On the other, the rupiah has been sliding toward Rp18,000 per US dollar, the state budget deficit has widened, and a growing chorus of domestic commentators is warning that Indonesia risks permanently losing what one Jakarta Post analysis called “the vital game of investor confidence” (The Jakarta Post).
The Investment Numbers Look Genuinely Strong
Indonesia’s Investment and Downstreaming Minister Rosan Roeslani reported that first-half 2026 investment realization reached 49.5% of the government’s full-year target of Rp2,041.3 trillion, creating 1.44 million jobs — a 15% increase in job creation compared to the first half of 2025 (Antara News). Domestic and foreign investment remained almost perfectly balanced, with foreign direct investment reaching Rp507.6 trillion (50.2% of the total) against Rp502.9 trillion in domestic investment (Antara News). Notably, investment outside the country’s most populous island, Java, exceeded inflows into Java itself for the first time in this dataset — Rp507.8 trillion versus Rp502.8 trillion — supporting the government’s long-standing goal of more balanced regional development (Antara News).
Singapore remained by far Indonesia’s largest source of foreign capital at $8.8 billion, followed by Hong Kong ($7.6 billion), China ($3.9 billion), Japan ($1.9 billion) and the United States ($1.7 billion) — together accounting for roughly 77.8% of all foreign direct investment into the country (Antara News). Second-quarter investment specifically rose 7.1% year-on-year to Rp511.8 trillion, with Minister Roeslani noting that investor commitment to Indonesia has held up despite significant “geopolitical and geoeconomic challenges” globally (The Jakarta Post).
But the Pace Is Slowing, and the Currency Is Under Pressure
Despite the record absolute figures, the Jakarta Post notes that investment growth in 2026 has been running at a distinctly slower pace than the country achieved in recent prior years, even as it remains on track to hit the annual target (The Jakarta Post). Meanwhile Bank Indonesia has had to actively respond to renewed rupiah weakness, attributing the currency’s slide toward Rp18,000 per dollar to hawkish signals from Federal Reserve officials and broader movements in the US dollar index (Samuel Sekuritas Daily Economic Insights). The state budget deficit reached Rp196.5 trillion in the first half of 2026, equivalent to 0.76% of GDP (Samuel Sekuritas Daily Economic Insights).
There has been some relief more recently: a 27.4% surge in second-quarter foreign direct investment helped strengthen the rupiah, with USD/IDR trading around 17,990 in mid-July as softer US inflation data reduced the odds of a near-term Fed hike (TMGM). Even so, the US dollar has retained broad support from escalating Middle East geopolitical tensions, keeping the rupiah’s recovery fragile rather than decisive (TMGM).
Why Growth Forecasts Keep Getting Trimmed
International lenders have grown more cautious about Indonesia’s growth trajectory for 2026. The OECD has held its outlook at 4.7% year-on-year — a clear deterioration from 2025’s realized 5.1% growth — with most major lending institutions clustering around the 5.0% threshold, implying a loss of momentum after Indonesia posted 5.61% growth in the first quarter of 2026 alone (Indonesia Investments). The deceleration is attributed to a softening labor market, weakening consumer confidence, and contracting retail sales in the second quarter (Indonesia Investments). High global oil prices are compounding the pressure on the government’s fiscal balance, since Indonesia continues to subsidize a significant portion of domestically sold fuel — a policy that transmits global energy volatility directly into the state budget rather than shielding consumers from it entirely (Indonesia Investments).
The Deeper Warning: A Confidence Problem, Not Just a Cyclical One
The most pointed recent critique comes from domestic commentary rather than foreign analysts. A Jakarta Post opinion piece published July 20, 2026 argues Indonesia must halt what it describes as erratic policymaking and institutional erosion before the country permanently damages its standing in the “vital game of investor confidence,” framing the rupiah’s weakness and shifting global market conditions as symptoms of a deeper credibility issue rather than purely external shocks (The Jakarta Post). That framing matters for how the strong headline investment numbers should be read: capital is still arriving, but the terms on which it arrives, and the confidence with which it stays, are visibly more fragile than the raw totals suggest.
Strategic Bright Spots
Not every recent development points toward strain. India secured access to Indonesian critical minerals through several major agreements signed during Prime Minister Narendra Modi’s visit to Jakarta, part of a broader push by Indonesia to leverage its resource base for deeper strategic partnerships (Samuel Sekuritas Daily Economic Insights). Indonesia is also pursuing energy independence through B50 biodiesel and compressed natural gas development, aimed explicitly at reducing reliance on imported LPG — a structural move that, if successful, would reduce exactly the kind of imported-energy vulnerability now straining the budget (Samuel Sekuritas Daily Economic Insights).
Key Takeaways
- Indonesia posted a record Rp1,010.6 trillion ($56.1 billion) in H1 2026 investment, up 7.2% year-on-year, with foreign and domestic capital nearly evenly split.
- The rupiah has weakened toward Rp18,000 per dollar on hawkish Fed signals, though a Q2 FDI surge has since provided partial relief.
- International lenders have trimmed Indonesia’s 2026 growth outlook to around 4.7–5.0%, down from 5.1% realized growth in 2025.
- The H1 2026 budget deficit reached 0.76% of GDP, pressured by continued fuel subsidies amid high global oil prices.
- Domestic commentary increasingly frames Indonesia’s challenge as a credibility and policymaking issue, not merely a cyclical external shock.
Sources: Antara News, The Jakarta Post — Investment Growth, The Jakarta Post — Confidence Game, Samuel Sekuritas Daily Economic Insights, Indonesia Investments, TMGM
Discover more from The Economy
Subscribe to get the latest posts sent to your email.
Introduction
The European Council formally extended its economic sanctions against Russia for another full year on 25 June 2026, keeping restrictive measures in place until 31 July 2027 (Council of the EU). More than four years into the war, the headline story of Russia’s economy has shifted from whether sanctions would work to a more nuanced question: how much longer can the Kremlin keep financing the war before the accumulated strain becomes impossible to hide behind favorable official statistics.
The Sanctions Architecture, Renewed Again
The EU’s economic measures against Russia, first introduced in 2014 and dramatically expanded after the February 2022 full-scale invasion, now span trade, finance, energy and dual-use technology restrictions, alongside asset freezes and travel bans on a broad range of individuals and entities (Council of the EU). Since February 2022, the EU has adopted 20 separate sanctions packages, and the European Council has explicitly stated it remains determined to keep weakening Russia’s war economy by further reducing its energy revenues, curbing shadow-fleet oil shipping operations and constraining its banking system (Council of the EU). Separately, on 3 July 2026 the EU sanctioned six individuals connected to the poisoning and death of opposition figure Alexei Navalny, underscoring that the sanctions regime continues to expand on human-rights grounds as well as economic ones (Council of the EU Sanctions Timeline).
The Headline Numbers Beijing-Style Optimism Can No Longer Explain Away
Russia’s GDP is now put at roughly $2.51 trillion, the world’s eleventh-largest economy — comparable in size to South Korea despite Russia’s vastly larger landmass and resource base — with 2026 growth projected at just 1.0% and inflation running at 5.2% (Statistics of the World). More pessimistic estimates put full-year 2026 growth even lower, at around 0.4%, which would be worse than 2025’s already-weak 1% expansion and would mark a sharp deceleration from the 4.1% growth Russia posted in 2023 as it forged new trading relationships to route around initial sanctions (Forbes).
Oil and gas revenues — historically around half of Russia’s state income — have fallen to roughly a quarter, a deliberate outcome of Western sanctions strategy that targets how much Russia earns from exports rather than blocking those exports outright (Stockholm School of Economics/SITE). Russia’s oil and gas budget revenues reportedly halved in January 2026 alone, with crude prices falling below $73 a barrel before the Middle East conflict briefly reversed the trend, sending Brent surging more than 55% to near $120 a barrel at its peak (Forbes).
The Middle East War: A Temporary Lifeline With Long-Term Costs
The spike in oil prices tied to the Iran conflict, combined with a period of eased US sanctions enforcement on Russian oil under President Trump, offered Moscow unexpected fiscal breathing room in mid-2026 (Forbes). But that same conflict has undermined Russia’s longer-term energy diversification ambitions in the region: two Russian-backed power plant projects in Iran have been put on hold, along with oil and gas exploration work and plans to build new transit routes linking Russia to India via Iran (Forbes).
The Gap Between Official Statistics and Underlying Reality
Perhaps the most important analytical point from recent research is not about any single data point but about the reliability of Russian statistics themselves. Torbjörn Becker of the Stockholm Institute of Transition Economics has argued the real test of sanctions is not whether they end the war overnight, but how much they erode the Kremlin’s capacity to finance it — and by that measure, the evidence points to deeper strain than headline GDP figures suggest (Stockholm School of Economics/SITE). Becker notes that Russia’s economy grew only modestly in 2022 despite oil prices rising sharply that year — a gap between expected and actual performance that implies a considerably larger hidden economic hit than the official contraction figures showed (Stockholm School of Economics/SITE). Compounding the problem, Russian authorities have stopped publishing several key statistics since 2022, making independent assessment of inflation, consumption and real economic conditions increasingly difficult — leading Becker to conclude that “statistics have become part of the narrative” rather than a neutral measure of economic reality (Stockholm School of Economics/SITE).
The Military-Civilian Economic Split
A recurring theme across recent analysis is the growing bifurcation between Russia’s overheating military-industrial sector and a stagnating civilian economy. This imbalance has pushed interest rates higher and forced the liquidation of a striking 71% of Russia’s gold reserves to help fund continued war spending (Forbes). Russia’s total fossil fuel export revenue is estimated at roughly €734 million per day, underscoring just how central hydrocarbon income remains to the entire war financing model even as that revenue stream shrinks (Forbes).
The Counter-Narrative: Wages Still Rising
It would be inaccurate to describe Russia’s economy as in freefall. CSIS research notes that Russian salaries rose 17.8% in nominal terms and 8.7% in real terms in 2024 compared to 2023, with disposable incomes up 6.1% in 2023 and 7.3% in 2024 — growth rates not seen in Russia in almost two decades (CSIS). Government budget projections still expect real salaries to rise, albeit at a decelerating pace: 7% in 2025, 5.7% in 2026 and 4.1% in 2027 — a marked slowdown from the 2024 peak but still roughly double the pre-invasion decade average (CSIS). This wage growth, driven substantially by wartime labor shortages and military-adjacent spending, is precisely the kind of headline-stabilizing data point that has allowed Putin to argue publicly that sanctions have failed to cripple his economy (Fortune) — even as think tanks describe the broader trajectory as pushing Russia toward what one report calls an “economic, political, and military abyss” (Fortune).
What Comes Next
Renewed legislative pressure in Washington — including the Sanctioning Russia Act introduced with strong bipartisan support — signals appetite in the US for tightening the screws further, even as the loss of a key congressional champion for that effort has complicated the political path forward (TIME). Whether the EU’s renewed sanctions regime, continued oil price pressure, and constrained reserves ultimately force a shift in Kremlin calculus toward negotiation remains the central open question for 2027.
Key Takeaways
- The EU has extended Russia sanctions for a further year, through 31 July 2027, continuing a regime built from 20 separate packages since 2022.
- Russia’s 2026 GDP growth is forecast between 0.4% and 1.0%, a sharp deceleration from 2023’s 4.1% post-shock rebound.
- Oil and gas revenue’s share of Russian state income has fallen from roughly half to about a quarter as Western sanctions target export earnings specifically.
- Russia has liquidated a large share of its gold reserves to sustain war financing amid a widening split between an overheating military sector and a stagnating civilian economy.
- Official Russian statistics likely understate the true economic strain, according to independent economists who cite a widening gap between reported and expected performance.
Sources: Council of the EU, Council of the EU Sanctions Timeline, Stockholm School of Economics/SITE, Forbes, Statistics of the World, CSIS, Fortune, TIME
Discover more from The Economy
Subscribe to get the latest posts sent to your email.

Pakistan Gulf Investment Outflows 2026: Peace Deal Stakes Explained

Canada Trade Diversification 2026: China, Indonesia, UAE Deals Explained

US Forced-Labour Tariffs on 60 Countries: The Hidden Trade Shock of 2026

Global Central Banks 2026: Fed, BoE and BoJ Decisions Could Reshape Markets

Gulf Capital Retreat From Pakistan 2026: UAE Loan Freeze & What It Means

Pakistan’s Most Reliable Export Is Its People: Remittances Hit $41.6 Billion, Overtaking Total Exports

Indonesia’s Confidence Problem: Record Investment, a Sinking Rupiah, and a Widening Credibility Gap

Down But Not Out: Inside the Slow Sinking of Russia’s War Economy

China’s Growth Slips to a Four-Year Low: Why Beijing Still Won’t Pull the Stimulus Trigger

The Johor-Singapore Corridor: How Malaysia Became Southeast Asia’s AI Infrastructure Powerhouse

Canada’s Economy ‘On Pause’: Inside the CUSMA Deadline That Passed Without a Deal

Dubai’s Millionaire Magnet: How the UAE Turned Middle East Turmoil Into a Capital Safe-Haven Boom

Britain’s Sixth Prime Minister in a Decade: What Starmer’s Exit Means for Gilts, Sterling and Your Portfolio

Anthropic Offers Up to $600,000 Salary for Critical IPO Role as AI Giant Prepares for Wall Street Debut

Carry Trade Unwind 2026: How the Yen’s Snapback Triggered a Global Margin Call

AI Bubble Warning 2026: Why BIS, IMF and Bank of England Fear a Market Crash

BRICS De‑Dollarization Strategy Takes Shape with $15 Billion Local‑Currency Push

The AI Super Bubble Is Ready to Burst

Russia Bans Diesel Exports 2026: Global Fuel Market Impact Explained

Strait of Hormuz Blockade 2026: Oil Prices Surge 9% as US-Iran Conflict Reignites

Private Credit Warning: Most BDCs Turn Unprofitable in 2026, Reuters Finds

Bitcoin $150k Milestone Achieved as US Sovereign Crypto Pivot Looms

IMF Cuts Pakistan Growth Forecast, Raises Inflation to 8.4%
Gulf Capital Retreat From Pakistan 2026: UAE Loan Freeze & What It Means

India Economic Rise 2026: How the Subcontinent Toppled Japan

Strait of Hormuz 2026: Why Markets Still Don’t Trust It’s Open

China Housing Market Turnaround: White‑List Model Stabilises Prices

Chipmakers Just Lost 6.7% in Two Days: Inside the Great AI Trade Rotation
-

 Markets & Finance7 months ago
Top 15 Stocks for Investment in 2026 in PSX: Your Complete Guide to Pakistan’s Best Investment Opportunities
-

 Analysis5 months ago
Johor’s Investment Boom: The Hidden Costs Behind Malaysia’s Most Ambitious Economic Surge
-

 Analysis5 months ago
Top 10 Stocks for Investment in PSX for Quick Returns in 2026
-

 Analysis6 months ago
Brazil’s Rare Earth Race: US, EU, and China Compete for Critical Minerals as Tensions Rise
-

 Banks6 months ago
Best Investments in Pakistan 2026: Top 10 Low-Price Shares and Long-Term Picks for the PSX
-

 Investment7 months ago
Top 10 Mutual Fund Managers in Pakistan for Investment in 2026: A Comprehensive Guide for Optimal Returns
-

 Global Economy7 months ago
15 Most Lucrative Sectors for Investment in Pakistan: A 2025 Data-Driven Analysis
-

 Global Economy7 months ago
Pakistan’s Export Goldmine: 10 Game-Changing Markets Where Pakistani Businesses Are Winning Big in 2025