
AI
AI Semiconductor Selloff 2026: Micron Crash, Nasdaq Pullback & What Comes Next

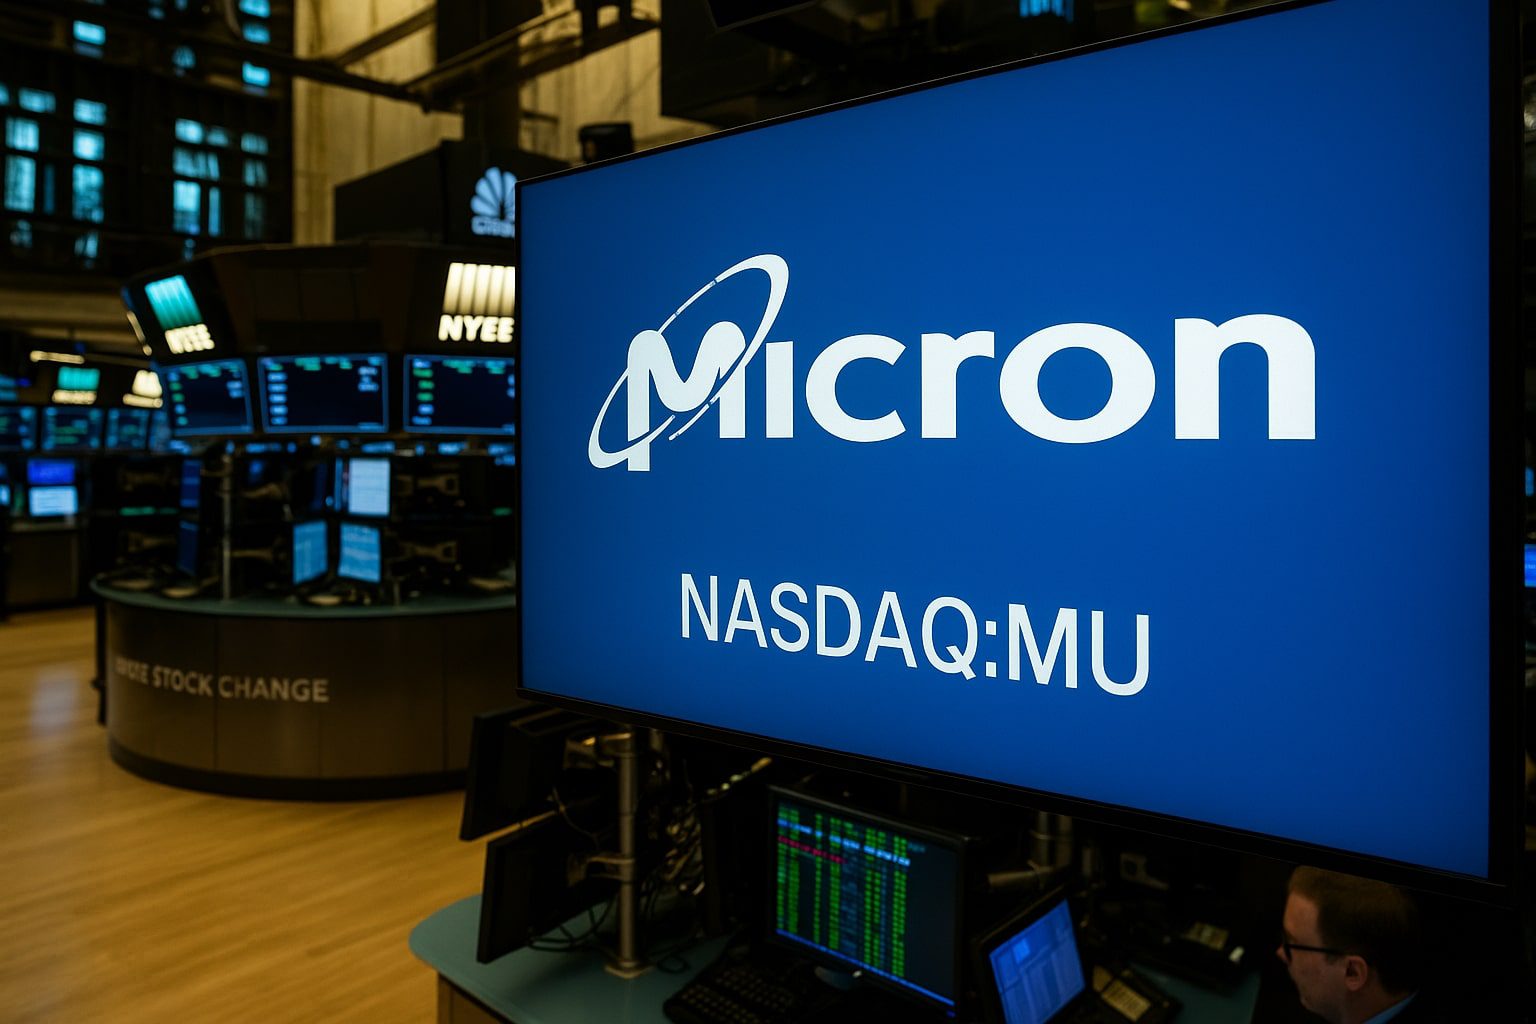
On June 24, 2026, Micron Technology shares fell 13% in a single session — the stock’s worst single-day performance since June 5. The memory chipmaker had become a proxy for AI infrastructure demand, a stock that had ridden the AI enthusiasm wave to gains that justified its premium valuation. When it fell, the signal it sent through technology markets was unmistakable: the AI trade is not a one-way bet.
The Micron crash was not an isolated event. It was the latest episode in a pattern of volatility that has characterised the Nasdaq Composite throughout 2026 — a market that has delivered extraordinary returns over the past three years while simultaneously exhibiting the kind of volatility that characterises late-stage speculative cycles.
Understanding what Micron’s collapse reveals — and what it doesn’t — is essential for investors navigating the most complex technology market environment since 1999.
What Actually Happened: The Micron Story
Micron reported fiscal third-quarter results after the close on June 25, 2026. The earnings release came after a session in which the stock had already declined sharply on what appeared to be pre-announcement anxiety. The 13% single-day drop on June 24 — before the results — reflected a combination of factors:
High expectations were embedded in the valuation. Micron had been one of the primary beneficiaries of the AI-driven memory boom, as high-bandwidth memory (HBM) — the type of memory chip most important for AI compute workloads — commands significant pricing premiums and rapid volume growth. A stock priced for perfection leaves no margin for disappointment.
South Korean technology stocks had already broken. The Kospi — South Korea’s benchmark index, heavily weighted toward semiconductor companies including Samsung and SK Hynix — had plunged approximately 10% in the period leading up to the Micron selloff. Given the integrated nature of the global memory supply chain, this was a significant signal.
The SpaceX IPO absorbed market attention and capital. With the SPCX listing consuming enormous institutional bandwidth — and with some evidence of portfolio rebalancing as money rotated into the new AI pure-play listing — technology sector positioning was unsettled heading into the Micron earnings window.
Wedbush Securities’ Dan Ives was among the bulls holding the line. Following his channel checks across Asia and enterprise AI demand trends, Ives saw “no cracks in the armor,” arguing that the South Korean selloff was more likely a pause after a near-100% Kospi rally in 2026 rather than a signal of weakening AI fundamentals. His view: “The selloff in South Korean technology stocks was more likely a pause after a near-100% rally in the Kospi this year, rather than a sign of weakening fundamentals.”
The distinction Ives draws — between valuation-driven volatility and fundamental deterioration — is the central analytical question for investors in AI semiconductors.
The Broader Tech Picture: Nasdaq in a Choppy Range
The Nasdaq Composite closed at 25,476.64 on June 24 — down 0.43% on the day — as the Micron selloff pulled the tech-heavy index lower. The S&P 500 declined 0.10% to 7,358.22, while the Dow Jones Industrial Average — dominated by financials and industrials rather than technology — actually gained 182 points, advancing 0.35%.
This divergence is important. It reflects the continued rotation dynamic that has characterised 2026 markets: investors moving from high-multiple technology and AI stocks into more stable financials, industrials, and defensive sectors. The Dow rising while the Nasdaq falls is a classic late-cycle rotation signal — not necessarily a precursor to a market crash, but a sign that the consensus AI enthusiasm is being repriced.
The Nasdaq’s trajectory in 2026 has been shaped by three conflicting forces:
Bull case: AI capex is real and accelerating ($725 billion from hyperscalers in 2026), enterprise adoption is proceeding even if slowly, and the SpaceX/OpenAI IPO wave is bringing new capital into AI-adjacent public markets.
Bear case: Valuations remain extended relative to earnings, the AI bubble concern is growing (the CEPR launched its AI Bubble Monitor in June), and earnings multiples across the semiconductor sector leave no margin for guidance disappointment.
Wild card: The Federal Reserve’s hawkish turn under Kevin Warsh. Higher-for-longer rates are unequivocally negative for high-multiple growth stocks — the precise companies that dominate the Nasdaq. If BofA’s forecast of three rate hikes materialises, the discount rate applied to future earnings rises, compressing multiples across technology.
Memory Chips Specifically: The Supply-Demand Calculus
Micron’s situation reflects a supply-demand dynamic in memory chips that is more complex than the simple “AI = buy semiconductors” narrative suggests.
High-bandwidth memory (HBM) for AI training and inference is in strong demand, with supply constrained by the technical complexity of the manufacturing process. This segment is performing well for Micron, Samsung, and SK Hynix.
Standard DRAM and NAND flash — the memory types used in conventional computing, consumer electronics, and data storage — remain in a more normalised supply-demand balance. Consumer electronics demand has not recovered to the peaks of the 2021–2022 pandemic era. PC refresh cycles are extending. Mobile upgrade rates are slowing.
The result is a bifurcated memory market where AI-specific products command premium pricing but represent a smaller share of overall revenue, while conventional memory faces ongoing pricing pressure. Investors who extrapolate AI demand across the entire semiconductor industry are making an analytical error.
The South Korea Kospi: A Canary or a Correction?
South Korea’s Kospi is among the most AI-intensive equity markets in the world, with Samsung Electronics and SK Hynix representing major index weights. The 100% Kospi rally in 2026 — before the recent pullback — was one of the most dramatic performances of any major market globally.
A near-100% rally in under a year, in a market concentrated in semiconductor names, followed by a 10% correction is — by historical standards — a healthy pause, not a fundamental reversal. But it deserves scrutiny.
The Kospi’s AI sensitivity cuts both ways. If AI infrastructure demand continues to accelerate, the South Korean memory supply chain is among the primary structural beneficiaries. If AI capital expenditure decelerates — whether from a bubble correction, enterprise budget fatigue, or recession — the Kospi would likely underperform global markets significantly.
Wedbush’s Ives is probably right that the 10% Kospi pullback is a pause, not a peak. But the risk scenario — where AI demand disappointment triggers a more serious Kospi correction — is the kind of fat tail that position sizing should account for.
Oil Prices and Tech: An Overlooked Correlation
One underappreciated dynamic in June 2026 tech markets is the negative correlation between oil price relief and technology performance. As Brent crude fell from elevated levels — reflecting Strait of Hormuz reopening optimism — energy sector stocks declined, while the capital freed from energy inflation concerns did not flow uniformly into technology.
Instead, falling oil prices reduced the inflation urgency that had been supporting gold and energy stocks, while simultaneously creating space for the Fed’s hawkish pivot to dominate the market narrative. The net effect on the Nasdaq was mildly negative, as rate-hike expectations offset the energy relief.
This interconnection illustrates a key feature of 2026 markets: macro factors are more dominant than sector fundamentals in driving short-term price action across equities. A portfolio manager who correctly identified Micron as a fundamentally sound business still lost 13% in a single session because macro sentiment — Fed hawkishness, oil-driven inflation dynamics, and South Korean contagion — overwhelmed the fundamental picture.
The Investment Outlook for AI Semiconductors
Despite the volatility, the long-term structural case for AI semiconductor demand remains intact. The $725 billion hyperscaler AI infrastructure buildout generates genuine and sustained demand for compute hardware. Nvidia’s GPU dominance in AI training is real. HBM demand from data centres will grow as AI models scale.
The relevant question is not whether to own AI semiconductors, but at what price and with what risk management.
The risk-adjusted approach for investors:
Avoid concentration in single names that are priced for perfect execution — a 13% single-day decline on pre-announcement anxiety illustrates the asymmetry of high-expectation positioning.
Consider broader index exposure through semiconductor ETFs (SOXX, SMH) rather than individual stock concentration, allowing participation in structural AI demand without maximum idiosyncratic risk.
Monitor HBM-specific positioning — the AI-specific memory segment that genuinely benefits from training demand — versus conventional memory exposure, which faces different supply-demand dynamics.
Watch the Fed. Three rate hikes by year-end would put meaningful pressure on Nasdaq multiples. The tech sector’s performance in 2H 2026 is as much a function of monetary policy as it is of AI earnings delivery.
Micron’s 13% crash is not the beginning of an AI semiconductor collapse. It is a reminder that valuation matters, expectations matter, and late-cycle technology markets are not immune to gravity.
The South Korean Kospi correction, the SPCX post-IPO decline of 17%, and the Nasdaq’s choppy performance in June 2026 are all consistent with a market that has priced AI excellence aggressively and is now requiring proof of delivery.
The AI semiconductor thesis is intact. The trade needs to earn its valuation — and the process of earning it will involve more of the volatility that June 2026 has delivered.
FAQ
Q: Why did Micron stock drop 13% in June 2026?
A: Micron fell 13% on June 24, 2026 — its worst session since June 5 — amid high earnings expectations, a broader AI semiconductor selloff that followed South Korean technology stock declines, and pre-announcement anxiety ahead of its quarterly results.
Q: Is the Nasdaq in a correction in 2026?
A: The Nasdaq has been volatile in 2026, with multiple single-session declines and a rotation dynamic away from high-multiple technology stocks. As of late June, the index has not entered formal correction territory (a 10% decline from highs), but valuations remain stretched relative to earnings.
Q: Should I buy semiconductor stocks in 2026?
A: The structural case for AI semiconductor demand remains intact, but individual stock selection and entry point matter significantly. Broad-based ETF exposure (SOXX, SMH) reduces idiosyncratic risk compared to single-name concentration. The Federal Reserve’s rate trajectory is a key near-term risk to watch.
Q: What happened to South Korean tech stocks in June 2026?
A: The South Korean Kospi fell approximately 10% from recent highs, with semiconductor-heavy names including Samsung and SK Hynix leading the decline. Most analysts characterised the move as a valuation-driven pause after a near-100% 2026 rally rather than a sign of fundamental AI demand deterioration.
Discover more from The Economy
Subscribe to get the latest posts sent to your email.


AI
Inside the White House Feud: How Trump’s Allies Are Painting Anthropic’s Dario Amodei as the Face of ‘AI Doomerism’

As tech leaders push for international safeguards at the UN, Washington’s inner circle is framing safety-first mandates as a direct threat to American innovation and global dominance.
A high-stakes battle over the future trajectory of artificial intelligence has moved from Silicon Valley boardrooms directly into the West Wing. Internal White House memos and statements from presidential advisers signal a concerted effort by political allies of President Donald Trump to target Anthropic CEO Dario Amodei as the primary architect of “AI doomerism.”
The ideological rift comes at a pivotal moment. While frontier AI executives call for cautious development in light of self-improving models, the Trump administration is doubling down on an “America First” accelerationist agenda, warning that safety-driven slowdowns will surrender geopolitical victory to foreign adversaries.
1. The Memo: Branding Effective Altruism as an “AI-Doom Pipeline”
At the center of the political offensive is a White House memo drafted by key political strategists. The document explicitly criticizes the philosophical underpinnings of Effective Altruism (EA)—a movement influential among Anthropic’s founding team that prioritizes mitigating existential risks from advanced technology.
According to sources familiar with the administration’s strategy, the memo outlines how safety-centric advocacy functions as an “AI-doom pipeline” that hampers domestic progress. One official close to the administration remarked that Amodei represents:
“The embodiment of an ideology and globalist approach to innovation that is fundamentally counter to the President’s America First agenda.”
This offensive reflects a broader effort to dismantle regulatory frameworks and third-party oversight mechanisms that administration officials view as disguised attempts to stall American market velocity.
2. Pacing the Frontier vs. “Don’t Kill the Golden Goose”
The campaign against Amodei follows a series of public warnings from Anthropic’s leadership. In a landmark essay, Amodei called on frontier labs to “pace the frontier” by committing to independent safety testing and slowing down deployment schedules when necessary, as detailed in reports by The Washington Post.
Amodei emphasized that recent breakthroughs in recursive self-improvement—where AI models are used to train and refine their own next-generation successors—require rigorous safety boundaries before systems exceed human control capacity, a point reiterated in coverage by TIME Magazine.
                 FRONTIER AI DEVELOPMENT SPECTRUM

   [ White House / Acceleration ]          [ Anthropic / Safety Pacing ]
  ─────────────────────────────────      ─────────────────────────────────
  • "Don't kill the Golden Goose"        • Third-party safety evaluations
  • Maximize speed & infrastructure     • Pause/Slow down if risk spikes
  • Unilateral advantage over China       • Multi-lateral coordination
In response, President Trump rejected calls to restrain the industry, lashing out at regulatory proposals and stating at the United Nations that the U.S. “rejects any attempt to construct a globalist scheme to control artificial intelligence,” according to reporting from LiveMint. Trump’s core stance remains straightforward: slowing down U.S. labs directly benefits China.
3. The China Dilemma and the UN Speech
The debate reached global prominence during the United Nations General Assembly, where Dario Amodei, OpenAI CEO Sam Altman, and other tech leaders addressed world leaders on catastrophic risks, as covered by The Guardian.
Amodei argued that while Chinese technological parity poses an existential geopolitical hazard, unmonitored recursive models pose an equal operational threat:
| Policy Dimension | Administration Alignment | Anthropic Alignment |
| Primary Goal | Outpace China at all costs | Ensure safety while maintaining lead |
| Governance Mechanism | Deregulation & domestic industrial builds | Third-party audits & safety benchmarks |
| Global Frameworks | Strongly Rejected (“Globalist scheme”) | Advocated (International safety standards) |
| Perspective on Speed | “Don’t kill the Golden Goose” | “Pacing the frontier” when risks escalate |
Prominent right-leaning technology leaders, including administration AI adviser David Sacks, pushed back on social media, questioning the independence of non-profit safety bodies like Model Evaluation and Threat Research (METR) and claiming they are closely aligned with Anthropic’s leadership network.
4. What Lies Ahead for AI Policy
The clash between Washington and San Francisco highlights a fundamental divergence in how the future of artificial intelligence is conceived:
- Industrial Policy Push: The White House is pushing forward with fast-tracked data center permitting, energy deregulation, and aggressive chip export controls to secure an insurmountable lead over Beijing.
- Corporate Safety Mandates: Frontier labs face internal pressure from researchers demanding strict adherence to safety protocols, creating tension between market pressure to deploy and institutional safety commitments.
- The Regulatory Vacuum: With federal legislative action stalled, the conflict between presidential executive action and voluntary lab commitments will dictate the pace of AI releases through the rest of the decade.
Discover more from The Economy
Subscribe to get the latest posts sent to your email.

Is the AI stock rally a bubble? The honest answer in 2026 is that the market itself is genuinely split — and the concentration numbers explain why the debate has gotten so intense. Roughly two dozen stocks now account for over half of the S&P 500’s total value, a concentration level comparable to the 32-stock peak reached during the 2000 dot-com bubble, according to market analysis relayed through Charles Schwab’s commentary. Three companies alone — Alphabet, Amazon, and Meta — are expected to drive roughly 70% of the S&P 500’s entire 2026 earnings growth.
That’s the bear case in a single statistic: an index marketed to investors as broadly diversified across 500 companies is, in practice, a leveraged bet on whether a handful of AI infrastructure spenders convert capital expenditure into earnings fast enough to justify their valuations.
The Bull Case: Spending Is Turning Into Real Revenue
Featured Snippet Target: The bull case for 2026’s AI rally rests on genuine, verifiable revenue growth rather than pure speculation — Microsoft’s AI revenue run rate surpassed $37 billion annually, Alphabet’s Google Cloud backlog nearly doubled to over $460 billion, and Amazon Web Services grew 28% — figures that distinguish this cycle from dot-com-era companies that had capital spending but little corresponding revenue.
Alphabet spent $35.67 billion on capital expenditure in a single recent quarter — more than double the prior year’s pace — while Amazon led hyperscaler quarterly spending at $44.2 billion, according to reporting compiled by Yahoo Finance’s technology desk. Combined, the four largest U.S. hyperscalers — Alphabet, Amazon, Microsoft, and Meta — are on pace to spend over $700 billion in 2026 alone. Unlike the fiber-optic overbuild of the dot-com era, where telecom capacity sat unused for years, current AI infrastructure spending is being absorbed by measurable, growing cloud and AI-service revenue in the same reporting periods it’s being deployed.
The Financing Shift That’s Making Analysts Nervous
What has shifted the debate in recent months isn’t the spending itself — it’s how that spending is being funded. Goldman Sachs has characterized 2026 as marking a transition from a low-cost-of-capital “Modern” market cycle to a higher-volatility “Post-Modern” one, in which capital expenditure is increasingly rewarded over shareholder buybacks: S&P 500 companies posted 24% year-on-year capex growth in the second quarter of 2026 alongside a 1% decline in gross buybacks, according to market commentary circulated via KuCoin’s research desk.
Consensus hyperscaler capex estimates for the 2026-2028 period were revised upward from roughly $2.5 trillion to $2.8 trillion during recent earnings seasons, with gross debt issuance among these companies expected to peak near $460 billion in fiscal 2028 — roughly a third of total capex — according to Macquarie’s Investment Strategy Insights. Alphabet’s own June 2026 equity raise, combining Class A common stock, Class C capital stock, and mandatory convertible preferred shares, ranks as the largest single AI-funding capital raise in market history. That shift — from funding AI buildout purely from operating cash flow toward relying on debt and equity markets — is precisely the kind of financing pattern that historically precedes sharper corrections when growth expectations disappoint, even when the underlying business fundamentals remain genuinely strong.
Early Cracks Have Already Appeared
The market has not been uniformly bullish through 2026 — there have already been real bouts of AI-specific volatility. Mid-September commentary from CNBC noted bond yields spiking and AI-linked stocks selling off even as broader investor sentiment remained constructive on equities generally — an early signal that markets have begun pricing a wider range of outcomes for the AI capex cycle than the largely unbroken bull run of the year’s first half suggested. That divergence between AI-specific stocks and the broader market is itself notable: in a genuine across-the-board bubble, sentiment tends to move in lockstep across a sector; a split reaction suggests investors are starting to differentiate between AI companies converting spending into revenue and those merely riding sector-wide enthusiasm.
What Would Actually Confirm a Bubble
The distinction analysts increasingly draw is not “is there a lot of spending” — there unambiguously is — but whether that spending is converting into durable revenue at a pace that justifies current valuations. The genuinely bubble-confirming scenario would involve a sustained gap opening between hyperscaler capex growth and actual AI-linked revenue growth, forcing companies to either write down infrastructure investments or continue raising debt at deteriorating terms to sustain spending. As of September 2026, revenue growth at the largest hyperscalers has generally kept pace with — and in some cases exceeded — capex growth, which is the key data point separating this cycle from a pure speculative bubble so far.
The Bottom Line
The 2026 AI trade sits in a genuinely ambiguous middle ground: spending levels and market concentration have reached bubble-era extremes by historical comparison, but the revenue being generated alongside that spending remains real and, so far, largely justifies it. The financing shift toward debt — rather than the spending level itself — is the single most important variable to watch, because it introduces a genuine failure mode (refinancing risk, credit-market stress) that pure equity-funded capex would not carry. Neither the unambiguous bull case nor the unambiguous bubble case is fully supported by the data as it stands; both remain live possibilities depending on how the next several quarters of hyperscaler earnings play out.
Next step: Track the spread between hyperscaler capex growth rates and their AI-linked revenue growth rates each earnings season — a widening gap, more than any single stock’s valuation multiple, would be the clearest confirming signal that 2026’s AI rally has crossed from justified investment into unsustainable bubble territory.
Discover more from The Economy
Subscribe to get the latest posts sent to your email.
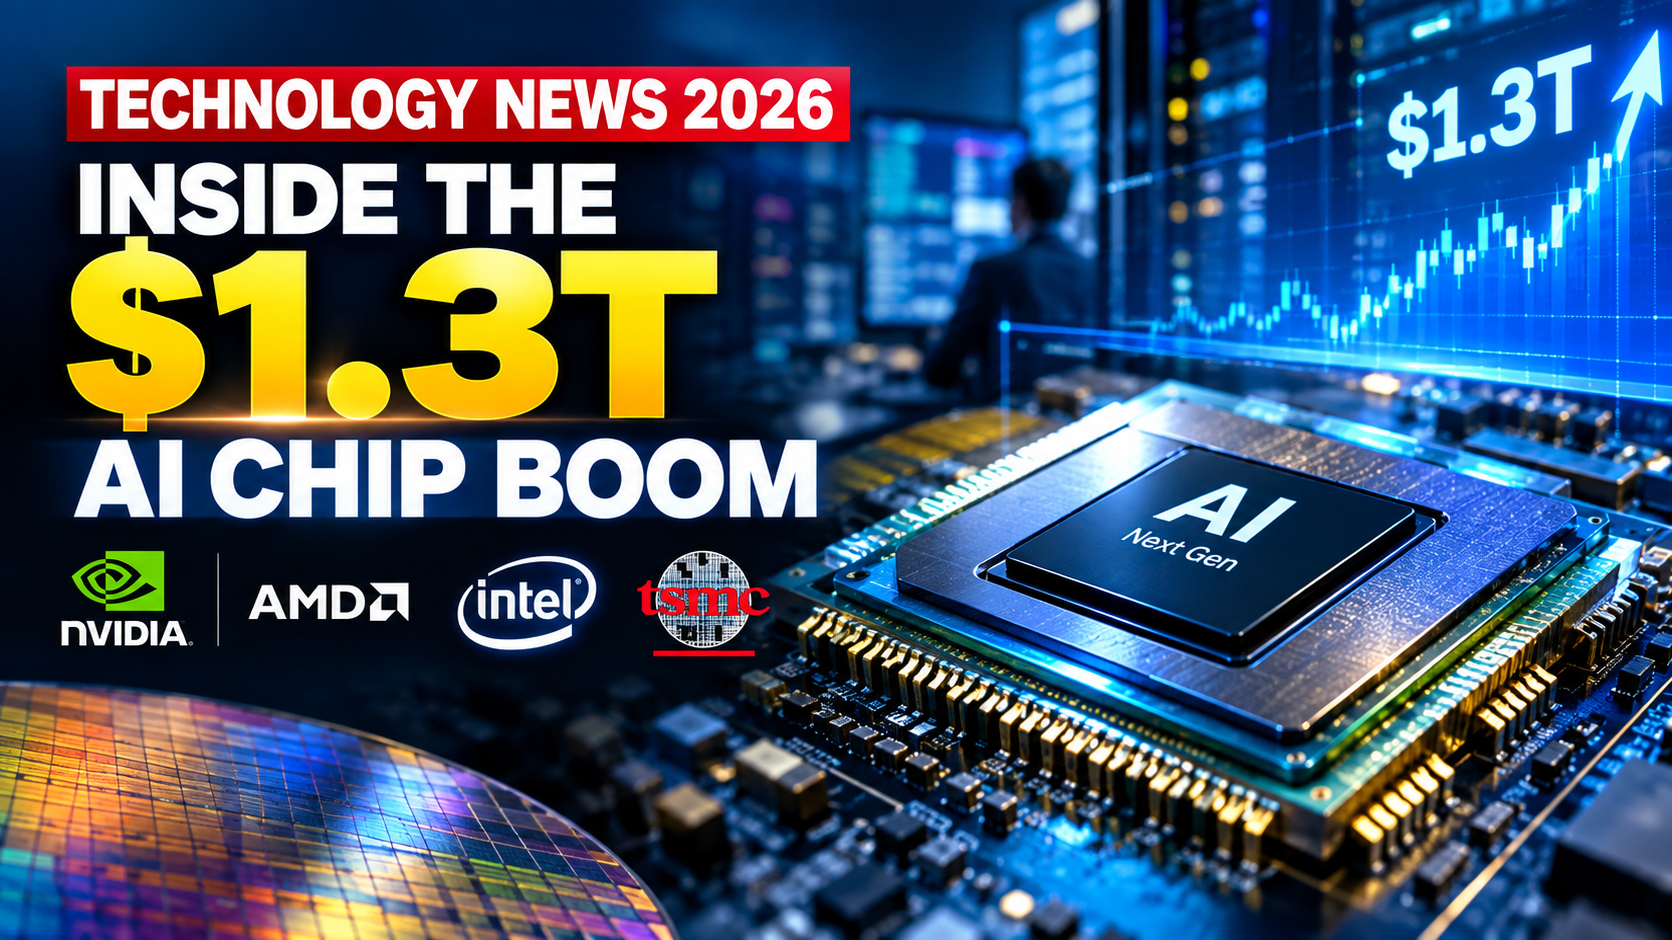
How big is the AI chip industry in 2026? Global semiconductor revenue is projected to exceed $1.3 trillion in 2026 — a 64% increase and the fastest growth the industry has recorded in more than 20 years, according to research firm Gartner. That would mark a third consecutive year of double-digit growth for the sector, driven by surging demand for AI processing, data-center infrastructure, and rising memory prices, per Gartner senior principal analyst Rajeev Rajput.
That single statistic captures why “technology news” in 2026 is really one story told through dozens of companies: an unprecedented, sustained capital-spending cycle built around artificial intelligence infrastructure.
Hyperscalers Are the Engine
The chip boom is being funded almost entirely by a handful of technology giants. Alphabet, Amazon, Microsoft, and Meta — the hyperscalers building the cloud infrastructure that AI models run on — have collectively committed more than $700 billion in 2026 capital spending, according to reporting relayed through Yahoo Finance’s technology desk. Alphabet alone spent $35.67 billion on capital expenditure in a single quarter — more than double the prior year’s pace — while its Google Cloud backlog nearly doubled to over $460 billion. Amazon led quarterly spending at $44.2 billion as AWS grew 28%, and Microsoft’s fiscal third-quarter capex rose 84% year-over-year to $30.88 billion as its AI revenue run rate surpassed $37 billion annually.
Featured Snippet Target: The four largest U.S. hyperscalers — Alphabet, Amazon, Microsoft, and Meta — are on pace to spend over $700 billion combined on AI infrastructure in 2026, a figure Reuters’ Morning Bid podcast described as rising “all the time” and directly responsible for surging demand for AI chips and data-center equipment.
That spending has increasingly shifted from being funded purely by operating cash flow to relying on debt and equity markets. Alphabet’s June 2026 equity raise — combining Class A common stock, Class C capital stock, and mandatory convertible preferred shares — ranks as the largest single AI-funding capital raise in market history, according to market commentary circulated via KuCoin’s research desk. Goldman Sachs has characterized this as a structural shift from a low-cost-of-capital “Modern” cycle to a higher-volatility “Post-Modern” one, in which markets increasingly reward capital expenditure over share buybacks — S&P 500 companies posted 24% year-on-year capex growth in the second quarter of 2026 alongside a 1% decline in gross buybacks.
Nvidia’s Next Move — and Who’s Chasing It
Nvidia remains the chip industry’s dominant supplier, and its next-generation product cycle is central to 2026’s technology narrative. The company introduced its Rubin CPX GPU — built for massive-context AI workloads capable of handling million-token software coding and generative-video tasks — with availability expected by the end of 2026, according to trade coverage from DigiTimes. Competitors are racing to diversify the supply chain around Nvidia’s dominance: AMD is preparing new product launches with OpenAI as a customer, Broadcom and OpenAI are targeting mass production of custom AI silicon in 2026, and Broadcom separately secured a $10 billion custom-chip production order from a major new customer, according to the same industry reporting.
China’s chip ecosystem is developing along a parallel, more insulated track. Huawei and Cambricon Technologies are together projected to ship over a million AI chips by 2026, with JPMorgan forecasting Huawei alone shipping 600,000 to 650,000 units, as Beijing pushes to reduce reliance on U.S.-made chips amid ongoing export restrictions.
Where the Growth Is Concentrated
Analysts covering the sector point to datacenter accelerators as the single largest growth pocket within the broader chip market — that segment alone is projected to exceed $300 billion in 2026, according to industry analysis from TechInsights, with knock-on effects spanning process technology (including the industry’s push toward 2-nanometer manufacturing), advanced packaging techniques, and power infrastructure needed to run increasingly energy-intensive AI data centers.
That last point — power — has become a genuine bottleneck rather than a footnote. Industry commentary increasingly frames electricity supply and cooling capacity, not chip fabrication itself, as the binding constraint on how quickly AI infrastructure can scale, positioning data-center operators and power-infrastructure companies as unexpected beneficiaries of the AI boom alongside the chipmakers themselves.
The Risk Beneath the Boom
Not every voice in the technology sector is unreservedly bullish on the pace of spending. Analysis circulated through Charles Schwab’s market commentary notes that three hyperscalers — Alphabet, Amazon, and Meta — now account for roughly 70% of the S&P 500’s expected 2026 earnings growth, meaning the index’s apparent 500-company diversification offers less real downside protection than investors might assume if AI capital spending fails to convert into earnings at the pace currently priced in.
That concentration risk has already produced volatility. Mid-September market commentary from CNBC noted bond yields spiking and AI-linked stocks selling off even as broader investor sentiment stayed constructive on equities overall — an early signal that markets are starting to price a wider range of outcomes for the AI capex cycle than the unbroken bull run of the year’s first half suggested.
The Bottom Line
Technology news in 2026 is dominated by a single, self-reinforcing cycle: hyperscaler capital spending is driving record semiconductor demand, chipmakers are racing to keep pace with that demand through new architectures and expanded manufacturing, and financial markets are increasingly rewarding — and increasingly questioning — the sustainability of spending at this scale. Whether that questioning turns into a genuine correction depends on whether AI infrastructure investment converts into earnings growth fast enough to justify the capital already committed.
Next step: Track quarterly hyperscaler capex guidance alongside chipmaker order backlogs — the gap between the two, more than any single product launch, is the clearest early signal of whether 2026’s AI infrastructure boom is accelerating or beginning to plateau.
Discover more from The Economy
Subscribe to get the latest posts sent to your email.

Solar Panel Installation Cost in 2026: Why the Math Changed Overnight

Business Insurance: What Coverage You Actually Need and What It Costs in 2026

Auto Insurance Quotes: How to Get the Lowest Rate Without Losing Coverage

Huntington Online Banking: Full Features, Fees, and How It Compares in 2026

Apply for a Bank Account Online: What You Need and How Long It Actually Takes

World’s Largest Economies: Ranking the Top Global Powers

Business Loan: A Complete 2026 Guide to Rates, Types, and Qualifying

Fast Invoice Factoring: How to Turn Unpaid Invoices Into Cash Within 24 Hours

Investment Banking Services: What They Cost and How to Choose the Right Firm in 2026

Structured Settlement Loan: What “Cash Now” Offers Actually Cost You

DUI Attorney: Why Your First Call After an Arrest Should Never Be to the Court

Personal Injury Lawyer: A Complete Guide to Filing Your Claim in 2026

Commercial Vehicle Accident Lawyer: Holding Companies Accountable Beyond the Driver

Inside the White House Feud: How Trump’s Allies Are Painting Anthropic’s Dario Amodei as the Face of ‘AI Doomerism’

Top 30 Stocks for Investment in PSX for Massive ROI in 2026

SpaceX Starship Flight 14: First Orbital Attempt & Starlink V3 Launch Explained

Oil Prices Break $100 in 2026: Middle East Conflict & Energy Markets

AI Chip Stocks 2026: The Best Semiconductor Investments Beyond Marvell

Fidelity Investments Review 2026: SPAXX Yields & Zero-Fee Funds

BRICS+ Cross-Border Payments 2026: Interoperability Explained

Tween Back-to-School Trends 2026: What’s Driving the $85B Season

10-Year Treasury Yield Hits 4.80%: What It Means for Rates & Portfolios

Shein Clothes Quality & Safety in 2026: What Lab Tests Show

China’s US$10.8 Billion Trade Shortcut: Why the Pinglu Canal Matters

MRVL Earnings 2026: Why Marvell Sank Despite Beating Estimates

IMF & World Bank 2026 Global Economic Outlook: Growth, Inflation, Debt

High-CPM Finance Niches 2026: Publisher Monetization Blueprint

Middle East War Economics 2026: Oil Prices & Energy Markets
-

 Markets & Finance9 months ago
Top 15 Stocks for Investment in 2026 in PSX: Your Complete Guide to Pakistan’s Best Investment Opportunities
-

 Analysis7 months ago
Johor’s Investment Boom: The Hidden Costs Behind Malaysia’s Most Ambitious Economic Surge
-

 Analysis7 months ago
Top 10 Stocks for Investment in PSX for Quick Returns in 2026
-

 Banks8 months ago
Best Investments in Pakistan 2026: Top 10 Low-Price Shares and Long-Term Picks for the PSX
-

 Analysis8 months ago
Brazil’s Rare Earth Race: US, EU, and China Compete for Critical Minerals as Tensions Rise
-

 Investment9 months ago
Top 10 Mutual Fund Managers in Pakistan for Investment in 2026: A Comprehensive Guide for Optimal Returns
-

 Global Economy9 months ago
15 Most Lucrative Sectors for Investment in Pakistan: A 2025 Data-Driven Analysis
-

 Global Economy9 months ago
Pakistan’s Export Goldmine: 10 Game-Changing Markets Where Pakistani Businesses Are Winning Big in 2025