
International Trade
Pakistan Exports 2026: Record $35.6B Forecast Masks Trade Deficit Risk

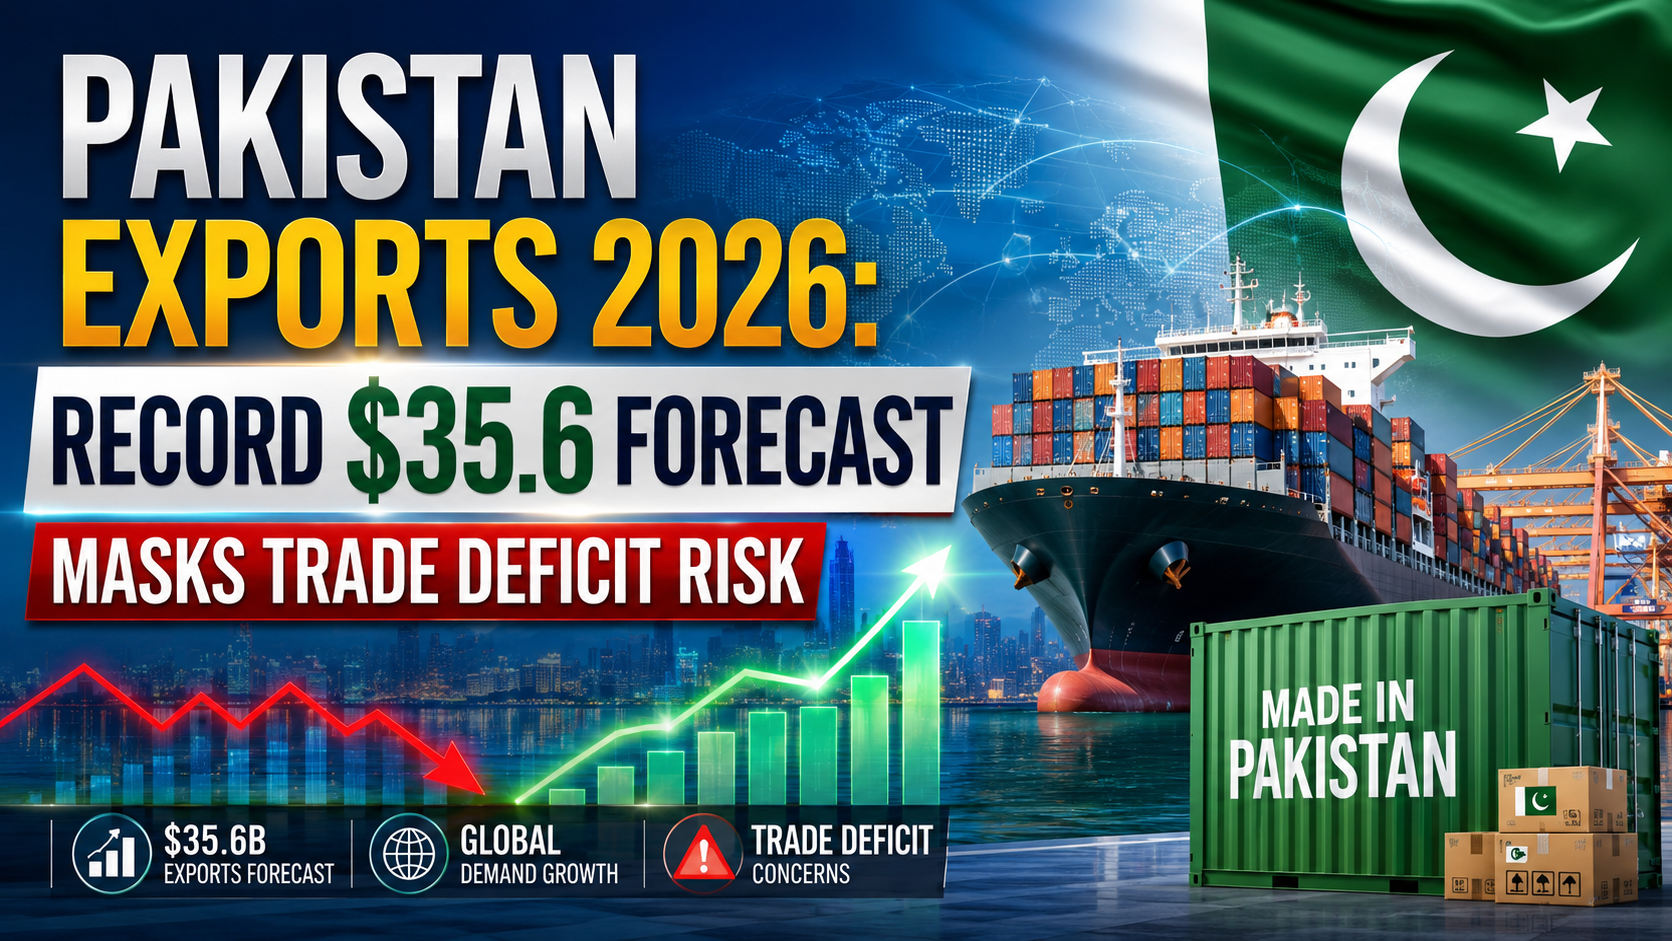
Pakistan opened its new fiscal year with its strongest July export performance on record, and the IMF is projecting the country’s best-ever full-year export total for FY27. Beneath that headline, though, the numbers show an external sector still leaning heavily on financing rather than genuine competitiveness.
According to Ministry of Commerce data cited by Global Textile Times, Pakistan’s total exports reached $2.96 billion in July 2026, a 10% increase over the $2.69 billion recorded a year earlier. Imports rose a more modest 5% to $4.62 billion, allowing the country to post a narrower trade deficit for the month relative to the pace of export growth — a rare piece of unambiguously good news for a country that has spent much of the past two years managing external account stress.
The IMF’s Record Forecast
The momentum has fed into a bullish official outlook. The IMF now estimates Pakistan’s exports will climb to a record $35.63 billion in the fiscal year beginning July 1, 2026 — up sharply from an estimated $31.93 billion in the year just ended, according to figures reported by ProPakistani. If realised, that would mark the strongest annual increase in Pakistan’s export earnings in recent years, built on a recovery in textile shipments, stronger IT exports and improved access to foreign markets.
The Number the Headlines Miss
But the same IMF projections carry a less flattering companion figure: import growth is expected to outpace export growth in percentage terms, meaning Pakistan’s trade deficit is forecast to widen even as exports hit a record. That is not a hypothetical risk — it is already showing up in the most recent full-year data.
A detailed roadmap published by Pakistan Today lays out the scale of the problem: Pakistan’s trade deficit widened by 25% in FY26, expanding from $26.96 billion to $33.66 billion, even as the State Bank of Pakistan reported foreign exchange reserves strengthening to $18.4 billion — driven largely by IMF financing and workers’ remittances rather than by trade performance itself. Foreign direct investment, meanwhile, fell 24% over the same period, undercutting the case that global investors see Pakistan’s growth story as self-sustaining.
The report is unambiguous about what this combination means: “Pakistan’s financial stability cannot continue to depend on IMF support, workers’ remittances, and external borrowing alone,” the analysis states, even as it notes IMF projections suggest reserves could reach $21 billion by FY27 — an improvement the report characterises as “primarily financing-driven rather than export-led.”
Textiles: Growth Engine or Growth Ceiling?
Textiles remain the backbone of Pakistan’s export economy, generating the overwhelming majority of shipments to the United States, according to comments from Pakistan’s Ambassador to the US, Rizwan Saeed Sheikh, at the Texworld New York trade show, reported by Dawn. Five Pakistani manufacturers — including A1 Infinity, MRI Group, Hometex Corporation, Ruqi Sports and Niza Sports — showcased home textiles, apparel, leather garments and sportswear to US and international buyers at the Jacob K. Javits Convention Centre.
Yet the sector’s full-year trajectory has been closer to stagnation than triumph. Textile and clothing exports for FY26 reached just $17.93 billion, a marginal 0.26% increase over the prior year’s $17.88 billion, according to data compiled by Global Textile Times. Official figures show merchandise exports missed their annual target by $4.87 billion — a gap that underscores how far the “record forecast” narrative still has to travel before it becomes reality on the ground.
What the IMF’s Country Review Shows
Pakistan’s broader macro picture, as laid out in the IMF’s most recent country report, adds further texture. GDP growth in the first half of FY26 averaged 3.8% year-on-year despite July–August flooding, driven by the auto, construction and garment industries. But the same review flags structural revenue weaknesses that constrain the government’s room to manoeuvre: the GST C-efficiency ratio has fallen from 27.4% to 22.8% over the past decade, petroleum products are taxed at an effective rate of 166%, and roughly three-quarters of the theoretical GST base remains untaxed due to exemptions and provincial fragmentation.
The Fund also noted Pakistan missed a structural benchmark on adopting international governance standards for its Sovereign Wealth Fund by end-March 2026, though the required amendments remain pending Cabinet approval — a reminder that programme compliance, not just export volume, will shape the pace of continued IMF disbursements.
The Diversification Push
Beyond textiles, Pakistan’s July export growth also drew support from agricultural shipments — rice and processed food maintained market share — alongside early signs of diversification into specialised manufacturing and engineering goods, according to the Global Textile Times report. Government officials frame this as evidence of a broadening industrial base, though the scale remains small relative to textiles’ dominant share of total exports.
Separately, the textile industry’s own roadmap calls for a shift toward higher-value products — smart textiles, antimicrobial fabrics, fire-resistant fabrics and recycled fibres — arguing that closer collaboration between universities, research institutions and manufacturers is needed to escape a decade of stagnant per-unit export values.
Pakistan’s July export figures and the IMF’s record FY27 forecast are genuinely positive data points after a difficult multi-year stretch. But the same set of official numbers shows a trade deficit projected to widen, FDI still declining, and reserve growth that owes more to financing than to trade competitiveness. For a country whose last two IMF programmes were both triggered by external account crises, the distinction between record exports and a resilient external position is not academic — it is the difference between durable stability and another financing-dependent reprieve.
Discover more from The Economy
Subscribe to get the latest posts sent to your email.


Interest Rate Policy
How Rising Interest Rates Impact Gig Economy Apps: DoorDash, Uber, and Urban Services
The Fed hiked to 3.75%-4% with gas above $4. See how rates, fuel and consumer spending transmit into DoorDash unit economics and gig platform margins.The standard model says rising rates hurt gig platforms because they are long-duration growth assets and because discretionary spending contracts. Both halves of that model are currently being contradicted by the data.
Executive Summary / Key Takeaways
- The Federal Reserve raised rates to 3.75%–4.00% on 16 September 2026, with 16 of 18 FOMC participants projecting at least one more hike this year.
- The transmission into gig platforms runs through three channels, and only one is the discount rate: consumer discretionary spending, courier input costs, and the cost of capital for long-duration investment.
- DoorDash guided take rate to decline in Q4 2026 on seasonal Dasher cost increases, an insurance step-up and higher winter delivery complexity — margin compression that is structural, not cyclical.
- The company absorbed a gross cost of over $50 million for a Dasher gas relief programme in Q2 2026, a direct macro-to-margin transfer with national pump prices above $4 a gallon.
- The counterintuitive finding: DashPass subscriptions grew more in twelve months than the prior twenty-four combined, suggesting convenience platforms may function as household cost-management tools rather than pure discretionary spend.
The Fed raised its target range by a quarter point to 3.75%–4.00% on 16 September 2026, describing economic activity as expanding at a solid pace with domestic spending resilient, productivity growth strong and capital investment robust, while noting that inflation remains elevated. Sixteen of eighteen participants expect at least one further increase before year-end.
Yet on the day of the hike, the Dow fell more than 600 points while the Nasdaq finished close to flat, with the damage concentrated in cyclicals, transport and energy-exposed names — J.B. Hunt Transport fell 12.64% on an earnings warning citing rising operating costs — according to market coverage. The rate-sensitive damage landed on physical logistics, not on technology platforms.
For gig economy analysis, that is the tell. The binding constraint in 2026 is not the discount rate. It is the cost of moving things.
2. Core Analysis: Three Transmission Channels
2.1 Channel one — courier input costs
This is the dominant channel and the most direct.
DoorDash anticipated the gross cost of its Dasher gas relief programme at over $50 million for Q2 2026, expecting to fund it at least partly by adjusting investment elsewhere, per its Q1 disclosure. That is a macro variable landing straight on the income statement: the national average for regular gasoline was $4.329 a gallon on 15 September 2026, against $3.14 a year earlier.
The seasonal effect compounds it. Management guided take rate to remain flattish in Q3 before declining in Q4 due to seasonal increases in Dasher costs, an insurance step-up and higher delivery complexity during winter months, per the earnings call summary.
Translated for investors: courier supply is price-elastic, weather-sensitive and fuel-cost-exposed, and the platform absorbs the gap rather than fully passing it to consumers. Rising rates do not cause this. Rising energy prices do — and the same energy shock is what drove the Fed to hike, which is why the two appear correlated.
2.2 Channel two — consumer discretionary spending
Here the data contradicts the thesis.
In Q2 2026, DoorDash grew total orders 27% year-on-year to 970 million, Marketplace GOV 36% to $33.1 billion and revenue 36% to $4.45 billion — 17%, 23% and 24% respectively excluding the Deliveroo acquisition, per company results. US paid DashPass members increased more in the twelve months through Q2 2026 than in the previous twenty-four months combined.
Subscription penetration accelerating during a period of elevated food and fuel inflation is not the behaviour of a discretionary category under pressure. Management’s stated logic is that membership reduces transactional friction through affordability, driving retention and engagement. The plausible reading is that for a meaningful cohort, a delivery subscription functions as a cost-management instrument — a fixed fee that caps variable delivery expense — rather than as a luxury.
2.3 Channel three — cost of capital for long-duration bets
| Metric | Q2 2026 | Signal |
|---|---|---|
| Adjusted EBITDA | $914m (+40%) | Core profitability strong |
| GAAP net income | $200m (-30%) | Legal and regulatory expense drag |
| Operating cash flow | $944m (from $504m) | Self-funding capacity improving |
| 2026 stock comp | $1.2–1.3bn | Dilution cost of talent retention |
| 2026 D&A | $1.1–1.2bn | Including ~$450m acquired intangibles |
With operating cash flow at $944 million in a single quarter, DoorDash is largely self-funding its autonomy, AI and infrastructure investment. Higher rates raise the opportunity cost of that spending but do not gate it. The platforms that higher rates genuinely constrain are the sub-scale, cash-burning ones — and the rate environment therefore accelerates consolidation toward the profitable incumbents rather than damaging them.
3. Structural Drivers and Competitor Gaps
The correlation most analyses get backwards. Fed funds and gig platform margins are correlated in 2026, but not causally in the direction usually assumed. Both are downstream of the same energy shock: elevated crude drove gasoline up 27.4% year-on-year in the August CPI, which drove headline inflation, which drove the Fed to hike, and independently drove courier fuel costs up. Modelling gig margins as a function of the policy rate will produce a fitted relationship with no predictive validity once energy normalises.
Autonomy is a rate-environment bet. DoorDash Dot is expected to reach high single-digit penetration in test markets by year-end, scaling from Phoenix. If seasonal courier cost inflation is the recurring drag on Q4 take rate, autonomous capacity attacks that line directly. Higher-for-longer rates raise the hurdle rate on that investment while simultaneously increasing its payoff — which is why the company is accelerating rather than deferring it.
The regulatory tail risk is larger than the rate risk. DoorDash’s filing names an unresolved California Employment Development Department audit over payroll-tax liabilities tied to Dasher classification, with an amount accrued and resolution uncertain, per the 10-Q. GAAP net income fell 30% partly on higher legal and regulatory expenses. A classification ruling would reprice unit economics sector-wide in a way no plausible rate path would.
Consolidation is the visible second-order effect. DoorDash completed its Deliveroo acquisition in October 2025 for $3.72 billion. In a higher-rate environment, platforms with positive operating cash flow acquire those without it. The gig sector’s competitive structure in 2027 will be shaped more by that dynamic than by demand.
4. Key Implications for Stakeholders
Tech equity investors. Strip the acquisition before modelling — 24% organic revenue growth against 36% headline is the number the multiple should reflect. Then treat Q4 take rate against guidance as the cleanest available test of whether courier cost inflation is cyclical or permanent.
Consumer analysts. Subscription growth during an inflation squeeze is the most interesting datapoint in the sector. If delivery membership is behaving as a household hedge rather than a luxury, the standard discretionary-spending framework misclassifies the entire category.
Gig workers. Fuel relief programmes are discretionary platform spending, funded by reallocating investment elsewhere. They are not contractual, and they are most likely to be trimmed precisely when platform margins compress — which is Q4.
Policy analysts. The combination of an energy shock, a tightening cycle and an unresolved worker-classification case creates unusual conditions for gig regulation. Rising courier costs strengthen the platforms’ argument for flexibility and the workers’ argument for guaranteed earnings simultaneously.
5. Frequently Asked Questions
Q1: Do higher interest rates hurt gig economy apps?
Less directly than assumed. The larger 2026 pressure is energy costs feeding into courier pay — DoorDash spent over $50 million gross on Dasher gas relief in one quarter — while its core profitability and subscription growth both accelerated despite tightening.
Q2: Why is DoorDash’s take rate expected to fall in Q4?
Management cited seasonal increases in Dasher costs, an insurance step-up and higher delivery complexity during winter months. Courier supply is weather- and price-sensitive, and the platform absorbs the cost gap rather than fully passing it to consumers.
Q3: Is consumer spending on delivery falling with rates?
Not on current data. DoorDash grew orders 27% year-on-year to 970 million in Q2 2026, and US paid DashPass members grew more in twelve months than in the prior twenty-four combined.
Q4: What is the biggest risk to gig platform economics right now?
The unresolved California worker-classification audit, which carries payroll-tax implications that would affect the entire sector’s cost structure — a larger exposure than any plausible interest-rate path.
Discover more from The Economy
Subscribe to get the latest posts sent to your email.
Global Economy
Beyond Rhetoric: How the EU Is Deploying ‘All Tools’ to Rebalance Its €1 Billion-a-Day Trade Deficit with China
Key Takeaways
- The Tipping Point: European Commission President Ursula von der Leyen has declared that Europe’s trade deficit with China has reached an “unsustainable” €1 billion per day, pushing bilateral trade relations to a historical tipping point.
- Enforcement Over Engagement: Signaling a fundamental shift in doctrine, von der Leyen issued a direct ultimatum: “Words are good. But deeds are better.”
- The Defensive Arsenal: Brussels is escalating beyond traditional anti-dumping tariffs, actively deploying the Foreign Subsidies Regulation (FSR), the International Procurement Instrument (IPI), and establishing a centralized European Critical Raw Materials Corporation under the RESourceEU framework.
- Supply Chain Exposure: European and Asian enterprises face heightened compliance scrutiny, potential market access restrictions, and supply chain realignment risks across green-tech, automotive, and critical mineral sectors.
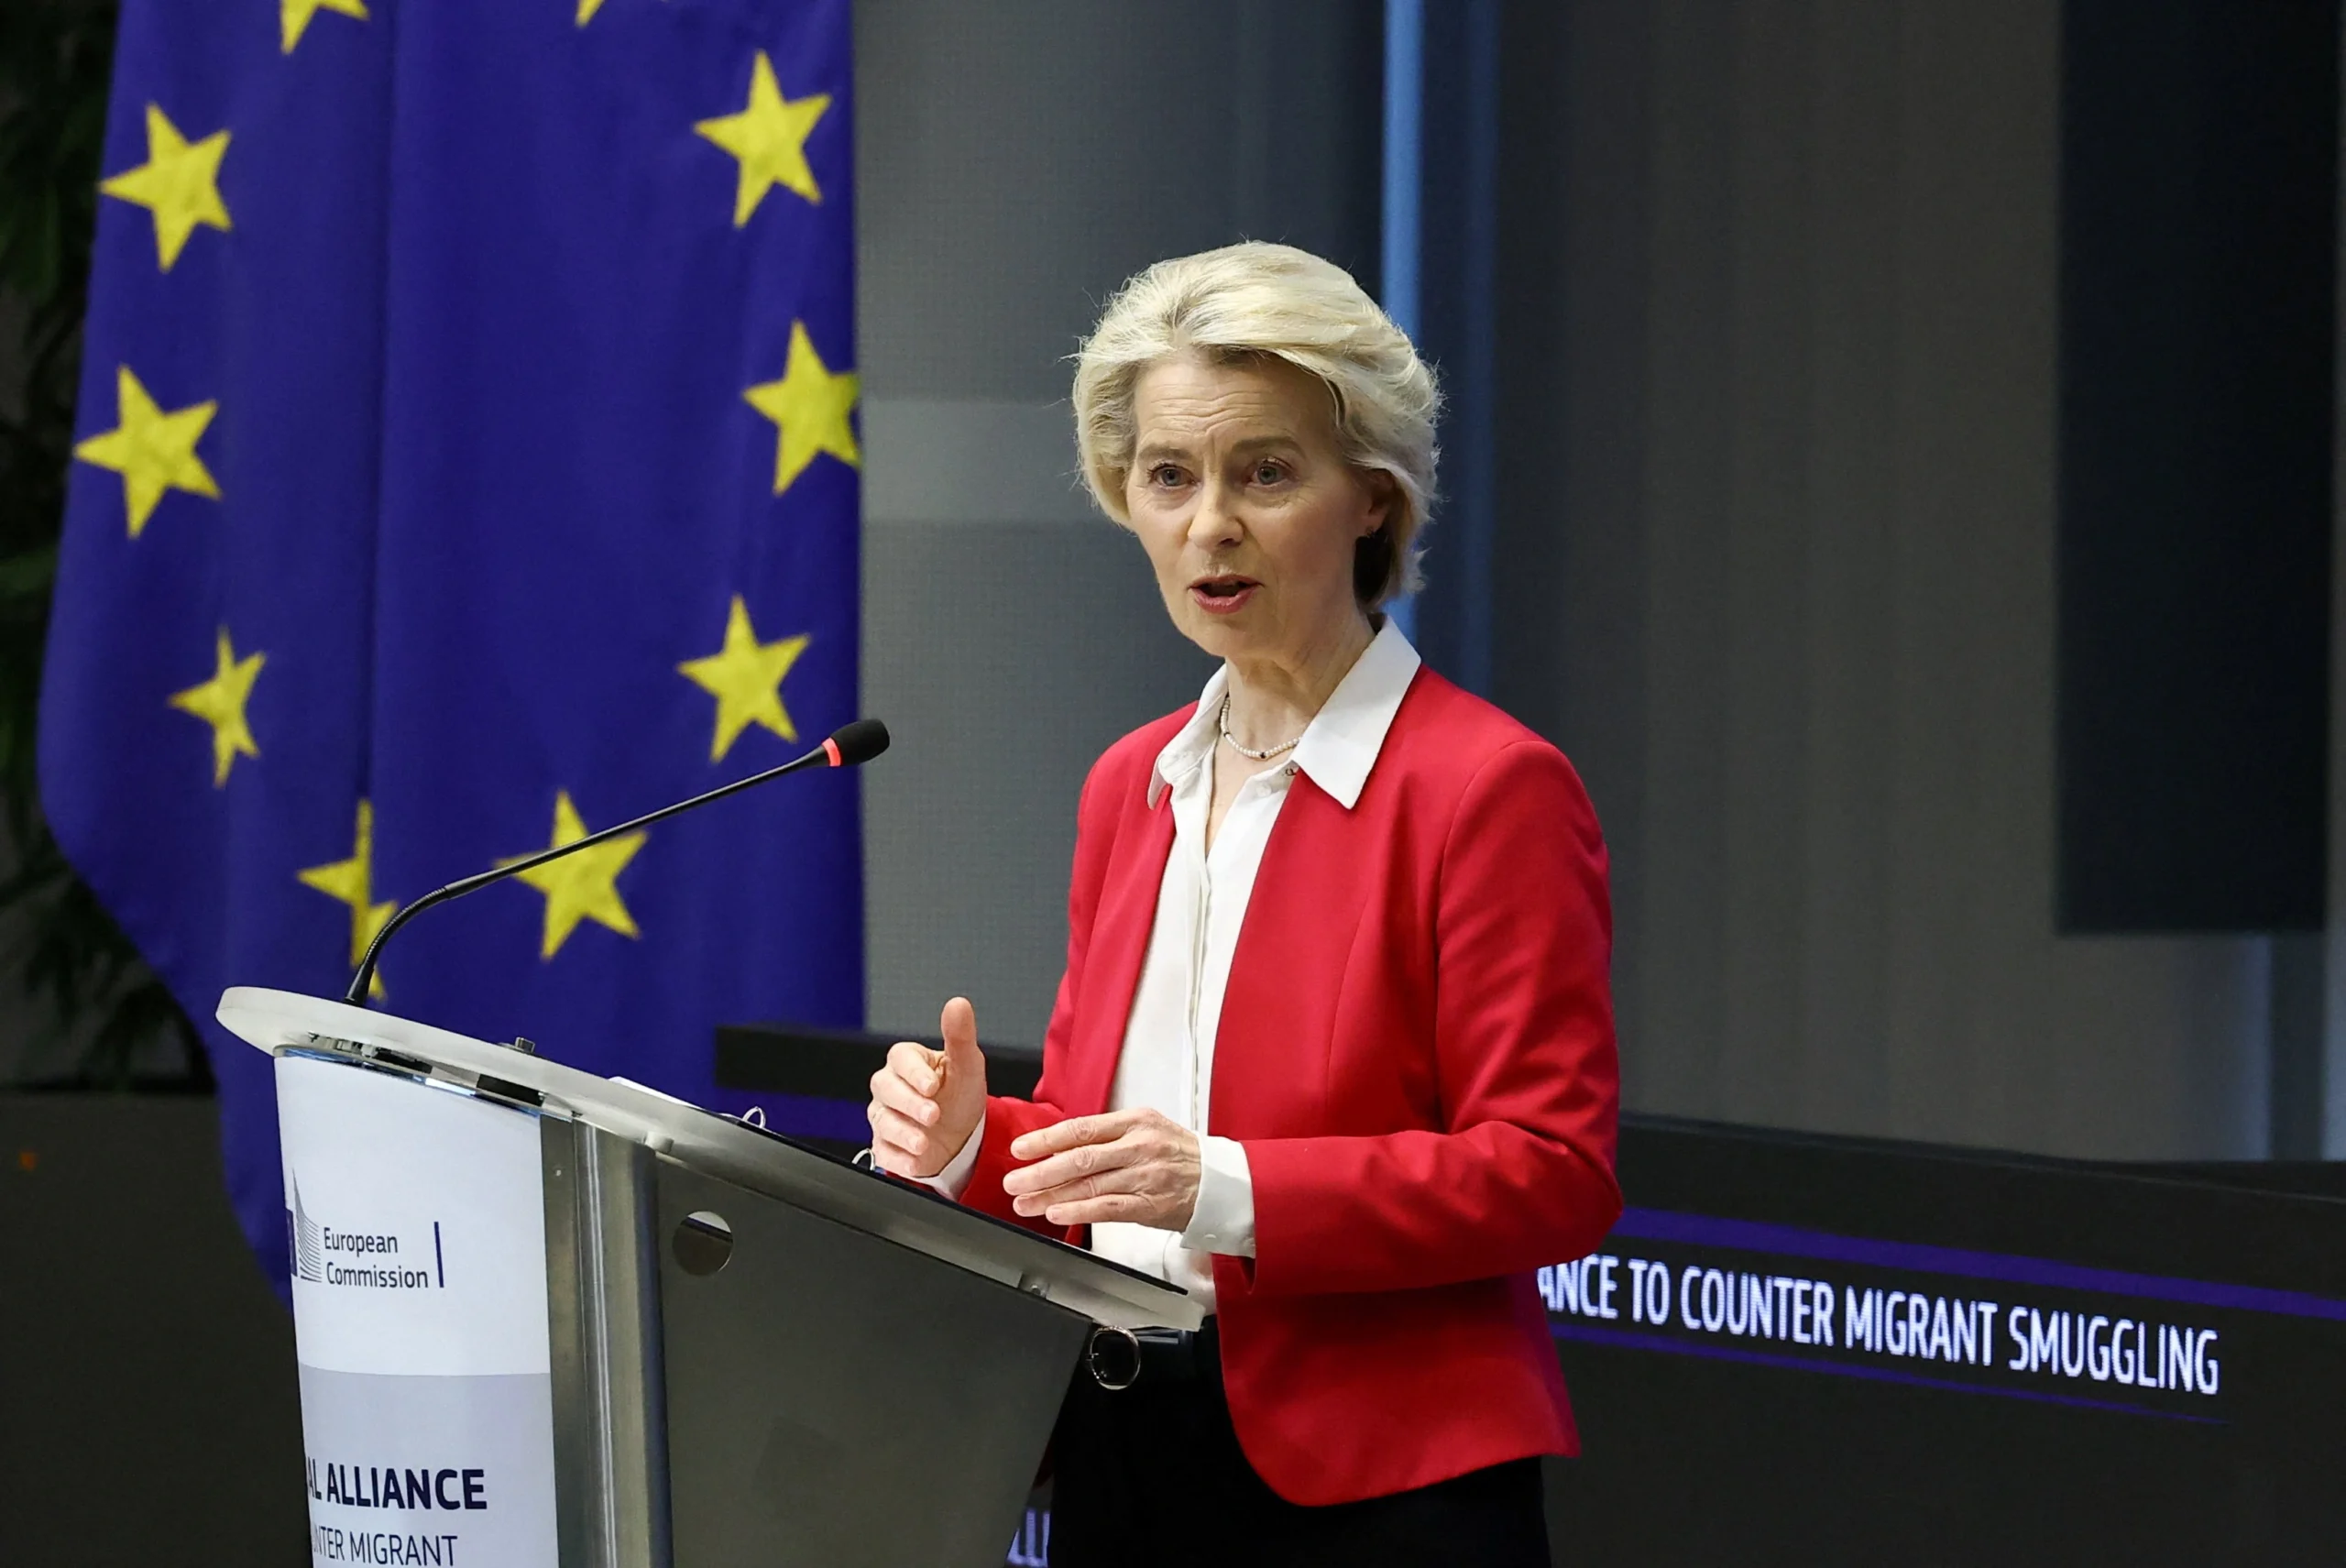
Commission President von der Leyen outlining EU trade policy in Brussels. Source: Yves Herman / REUTERS
The €1 Billion-a-Day Dilemma: Inside Brussels’ Trade Ultimatum
In her 2026 State of the Union address, European Commission President Ursula von der Leyen delivered her sternest warning to date regarding economic relations with Beijing. Citing structural industrial overcapacity in China and subsidized export dumping into the Single Market, von der Leyen emphasized that Europe’s trade deficit with China—now running at approximately €1 billion every single day—has crossed a critical threshold.
While reaffirming that diplomatic dialogue remains open, von der Leyen signaled that Brussels’ patience with protracted negotiations has expired:
“Words are good. But deeds are better. If market imbalances persist and level-playing-field conditions are not restored, the European Union will use all tools at its disposal to rebalance trade.” — Ursula von der Leyen, President of the European Commission
According to official data released alongside the address by the European Union External Action Service, the EU’s merchandise trade deficit with China has expanded sharply over the past decade. The expansion is driven by state-directed investments in clean technology, advanced industrial machinery, and automotive manufacturing, combined with persistent market barriers facing European exporters in mainland China.
Deconstruction of the EU’s Trade-Defence Arsenal
To move beyond political warnings, the European Commission is mobilizing a multi-layered regulatory architecture designed to shield European industries from non-market practices.
| Trade Defence Instrument | Legal Basis & Focus | Operational Impact on Chinese Exports |
|---|---|---|
| Foreign Subsidies Regulation (FSR) | EU Regulation 2022/2560 | Allows Brussels to inspect and block foreign state-subsidized companies from bidding on EU public tenders or acquiring European firms. |
| International Procurement Instrument (IPI) | EU Regulation 2022/1031 | Restricts access to EU public procurement markets for companies from countries that discriminate against EU businesses. |
| Anti-Subsidy & Anti-Dumping Duties | EU Regulation 2016/1037 | Enables retroactive tariffs on subsidized goods (e.g., Electric Vehicles, solar modules, wind turbines). |
| Critical Raw Materials Corporation (RESourceEU) | 2026 Industrial Strategy | Co-finances joint purchasing, strategic stockpiling, and processing of rare earth elements to reduce single-source dependency. |
As highlighted by macroeconomic analysis from Reuters Global Economic News, the Commission’s strategy represents a transition from reactive tariff enforcement to proactive market access restriction.
EU and China trade relations face growing regulatory and tariff barriers. Source: Bloomberg / Bloomberg via Getty Images
De-Risking in Action: Critical Minerals & the RESourceEU Imperative
A core pillar of von der Leyen’s strategic agenda is severing Europe’s vulnerable supply chain dependencies. China currently controls over 70% of global lithium refining, 85% of rare earth processing, and a dominant share of permanent magnet manufacturing.
To counter this vulnerability, von der Leyen confirmed the formal launch of the European Critical Raw Materials Corporation under the broader RESourceEU initiative. This entity will serve as a centralized buyer and investor, co-funding strategic mining, processing, and recycling projects within the EU, North America, and partner nations across Africa and Latin America.
Key objectives of the mineral security framework include:
- Extraction Mandates: At least 10% of the EU’s strategic raw materials extracted domestically by 2030.
- Processing Sovereignty: At least 40% of the EU’s annual consumption of strategic raw materials processed within the bloc.
- Diversification Caps: No more than 65% of any strategic raw material sourced from a single third country.
Economic reporting by the Financial Times Trade Analysis notes that these targets represent one of the most aggressive state-supported supply chain realignment efforts in modern European history.
Geopolitical Fallout & Beijing’s Countermeasures
Beijing’s Ministry of Commerce (MOFCOM) has expressed strong opposition to Brussels’ hardening stance, warning that increased trade barriers risk destabilizing global recovery and violating World Trade Organization (WTO) principles.
In response to European investigations under the FSR and anti-subsidy rules, China has initiated targeted anti-dumping probes into European exports, including brandy, dairy products, and agricultural machinery. Analysts anticipate that further unilateral measures by Brussels could prompt reciprocal restrictions on European automotive and chemical majors operating in mainland China.
+-----------------------------------------------------------------------+
|                 EU-CHINA TRADE TENSION CASCADE MATRIX                  |
+-----------------------------------------------------------------------+
| 1. EU Measures: FSR Inspections, Tariff Escalation, Raw Material Caps |
|    │                                                                  |
|    ▼                                                                  |
| 2. Chinese Countermeasures: Target Agribusiness, Spirits, Luxury Goods|
|    │                                                                  |
|    ▼                                                                  |
| 3. Corporate Impact: Supply Chain Realignment, Dual-Hub Production    |
+-----------------------------------------------------------------------+
Strategic Playbook for Global Business Leaders
For corporate executive teams and supply chain planners navigating this evolving landscape, the European Union Trade Policy Framework recommends three strategic adjustments:
- Audit State Subsidy Exposure: European subsidiaries of non-EU firms must conduct thorough audits of parent company subsidies, tax credits, and state grants to avoid disqualification under FSR procurement reviews.
- Diversify Critical Mineral Sourcing: Manufacturers reliant on graphite, neodymium, lithium, or cobalt should secure secondary supply contracts outside China ahead of 2027 compliance deadlines.
- Adopt “China + 1” Regionalization: Multinationals serving both European and Asian markets should decouple supply chains into distinct regional hubs to insulate operations from tariff hikes and export controls.
Discover more from The Economy
Subscribe to get the latest posts sent to your email.
International Trade
Tax-to-GDP Ratio Explained: Global Benchmarks, Fiscal Sovereignty & 2026 Insights
Measuring Government Revenue Efficiency and Fiscal Sovereignty
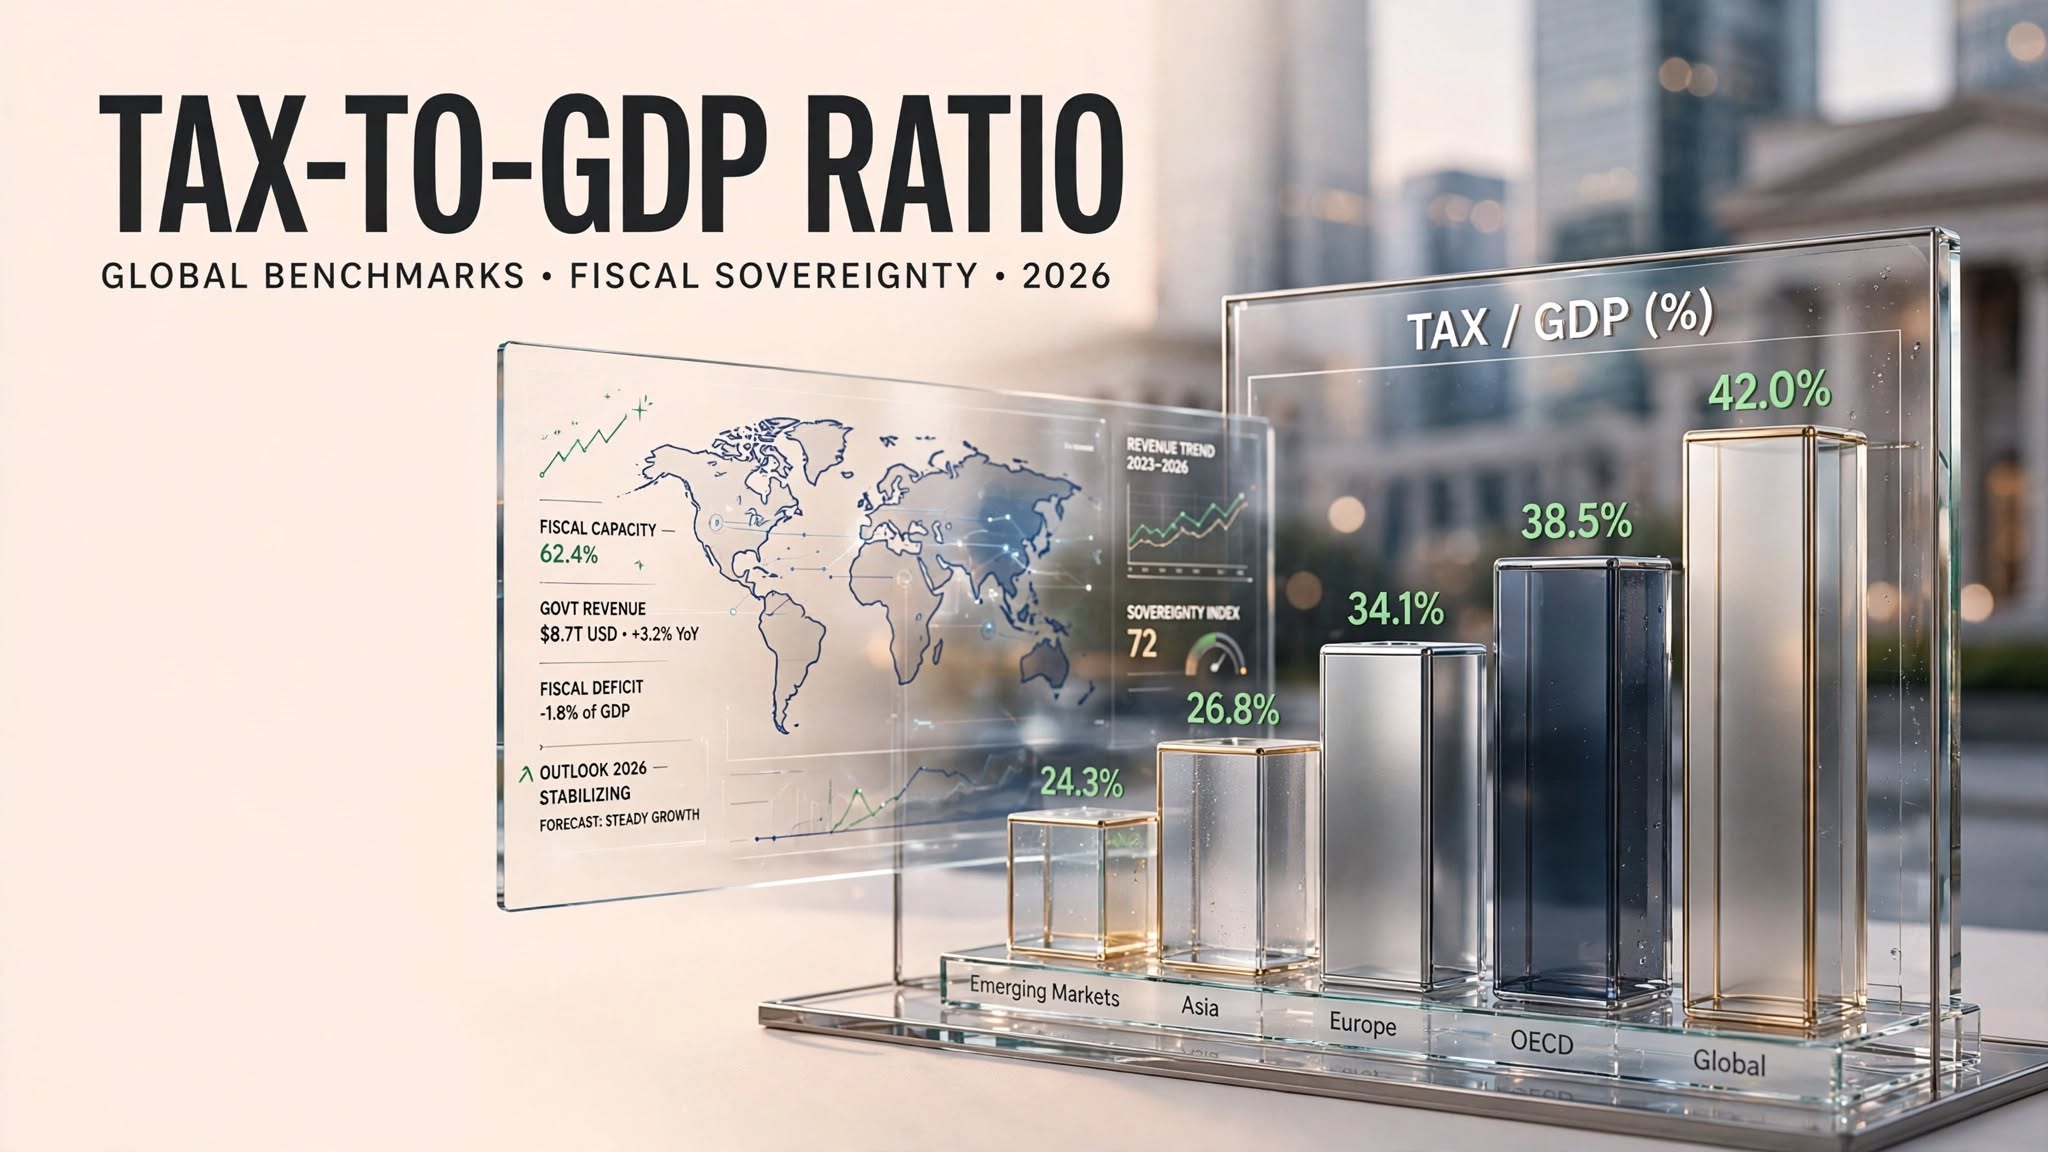
The Tax-to-GDP Ratio is a critical macroeconomic metric that compares total government tax revenue collection against the country’s Gross Domestic Product (GDP). Expressed as a percentage, it serves as the ultimate benchmark of a government’s fiscal capacity, revenue administration efficiency, and economic formalization.
For readers of economist.media and Thefinance.pk, tracking the tax-to-GDP ratio provides immediate insight into whether a government can fund its public infrastructure and debt obligations sustainably, or whether it is trapped in a perpetual cycle of fiscal deficits and external borrowing.
Why the Tax-to-GDP Ratio Matters
A healthy tax-to-GDP ratio is the cornerstone of economic sovereignty. It dictates how a government finances its public goods and services:
- Funding Public Infrastructure and Social Safety Nets: Developed nations (particularly Scandinavian and Western European economies) often boast tax-to-GDP ratios ranging from 30% to 45%. This high revenue collection allows them to build world-class public transport systems, fund universal healthcare, maintain robust public education networks, and provide social safety nets for vulnerable populations.
- Escaping the Debt Trap: When a developing nation struggles with a low tax-to-GDP ratio (often hovering between 9% and 12%), the government collects insufficient revenue to cover its day-to-day expenditures and interest payments. To bridge the gap, it must borrow heavily from domestic commercial banks or international lenders, driving up public debt and crowding out private sector investment.
The Informal Economy Trap
Why do some developing economies suffer from chronically low tax-to-GDP ratios despite high statutory tax rates? The answer lies in the informal economy (cash-based retail, undocumented labor, and unregistered small businesses).
When a massive percentage of economic activity operates off the books in cash, the tax net fails to capture it. Governments often respond by raising tax rates on the small, formal corporate sector and salaried workers already trapped in the tax net. This creates a vicious cycle: high tax rates on compliant businesses encourage more firms to slip into the informal economy, further shrinking the tax base and depressing the tax-to-GDP ratio.
Structural Tax Reform
To improve the tax-to-GDP ratio sustainably, governments must avoid harsh, regressive indirect taxes (like high flat sales taxes that disproportionately crush poor households) and instead focus on structural fiscal reforms:
- Expanding the Digital Tax Net: Integrating point-of-sale (POS) tracking systems, digitizing financial transactions, and leveraging data analytics to track high-net-worth individuals who evade income tax.
- Streamlining Exemptions: Eliminating massive corporate tax loopholes and exemptions that drain billions in potential state revenue.
- Broadening Direct Taxation: Shifting the burden toward progressive direct taxation, ensuring that wealth, high property values, and capital gains are taxed equitably.
For financial analysts, a rising tax-to-GDP ratio is a powerful signal of structural reform success, indicating that a government is moving toward fiscal self-reliance and macroeconomic stability.
Key Takeaways:
- The Tax-to-GDP ratio measures total government tax collection relative to the total size of the economy.
- Developed nations maintain high ratios (30-45%), enabling robust public infrastructure and social welfare programs.
- Low ratios in developing economies force reliance on deficit financing, heavy domestic borrowing, and external debt.
- Expanding the formal economy and capturing undocumented cash transactions are essential to raising the tax-to-GDP ratio sustainably.
Authoritative Sources & Further Reading:
- Organisation for Economic Co-operation and Development (OECD): Global Revenue Statistics and Tax-to-GDP Ratios
- World Bank: Government Revenue and Fiscal Policy Analytics
Discover more from The Economy
Subscribe to get the latest posts sent to your email.

Fox Corp 2026: Record Revenue, Tubi Growth & Roku Deal

Wendy’s Stock 2026: Inside the Turnaround Plan

Technology News 2026: Inside the $1.3T AI Chip Boom

UK Stocks 2026: Inside the FTSE 100’s Record Run

Asian Stock Markets 2026: Japan, China, Pakistan & More

Mortgage Rates Today 2026: Full Rate Guide & Forecast

Beyond Paper Wealth: Unpacking Donald Trump’s Multibillion-Dollar Liquidity and Legal Crisis

Bitcoin & XRP 2026: Inside Crypto’s Institutional Era

Global Economy 2026: IMF Growth, AI Stocks & Market Risk

China’s Local Debt Race Against Time: Why Economists Demand Central Action Before the Deflation Window Closes

Money News: How to Protect Your Portfolio From Global Inflation

World Bank Projections: Emerging vs. Big Economies of Asia

IMF Reports 2026: What the Latest Data Means for the Global Economy

Singapore Stocks Outlook: A Safe Haven in the Asian Market?

Top 30 Stocks for Investment in PSX for Massive ROI in 2026

SpaceX Starship Flight 14: First Orbital Attempt & Starlink V3 Launch Explained

AI Chip Stocks 2026: The Best Semiconductor Investments Beyond Marvell

The 2026 Crypto Regulatory Shift: What It Means for Institutional Investors

Oil Prices Break $100 in 2026: Middle East Conflict & Energy Markets

Fidelity Investments Review 2026: SPAXX Yields & Zero-Fee Funds

Tween Back-to-School Trends 2026: What’s Driving the $85B Season

AI-Powered Training: The Next Multi-Billion Dollar Ecosystem in Fitness

BRICS+ Cross-Border Payments 2026: Interoperability Explained

10-Year Treasury Yield Hits 4.80%: What It Means for Rates & Portfolios

Shein Clothes Quality & Safety in 2026: What Lab Tests Show

China’s US$10.8 Billion Trade Shortcut: Why the Pinglu Canal Matters

MRVL Earnings 2026: Why Marvell Sank Despite Beating Estimates

Leveraging Viral AI & Climate Hashtags for Brand Growth on X
-

 Markets & Finance9 months ago
Top 15 Stocks for Investment in 2026 in PSX: Your Complete Guide to Pakistan’s Best Investment Opportunities
-

 Analysis7 months ago
Johor’s Investment Boom: The Hidden Costs Behind Malaysia’s Most Ambitious Economic Surge
-

 Analysis7 months ago
Top 10 Stocks for Investment in PSX for Quick Returns in 2026
-

 Analysis8 months ago
Brazil’s Rare Earth Race: US, EU, and China Compete for Critical Minerals as Tensions Rise
-

 Banks8 months ago
Best Investments in Pakistan 2026: Top 10 Low-Price Shares and Long-Term Picks for the PSX
-

 Investment8 months ago
Top 10 Mutual Fund Managers in Pakistan for Investment in 2026: A Comprehensive Guide for Optimal Returns
-

 Global Economy9 months ago
15 Most Lucrative Sectors for Investment in Pakistan: A 2025 Data-Driven Analysis
-

 Global Economy9 months ago
Pakistan’s Export Goldmine: 10 Game-Changing Markets Where Pakistani Businesses Are Winning Big in 2025