
Markets & Finance
Fox Corp 2026: Record Revenue, Tubi Growth & Roku Deal

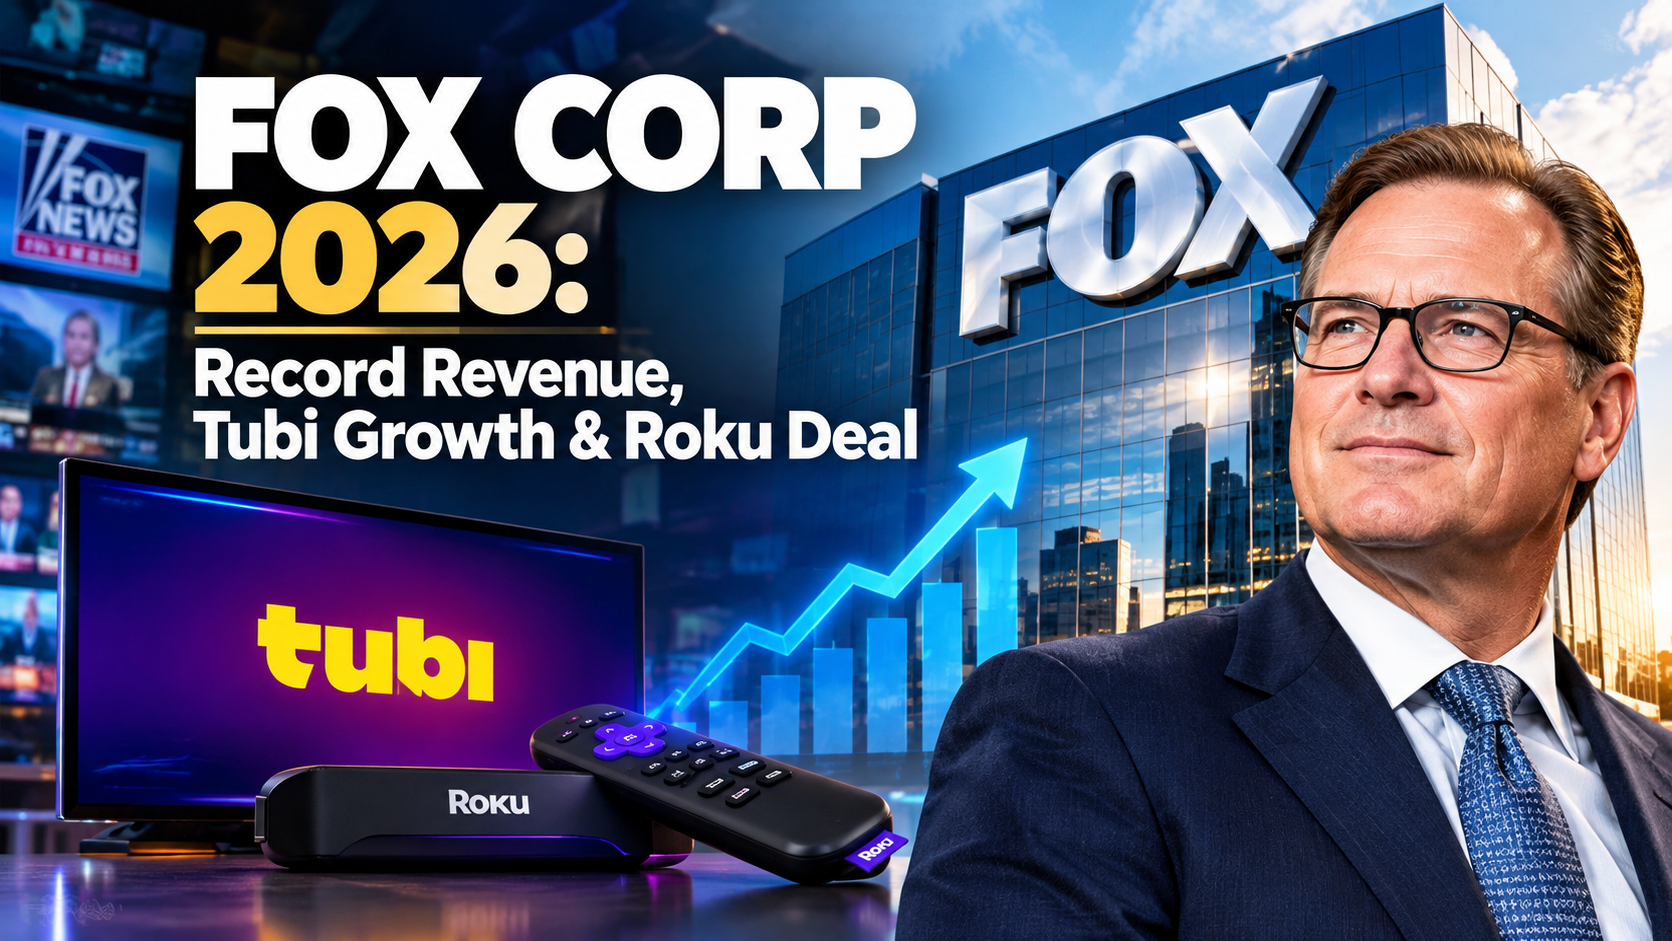
What is Fox Corporation’s biggest move in 2026? Fox delivered record annual revenue and adjusted EBITDA in fiscal 2026 while simultaneously announcing its most significant strategic move in years: a proposed acquisition of Roku, Inc., designed to combine Fox’s sports, news, and entertainment content — plus its Tubi streaming service — with Roku’s connected-TV platform and its direct relationship with more than 100 million global streaming households, according to Fox’s SEC filings related to the transaction.
The company also returned approximately $2.3 billion in capital to shareholders during fiscal 2026 — a figure that underscores how the Roku deal is being funded from a position of financial strength rather than distress, a contrast with the defensive posture many legacy media companies have adopted amid streaming-era pressure on traditional broadcast and cable economics.
Tubi’s Record Year
Featured Snippet Target: Fox’s ad-supported streaming service Tubi delivered record revenue in fiscal 2026, growing more than 25% year-over-year on the strength of over 100 million monthly active users, with total viewing time reaching approximately 13.2 billion hours — a 20% increase over fiscal 2025 — making it one of the most-watched free ad-supported streaming services in the United States according to Nielsen’s The Gauge, where it averaged roughly 2.2% of all television viewing over the year.
That growth wasn’t just about viewership volume — Tubi posted its first profitable quarter during the fiscal year, with advertising revenue soaring roughly 27% and average viewing time climbing 18% in that period, according to earnings analysis from Barchart. The platform has also been expanding its content library aggressively, growing its catalog to over 350,000 movies and television episodes, premiering 50 new original titles during the fiscal year, and expanding its “Tubi for Creators” program to include more than 20,000 episodes of creator-led content from over 400 individual creators.
FOX One and the Direct-to-Consumer Push
Fox’s other major 2026 launch was FOX One, its wholly-owned direct-to-consumer subscription streaming service — a move that positions the company to capture subscription revenue directly rather than relying solely on traditional distribution deals and Tubi’s ad-supported model. Combined with the pending Roku transaction, FOX One represents a two-pronged streaming strategy: a subscription product for viewers willing to pay directly, and an expanded free, ad-supported footprint through Tubi and, pending deal completion, Roku’s owned-and-operated Roku Channel.
Live Sports Remains the Core Engine
Even as streaming investments dominate headlines, Fox’s traditional broadcast business — anchored by live sports — has continued to perform well. NFL ratings on Fox strengthened by nearly 12% year-over-year during a recent quarter, according to Barchart’s earnings preview coverage, reinforcing the company’s continued dominance in live sports programming — a category that has proven far more resistant to streaming-driven audience fragmentation than scripted entertainment.
Fox also announced a $1.5 billion share buyback during the year, a signal management has framed as confidence in the company’s underlying growth trajectory even as it simultaneously invests heavily in the FOX One launch and the Roku transaction.
What Analysts Are Watching
Wall Street’s overall read on Fox has remained constructive through the year. Among analysts covering the stock, the consensus rating has held at “Moderate Buy,” with roughly even sentiment split between “Strong Buy” and “Hold” ratings and shares trading above the average analyst price target for extended stretches of the year — an unusual signal that suggests analyst price targets themselves have struggled to keep pace with the stock’s performance, according to coverage from Barchart.
Wall Street has broadly forecast Fox’s per-share earnings to decline modestly in fiscal 2026 on a diluted basis, before rebounding with double-digit percentage growth in fiscal 2027 — a projection that assumes Tubi’s profitability and FOX One’s early subscriber growth begin meaningfully offsetting continued softness in traditional linear-television economics. Fox’s monetization of major sporting events, including its FIFA World Cup 2026 advertising commitments, has been flagged repeatedly by analysts as a key swing factor for whether that fiscal 2027 rebound materializes on schedule.
The Bottom Line
Fox Corporation’s 2026 has been defined by a genuine strategic pivot executed from a position of financial strength: record revenue and shareholder returns funding an aggressive expansion into both ad-supported (Tubi, pending Roku) and subscription (FOX One) streaming, without sacrificing the live-sports programming that remains the company’s core competitive advantage. The Roku transaction, if completed, would meaningfully expand Fox’s direct reach into connected-TV households — arguably the single most contested distribution layer in the entire streaming industry.
Next step: Investors and media-industry watchers should track the Roku acquisition’s regulatory review timeline closely — deal completion, rather than any single quarterly earnings beat, is likely to be the biggest near-term catalyst for how Fox’s connected-TV strategy is ultimately valued by the market.
Discover more from The Economy
Subscribe to get the latest posts sent to your email.


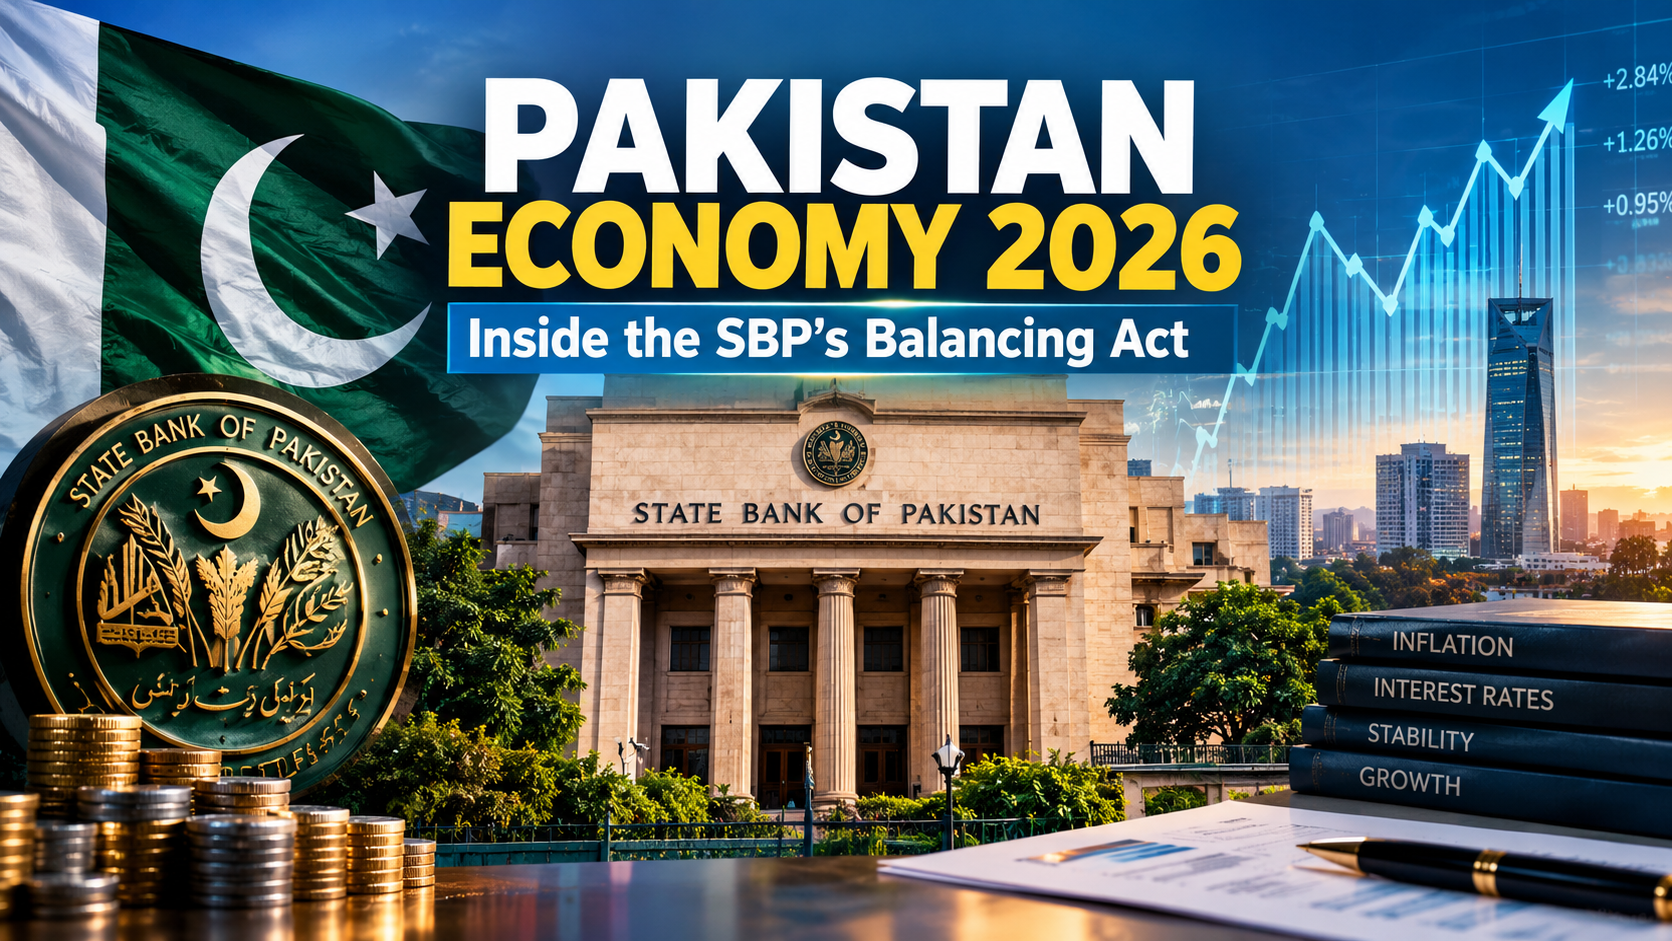
What is Pakistan’s central bank policy rate in 2026? The State Bank of Pakistan (SBP) held its policy rate unchanged at 11.5% at its September 14, 2026 meeting, according to the central bank’s official statement, even as headline inflation jumped to 11.1% year-on-year in August from 9.2% in July. The Monetary Policy Committee specifically cited the “recent intensification of the prolonged Middle East conflict” as having pushed already-elevated global commodity prices even higher, compounding persistent supply chain disruptions — a clear signal that Pakistan’s domestic inflation fight in 2026 has become inseparable from the global oil-price volatility tied to the Strait of Hormuz crisis.
That single decision captures the core tension defining Pakistan’s economy this year: a genuine, hard-won macroeconomic stabilization story running headlong into external shocks the country has no control over.
The Long Road From 22% to 11.5%
Featured Snippet Target: The State Bank of Pakistan has cut its policy rate by roughly 1,100 basis points since June 2024, when rates peaked at 22% amid inflation nearing 40% — one of the most aggressive monetary easing campaigns among emerging-market central banks in recent history — before pausing the cutting cycle in 2025 and holding steady through 2026 amid renewed inflation risk from Middle East-driven commodity price increases.
That easing campaign reflected a genuine turnaround in Pakistan’s inflation trajectory: from a peak above 38% in May 2023, inflation had fallen to single digits by late 2024, allowing the central bank room for aggressive cuts. But the pace of easing slowed and eventually paused as new pressures emerged — first flood-related agricultural disruptions in late 2025, and then, more significantly, the economic fallout from the Iran conflict that erupted in February 2026.
The Pause, Meeting by Meeting
The SBP’s rate path through 2026 has been a study in caution rather than continued easing. The central bank held rates steady at 11% in October 2025 for a fourth consecutive meeting, citing modest economic growth alongside external-sector vulnerabilities and inflation risks, with foreign exchange reserves projected to reach $15.5 billion by December 2025 and around $17.8 billion by June 2026, according to reporting from Arab News. By April 2026, with Middle East tensions escalating and oil prices surging, the SBP raised its rate by 100 basis points to 11.50%, according to ARY News — reversing its prior easing bias entirely in direct response to the geopolitical shock. The rate has been held steady at that level through subsequent meetings in June, July, and September.
The Good News Buried in the September Statement
Despite the inflation jump, the SBP’s September policy statement contained several genuinely positive developments that complicate any purely negative reading of Pakistan’s 2026 economic trajectory. The central bank’s foreign exchange reserves surpassed the end-June 2026 target of $18 billion, driven by continued FX purchases amid a small current account deficit for the fiscal year and the realization of planned official inflows. Separately, Standard & Poor’s upgraded Pakistan’s sovereign credit rating to “B” during the year — a meaningful signal of improving international investor confidence in the country’s debt sustainability. Inflation expectations among both consumers and businesses had also eased in the latest sentiment surveys, according to the SBP’s own reporting, suggesting the current inflation spike is being read by markets as externally-driven rather than a sign of a fundamental loss of policy credibility.
Growth, Floods, and a Still-Live IMF Program
Pakistan’s real GDP growth for the fiscal year was revised upward into the upper half of a previously projected 3.25%-4.25% range as of late 2025, underpinned by robust performance in agriculture and industry alongside rising domestic demand, according to Trading Economics coverage of the central bank’s own projections. That growth trajectory has had to absorb genuine shocks: flood-related crop losses drove a temporary inflation spike to 5.6% in September 2025, and border closures with Afghanistan disrupted staple food supplies including tomatoes and apples. Pakistan’s stabilization program remains anchored by its ongoing International Monetary Fund arrangement, with fiscal consolidation and the realization of planned external inflows continuing to be treated by the SBP as prerequisites for durable macroeconomic stability, consistent with the terms of the country’s 37-month, roughly $7 billion IMF Extended Fund Facility.
The Real Asset Allocation Shift Feeding Pakistan’s Stock Rally
Pakistan’s improving macro picture — falling rates through 2024-2025, easing inflation, and rising foreign reserves — has had a direct and visible knock-on effect on domestic markets: a structural shift of household savings out of fixed-income instruments and into equities, as falling returns on traditional savings vehicles pushed investors toward the stock market, according to brokerage house Topline Securities’ analysis reported by Aaj News. That reallocation has been the primary fuel behind the KSE-100’s historic rally through 2026, even as the index has periodically corrected sharply on single-session sentiment shifts.
The Bottom Line
Pakistan’s 2026 economic story is genuinely two-sided: a real, credible stabilization achieved through 1,100 basis points of rate cuts, improving foreign reserves, a credit rating upgrade, and a domestic savings shift that has fueled one of the world’s best-performing stock markets — all now being tested by an externally-driven inflation shock tied to Middle East oil-price volatility that is entirely outside the State Bank’s control. The SBP’s response so far — holding rates steady rather than resuming cuts or panicking into further hikes — suggests the central bank is treating the current inflation spike as a temporary, externally-driven disruption rather than a sign that its underlying stabilization program has failed.
Next step: Businesses and investors tracking Pakistan’s economy should watch the SBP’s October 26, 2026 Monetary Policy Committee meeting closely — a continued hold would reinforce the “temporary external shock” reading, while any additional rate hike would signal the central bank sees the Middle East-driven inflation pressure as more durable than currently assessed.
Discover more from The Economy
Subscribe to get the latest posts sent to your email.

Is the AI stock rally a bubble? The honest answer in 2026 is that the market itself is genuinely split — and the concentration numbers explain why the debate has gotten so intense. Roughly two dozen stocks now account for over half of the S&P 500’s total value, a concentration level comparable to the 32-stock peak reached during the 2000 dot-com bubble, according to market analysis relayed through Charles Schwab’s commentary. Three companies alone — Alphabet, Amazon, and Meta — are expected to drive roughly 70% of the S&P 500’s entire 2026 earnings growth.
That’s the bear case in a single statistic: an index marketed to investors as broadly diversified across 500 companies is, in practice, a leveraged bet on whether a handful of AI infrastructure spenders convert capital expenditure into earnings fast enough to justify their valuations.
The Bull Case: Spending Is Turning Into Real Revenue
Featured Snippet Target: The bull case for 2026’s AI rally rests on genuine, verifiable revenue growth rather than pure speculation — Microsoft’s AI revenue run rate surpassed $37 billion annually, Alphabet’s Google Cloud backlog nearly doubled to over $460 billion, and Amazon Web Services grew 28% — figures that distinguish this cycle from dot-com-era companies that had capital spending but little corresponding revenue.
Alphabet spent $35.67 billion on capital expenditure in a single recent quarter — more than double the prior year’s pace — while Amazon led hyperscaler quarterly spending at $44.2 billion, according to reporting compiled by Yahoo Finance’s technology desk. Combined, the four largest U.S. hyperscalers — Alphabet, Amazon, Microsoft, and Meta — are on pace to spend over $700 billion in 2026 alone. Unlike the fiber-optic overbuild of the dot-com era, where telecom capacity sat unused for years, current AI infrastructure spending is being absorbed by measurable, growing cloud and AI-service revenue in the same reporting periods it’s being deployed.
The Financing Shift That’s Making Analysts Nervous
What has shifted the debate in recent months isn’t the spending itself — it’s how that spending is being funded. Goldman Sachs has characterized 2026 as marking a transition from a low-cost-of-capital “Modern” market cycle to a higher-volatility “Post-Modern” one, in which capital expenditure is increasingly rewarded over shareholder buybacks: S&P 500 companies posted 24% year-on-year capex growth in the second quarter of 2026 alongside a 1% decline in gross buybacks, according to market commentary circulated via KuCoin’s research desk.
Consensus hyperscaler capex estimates for the 2026-2028 period were revised upward from roughly $2.5 trillion to $2.8 trillion during recent earnings seasons, with gross debt issuance among these companies expected to peak near $460 billion in fiscal 2028 — roughly a third of total capex — according to Macquarie’s Investment Strategy Insights. Alphabet’s own June 2026 equity raise, combining Class A common stock, Class C capital stock, and mandatory convertible preferred shares, ranks as the largest single AI-funding capital raise in market history. That shift — from funding AI buildout purely from operating cash flow toward relying on debt and equity markets — is precisely the kind of financing pattern that historically precedes sharper corrections when growth expectations disappoint, even when the underlying business fundamentals remain genuinely strong.
Early Cracks Have Already Appeared
The market has not been uniformly bullish through 2026 — there have already been real bouts of AI-specific volatility. Mid-September commentary from CNBC noted bond yields spiking and AI-linked stocks selling off even as broader investor sentiment remained constructive on equities generally — an early signal that markets have begun pricing a wider range of outcomes for the AI capex cycle than the largely unbroken bull run of the year’s first half suggested. That divergence between AI-specific stocks and the broader market is itself notable: in a genuine across-the-board bubble, sentiment tends to move in lockstep across a sector; a split reaction suggests investors are starting to differentiate between AI companies converting spending into revenue and those merely riding sector-wide enthusiasm.
What Would Actually Confirm a Bubble
The distinction analysts increasingly draw is not “is there a lot of spending” — there unambiguously is — but whether that spending is converting into durable revenue at a pace that justifies current valuations. The genuinely bubble-confirming scenario would involve a sustained gap opening between hyperscaler capex growth and actual AI-linked revenue growth, forcing companies to either write down infrastructure investments or continue raising debt at deteriorating terms to sustain spending. As of September 2026, revenue growth at the largest hyperscalers has generally kept pace with — and in some cases exceeded — capex growth, which is the key data point separating this cycle from a pure speculative bubble so far.
The Bottom Line
The 2026 AI trade sits in a genuinely ambiguous middle ground: spending levels and market concentration have reached bubble-era extremes by historical comparison, but the revenue being generated alongside that spending remains real and, so far, largely justifies it. The financing shift toward debt — rather than the spending level itself — is the single most important variable to watch, because it introduces a genuine failure mode (refinancing risk, credit-market stress) that pure equity-funded capex would not carry. Neither the unambiguous bull case nor the unambiguous bubble case is fully supported by the data as it stands; both remain live possibilities depending on how the next several quarters of hyperscaler earnings play out.
Next step: Track the spread between hyperscaler capex growth rates and their AI-linked revenue growth rates each earnings season — a widening gap, more than any single stock’s valuation multiple, would be the clearest confirming signal that 2026’s AI rally has crossed from justified investment into unsustainable bubble territory.
Discover more from The Economy
Subscribe to get the latest posts sent to your email.
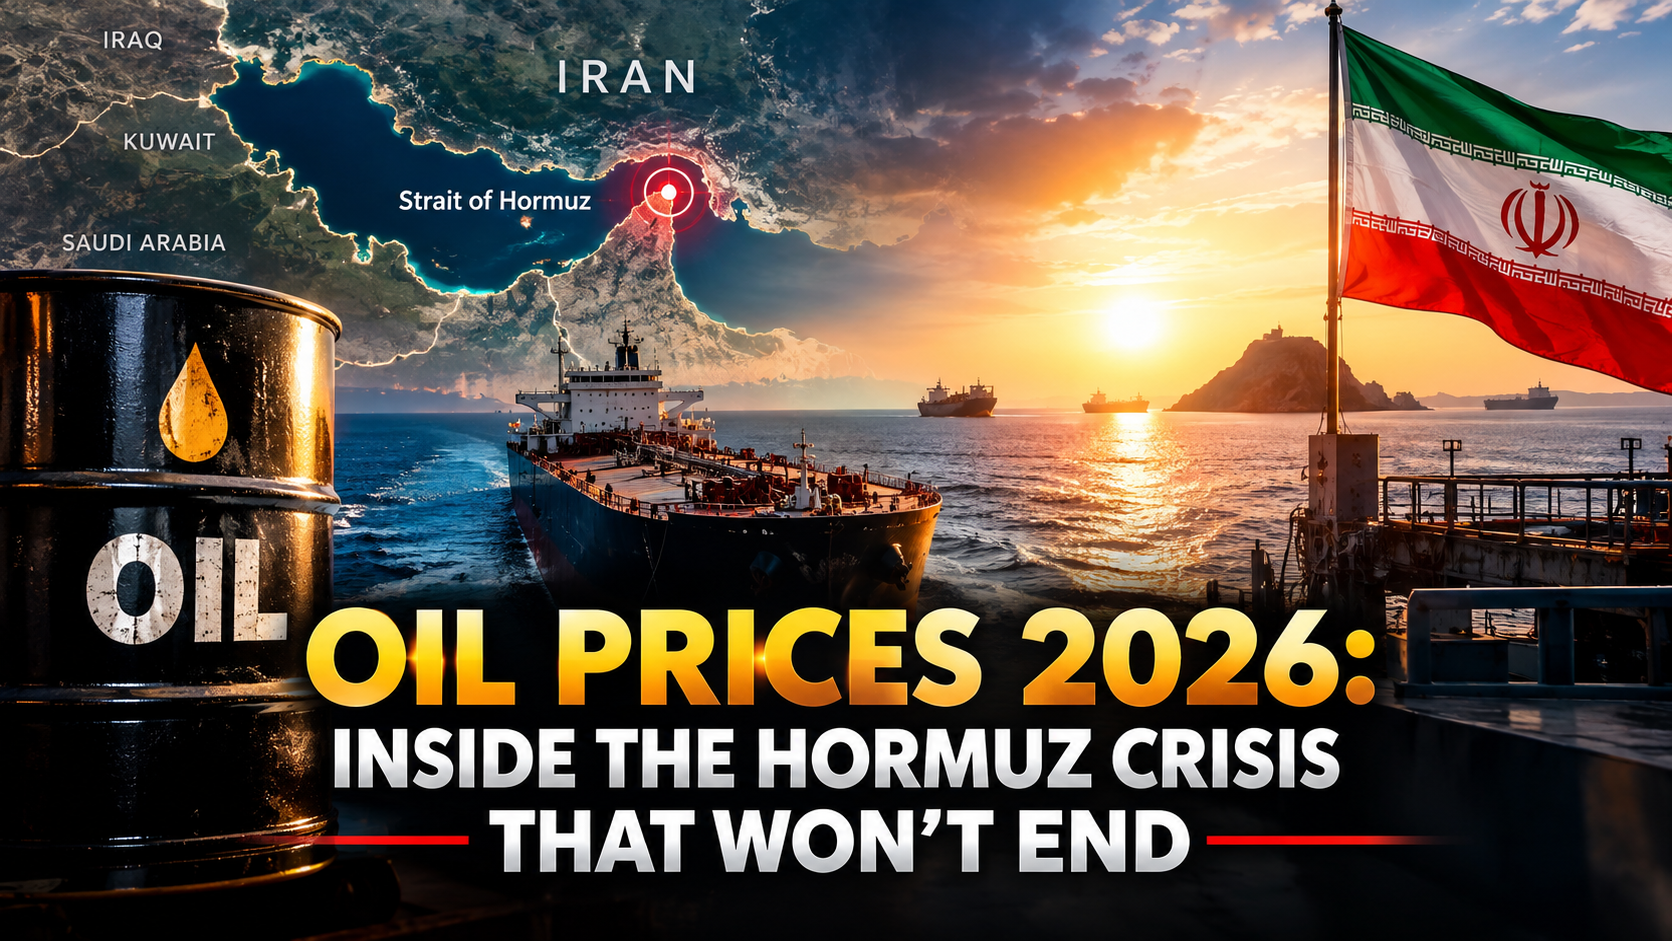
Why are oil prices so volatile in 2026? Nearly every major oil-price swing in 2026 traces back to a single chokepoint: the Strait of Hormuz, through which roughly a fifth of the world’s oil and liquefied natural gas flows, according to Reuters reporting carried by the Express Tribune. Since war broke out between the U.S., Israel, and Iran at the end of February 2026, the strait’s status — open, restricted, or effectively closed — has driven Brent crude through some of the widest swings the market has seen in years.
The Timeline: From $63 to $126 and Back
Featured Snippet Target: Brent crude averaged around $63.85 per barrel in a February 2026 analyst survey conducted just before war broke out; by March, after Iran effectively restricted Hormuz traffic, the same survey’s forecast jumped to $82.85 — a 30% increase representing the steepest one-month forecast revision in the Reuters oil poll’s history since 2005 — with prices briefly touching levels near $126 for Brent and nearly $120 for WTI at the conflict’s most acute phase.
That initial shock was followed by a genuine de-escalation. By late June, Brent fell to $73.76 a barrel — its lowest level since before the Iran war began — after reports emerged that tankers were again passing through Hormuz following a ceasefire, according to Energynomics. J.P. Morgan analysts cut their Brent forecast for the second half of 2026 to an average of $86 in the third quarter and $80 in the fourth, while a broader Reuters poll of 31 economists lowered its full-year 2026 Brent forecast to $84.50 per barrel, down from $90.44 the prior month — the first downward revision analysts had made since the conflict began, driven by the normalization of Hormuz shipping traffic.
Why the Calm Didn’t Last
That de-escalation proved temporary. By early August, oil prices were rising again on renewed concerns over Hormuz’s reopening plans, as Iran — working alongside Oman — proposed banning vessels deemed “hostile” from the strait while imposing heavy fines on rule violators, pushing Brent back up to $83.29 a barrel, according to Reuters coverage. By mid-September, tensions had escalated further still: Brent settled at $104.61 and WTI at $100.05 on September 12, having touched multi-month highs near $107-$109 earlier in the week, driven by renewed maritime security concerns spanning both the Strait of Hormuz and the Red Sea, according to PSU Connect.
That September spike also coincided with tight refining margins pushing derivative products like US diesel to historic highs — a sign that the oil-market stress has been feeding through into downstream fuel costs even during periods when crude itself wasn’t setting fresh records.
The Scenario Analysis That Kept Shifting
Throughout the year, major banks published scenario-based forecasts that essentially functioned as a real-time gauge of how seriously markets were taking the risk of a prolonged Hormuz closure. Goldman Sachs, in an April note, laid out an “adverse view” in which Brent would average above $100 a barrel through the second half of 2026 if the strait remained closed for another month, with a more extreme scenario — involving a longer closure and lost regional production — pushing Brent to $120 in the third quarter and $115 in the fourth, according to Fortune. Barclays similarly raised its 2026 Brent forecast to $100 from $85 in early May, estimating the oil market was running a supply deficit of around 6.6 million barrels per day at the time, a gap the bank warned was likely to widen the longer disruptions continued, according to Kitco.
The Knock-On Effects Across the Global Economy
Oil’s 2026 volatility hasn’t stayed contained to energy markets. Elevated and unpredictable crude prices have been cited repeatedly as a contributing factor behind mortgage-rate stickiness in the U.S. (via broader inflation pressure), the Federal Reserve’s more hawkish policy stance under new Chair Kevin Warsh, and Pakistan’s central bank holding its policy rate steady at 11.5% in September specifically because of “further increase in already elevated global commodity prices” tied to the conflict, according to the State Bank of Pakistan’s official September monetary policy statement. Fitch Ratings has separately pointed to Iran-conflict-driven oil prices as a factor pressuring global mortgage rates and building costs across its 2026 Global Housing and Mortgage Outlook.
The Bottom Line
Oil in 2026 has behaved less like a market responding to steady supply-and-demand fundamentals and more like a real-time barometer of Strait of Hormuz risk — surging past $126 at the conflict’s peak, falling to pre-war lows near $74 during the June ceasefire, and climbing back above $100 by September as tensions resurfaced. Every major bank forecast published during the year has effectively been a bet on how long Hormuz disruptions would last, and each time the strait’s status has changed, those forecasts have needed revising within weeks rather than months.
Next step: Anyone tracking oil-price exposure — whether for investment, business cost planning, or simply understanding inflation’s trajectory — should treat Strait of Hormuz shipping-traffic reports, not headline crude prices alone, as the leading indicator: traffic data has consistently moved days ahead of the price swings themselves throughout 2026.
Discover more from The Economy
Subscribe to get the latest posts sent to your email.

Pakistan Economy 2026: Inside the SBP’s Balancing Act

Is AI a Stock Bubble in 2026? What the Data Shows

Oil Prices 2026: Inside the Hormuz Crisis That Won’t End

Gold Price 2026: Inside the Wildest Rally in Decades

Federal Reserve 2026: Inside Kevin Warsh’s First Year

Fox Corp 2026: Record Revenue, Tubi Growth & Roku Deal

Wendy’s Stock 2026: Inside the Turnaround Plan

Technology News 2026: Inside the $1.3T AI Chip Boom

UK Stocks 2026: Inside the FTSE 100’s Record Run

Asian Stock Markets 2026: Japan, China, Pakistan & More

Mortgage Rates Today 2026: Full Rate Guide & Forecast

Beyond Paper Wealth: Unpacking Donald Trump’s Multibillion-Dollar Liquidity and Legal Crisis

Bitcoin & XRP 2026: Inside Crypto’s Institutional Era

Global Economy 2026: IMF Growth, AI Stocks & Market Risk

Top 30 Stocks for Investment in PSX for Massive ROI in 2026

SpaceX Starship Flight 14: First Orbital Attempt & Starlink V3 Launch Explained

AI Chip Stocks 2026: The Best Semiconductor Investments Beyond Marvell

The 2026 Crypto Regulatory Shift: What It Means for Institutional Investors

Oil Prices Break $100 in 2026: Middle East Conflict & Energy Markets

Fidelity Investments Review 2026: SPAXX Yields & Zero-Fee Funds

Tween Back-to-School Trends 2026: What’s Driving the $85B Season

AI-Powered Training: The Next Multi-Billion Dollar Ecosystem in Fitness

BRICS+ Cross-Border Payments 2026: Interoperability Explained

10-Year Treasury Yield Hits 4.80%: What It Means for Rates & Portfolios

Shein Clothes Quality & Safety in 2026: What Lab Tests Show

China’s US$10.8 Billion Trade Shortcut: Why the Pinglu Canal Matters

MRVL Earnings 2026: Why Marvell Sank Despite Beating Estimates

Leveraging Viral AI & Climate Hashtags for Brand Growth on X
-

 Markets & Finance9 months ago
Top 15 Stocks for Investment in 2026 in PSX: Your Complete Guide to Pakistan’s Best Investment Opportunities
-

 Analysis7 months ago
Johor’s Investment Boom: The Hidden Costs Behind Malaysia’s Most Ambitious Economic Surge
-

 Analysis7 months ago
Top 10 Stocks for Investment in PSX for Quick Returns in 2026
-

 Analysis8 months ago
Brazil’s Rare Earth Race: US, EU, and China Compete for Critical Minerals as Tensions Rise
-

 Banks8 months ago
Best Investments in Pakistan 2026: Top 10 Low-Price Shares and Long-Term Picks for the PSX
-

 Investment8 months ago
Top 10 Mutual Fund Managers in Pakistan for Investment in 2026: A Comprehensive Guide for Optimal Returns
-

 Global Economy9 months ago
15 Most Lucrative Sectors for Investment in Pakistan: A 2025 Data-Driven Analysis
-

 Global Economy9 months ago
Pakistan’s Export Goldmine: 10 Game-Changing Markets Where Pakistani Businesses Are Winning Big in 2025