
Analysis
Pakistan’s Push for Climate-Resilient Budgeting Amid EU Carbon Pressures: A Path to Sustainable Exports?

Professor Lubna Naz of Institute of Business Administration Karachi, delivered a warning that reverberated far beyond academic walls. “The European Union will bind Pakistan’s textile sector to carbon footprint thresholds by 2027-2030,” she told a January 2026 panel on decentralizing climate action. “If it happens, our major exports may suffer—and we’ll pay a heavy price.”
Her words cut to the heart of a dilemma now gripping Pakistan’s economic policymakers: how to reconcile surging climate vulnerabilities with trade realities that keep the nation afloat. Textiles account for approximately 60% of Pakistan’s exports, with the EU absorbing $9.0 billion worth of Pakistani goods in 2024 alone—making Pakistan the largest beneficiary of the EU’s GSP+ preferential trade scheme. Yet Europe’s Carbon Border Adjustment Mechanism (CBAM)—already targeting steel, cement, and fertilizers since October 2023—threatens to impose stringent carbon limits on textiles within the next four years, potentially offsetting the very trade benefits Pakistan has cultivated.
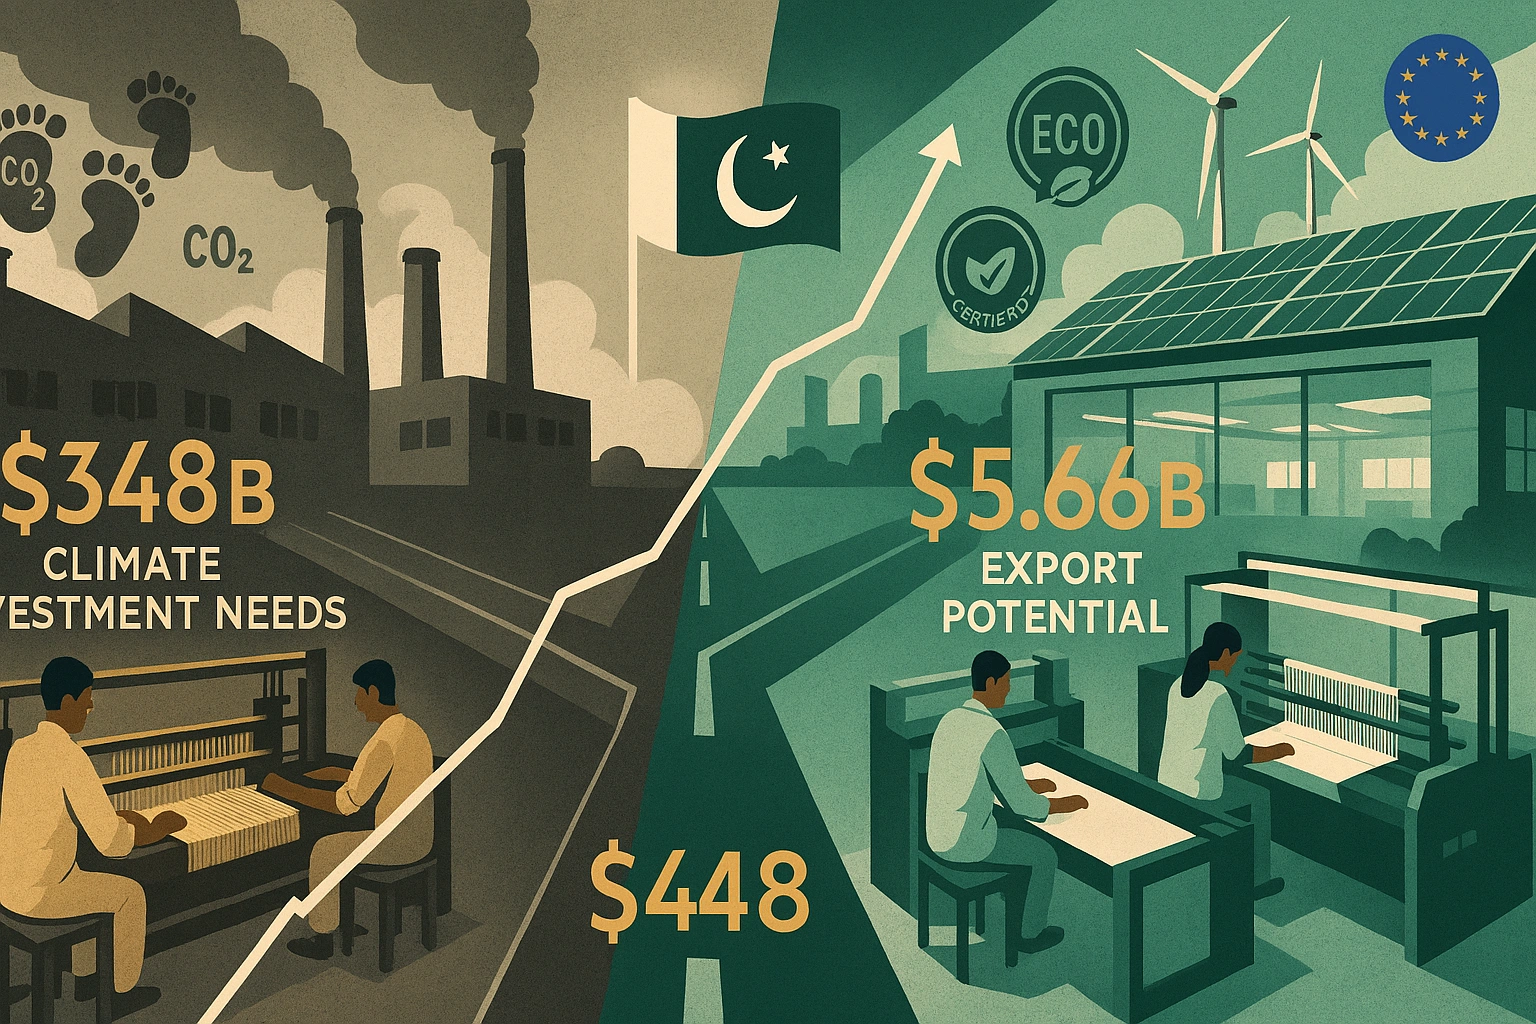
For the first time in history, Pakistan’s Finance Ministry has responded with an unprecedented directive: all federal ministries must submit pro-climate budget proposals for fiscal year 2026-27. Advisor to the Finance Minister Khurram Schehzad framed the move as existential, stating this marks “the first time” climate considerations will shape budget planning across government. But can green budgeting close a $348 billion climate investment gap by 2030—and save Pakistan’s textile lifeline in the process?
The EU’s Carbon Gauntlet: What CBAM Means for Pakistan’s Textile Dominance
The Carbon Border Adjustment Mechanism represents a fundamental shift in how the European Union approaches climate-linked trade policy. Launched in its transitional phase in October 2023, CBAM initially targets six carbon-intensive sectors: cement, iron and steel, aluminum, fertilizers, electricity, and hydrogen. By 2026, the mechanism enters its definitive regime, requiring EU importers to purchase carbon certificates reflecting the embedded emissions in their goods—certificates priced according to the EU’s Emissions Trading System allowances.
Currently, only 1.3% of Pakistan’s exports to the EU fall under CBAM’s scope, primarily steel and cement products. However, the European Commission has signaled its intention to expand the mechanism to cover additional sectors, including chemicals, polymers, and critically for Pakistan, textiles. As one recent analysis notes, “Beyond 2026, the EU has indicated that it intends to broaden CBAM to cover chemicals, polymers, and possibly textiles. For Pakistan, where textiles make up about 60 per cent of all exports and 28 per cent of trade with the EU, this is concerning.”
The threshold mechanism is particularly punishing: importers bringing more than 50 tons of covered goods annually into the EU must register as authorized CBAM declarants and purchase certificates matching their products’ carbon footprint. For Pakistan’s textile sector—characterized by high emission intensity due to reliance on fossil fuel-based energy and outdated machinery—this could translate into substantial cost increases that erode competitive advantages.
The timing couldn’t be worse. Pakistan’s textile exports have shown fragile recovery, growing just 0.93% to $16.655 billion in fiscal year 2023-24 after a steep 14.63% decline the previous year. Meanwhile, competitors like Bangladesh, Vietnam, and India are already implementing carbon pricing mechanisms and measurement, reporting, and verification (MRV) systems to prepare for CBAM compliance—moves that could position them favorably while Pakistan falls behind.
Pakistan Climate Change Budget FY2026-27: A Historic Fiscal Pivot
Against this backdrop, Pakistan’s Finance Division has issued its Budget Call Circular for FY2026-27, projecting 5.1% GDP growth and 6.5% inflation while introducing a groundbreaking climate dimension. For the first time, the budget incorporates Climate Budget Tagging (CBT), classifying over 5,000 cost centers across federal ministries under adaptation, mitigation, and supporting categories. This tagging has been integrated into the government’s Integrated Financial Management Information System (IFMIS), enabling real-time tracking of climate-sensitive expenditures.
The Pakistan green budgeting reforms extend beyond mere accounting. The government has introduced Form-III C screening mechanisms ensuring every federal subsidy aligns with national climate objectives before disbursement—a requirement also mandated under the IMF’s Extended Fund Facility program. Minimum thresholds now guarantee that at least 8% of current expenditures and 16% of Public Sector Development Program allocations are climate-tagged, representing a structural commitment to environmental accountability.
Pakistan’s first climate-focused budget allocates PKR 603 billion to mitigation efforts, targeting clean energy transitions, sustainable agriculture, and emission reductions across sectors. Yet the scale of the challenge dwarfs these initial commitments. According to UN analysis, Pakistan faces a climate finance gap of $40-50 billion annually—money needed for everything from flood protection infrastructure to renewable energy buildout. With climate-related disasters already costing the economy an estimated 1.03% of GDP per event without proper risk financing mechanisms, the urgency is palpable.
“The language is different,” explained Kashmala Kakakhel, an independent climate finance specialist, describing Pakistan’s steep learning curve in accessing international climate funds. “The way you curate the entire proposal is very different. The climate rationale is very different.” This procedural complexity helps explain why, despite the existence of a $2 trillion global climate finance market encompassing the Green Climate Fund, Global Environment Facility, and specialized facilities, Pakistan has struggled to mobilize resources at the scale required.
Pakistan Climate Finance Gap: Bridging the $348 Billion Chasm
The mathematics are sobering. Pakistan’s Nationally Determined Contributions outline $348 billion in climate investment needs through 2030—encompassing renewable energy infrastructure, climate-resilient agriculture, disaster preparedness systems, and green industrial transitions. Even with optimistic projections, domestic resource mobilization and traditional development finance cannot close this gap without innovative approaches.
Enter Islamic climate finance, a potentially transformative mechanism for a nation where faith-aligned financial instruments command broad public legitimacy. The Asian Development Bank’s analysis highlights how green sukuk (Islamic bonds) and climate-aligned Islamic financing structures could unlock billions in capital from regional Islamic financial institutions and sovereign wealth funds. WAPDA’s 2024 green euro bond issuance demonstrated proof of concept, though scaling such instruments requires robust regulatory frameworks and credible certification processes.
Yet institutional fragmentation hampers progress. “It’s just like a mismatch of jigsaw puzzle pieces,” observed Abid Qaiyum Suleri of the Sustainable Development Policy Institute, describing coordination challenges between federal and provincial authorities. “They will have their own projects. They will have their own priorities.” This siloed approach risks duplicating efforts, missing synergies, and failing to present coherent proposals to international climate funds that increasingly demand comprehensive national strategies.
The post-2022 flood period catalyzed some reforms. Pakistan launched its National Adaptation Plan in 2023 and published a National Climate Finance Strategy in 2024. The Planning Commission approved Climate Risk Screening Guidelines requiring all public investments to undergo climate-proofing assessments—critical steps toward the systematic integration Prof. Naz and others advocate. But implementation remains uneven, with technical capacity constraints particularly acute at provincial and district levels where climate impacts manifest most acutely.
EU Green Regulations Pakistan 2027: The Textile Sector at the Crossroads
For Pakistan’s textile manufacturers, carbon border adjustment Pakistan exports represents both an existential threat and a potential catalyst for long-overdue modernization. The sector’s emission intensity stems from multiple sources: coal and gas-fired power generation supplying energy-intensive processes, aging machinery operating below optimal efficiency, water-intensive dyeing and finishing operations, and limited adoption of circular economy principles in fiber sourcing.
Large conglomerates like Interloop Limited (which exported PKR 147 billion worth of textiles in FY2024), Style Textile, and Artistic Milliners have already begun sustainability transitions, investing in solar installations, water recycling systems, and certification programs meeting international environmental standards. However, these industry leaders represent a fraction of Pakistan’s textile ecosystem. Hundreds of small and medium enterprises operating with thin margins and limited access to capital face insurmountable barriers to rapid decarbonization without targeted support.
The GSP+ equation further complicates matters. Pakistan’s zero-tariff access to EU markets under the Generalized Scheme of Preferences Plus currently saves exporters billions in duties annually—a benefit that could be partially or entirely offset by CBAM certificate costs if textiles enter the mechanism’s scope as anticipated. One analysis suggests that inclusion of textiles in CBAM by 2027 would result in “carbon-related costs potentially neutralizing Pakistan’s preferential trade advantages,” forcing a fundamental reassessment of export competitiveness.
Professor Naz’s panel question resonates: what are the government’s accreditation plans? Without a national carbon registry, standardized emissions measurement protocols, and internationally recognized verification processes, Pakistani exporters cannot demonstrate compliance even if they invest in cleaner production. This creates a chicken-and-egg dilemma where investments in decarbonization may not yield market access if proper certification infrastructure doesn’t exist.
Carbon Border Adjustment Pakistan Exports: Risks, Opportunities, and Regional Responses
The risks are clear and quantifiable. Should CBAM extend to textiles at current emission intensities, Pakistan could face:
- Export revenue losses estimated in the billions as EU buyers shift to lower-carbon suppliers or domestic production
- Competitive disadvantage against regional rivals already implementing carbon pricing and building MRV capacity
- Investment flight as multinational brands recalibrate supply chains toward CBAM-compliant jurisdictions
- Employment shocks in a sector employing approximately 38% of Pakistan’s industrial workforce, predominantly lower-skilled workers with limited alternative opportunities
Yet crisis breeds opportunity. The same carbon pressures could accelerate Pakistan’s renewable energy transition, create new markets for eco-certified products, and position forward-thinking manufacturers as preferred partners for sustainability-conscious brands. Some potential pathways include:
Renewable Energy Scale-Up: Pakistan’s abundant solar and wind resources remain largely untapped for industrial use. Falling renewable costs now make distributed generation economically viable for textile clusters, offering both emissions reductions and energy security. The government’s recent focus on renewable energy in its NDC 3.0—incorporating specific targets for solar and wind capacity additions—provides policy support, though financing mechanisms and grid integration challenges require attention.
Technology Transfer and Innovation: The Diplomat’s analysis of climate-linked trade policy notes that “mechanisms to share emission reduction technology would be more effective” than punitive carbon tariffs alone. Pakistan could negotiate technology partnerships with European textile machinery manufacturers, potentially accessing cleaner production technologies at concessional terms through development finance institutions.
Green Premiums and Market Differentiation: A growing segment of EU consumers actively seeks sustainable products, willing to pay premiums for verified low-carbon textiles. Pakistani manufacturers achieving credible certification could capture this market segment, potentially offsetting CBAM costs through higher prices—though this requires investment in both production improvements and marketing.
Regional Learning: Competitor nations offer instructive examples. India recently expanded its carbon market to include petroleum refineries, petrochemicals, textiles, and secondary aluminum—explicitly building “CBAM Resilience” into industrial policy. Vietnam and Indonesia have launched national carbon pricing pilots. Even Turkey’s focus on electric arc furnaces in steel production demonstrates how sector-specific technological choices can dramatically reduce carbon intensity. Pakistan’s delayed response creates catching-up challenges but also allows learning from others’ successes and failures.
Policy Pathways Forward: What Pakistan Must Do Now
Transforming carbon constraints into competitive advantages requires coordinated action across multiple fronts. Based on international best practices and Pakistan’s specific circumstances, several priority interventions emerge:
Establish National Carbon Infrastructure: Pakistan needs a centralized carbon registry tracking emissions across industries, particularly export sectors. This registry should employ internationally standardized protocols (ISO 14064, GHG Protocol) ensuring EU recognition. The Planning Commission’s Climate Risk Screening Guidelines provide a foundation, but implementation must extend beyond project approval to operational monitoring.
Accelerate Sector-Specific Decarbonization Roadmaps: Rather than generic climate targets, Pakistan requires detailed transition plans for textiles, cement, steel, and other CBAM-vulnerable industries. These roadmaps should identify specific technological interventions (energy-efficient machinery, renewable power integration, process optimization), quantify costs and emission reductions, and sequence investments strategically. The National Climate Change Policy’s regular review mechanism provides an institutional home for such planning.
Mobilize Blended Climate Finance: Closing the $40-50 billion annual gap demands innovative financing combining public resources, development finance, green bonds, Islamic climate instruments, and private capital. Pakistan’s recent approval for a $1.4 billion IMF climate resilience facility represents a start, but scaling requires strengthening institutional capacity to design fundable projects meeting international climate fund criteria.
Build SME Capacity for Compliance: Large textile exporters can afford carbon audits, emissions monitoring, and certification—small enterprises cannot. Government-sponsored technical assistance programs, perhaps partnered with industry associations and international development agencies, could provide subsidized carbon accounting services, technology assessments, and compliance roadmaps for SMEs. Without such support, CBAM risks becoming a regressive mechanism favoring large players while eliminating smaller competitors.
Strengthen EU-Pakistan Climate Dialogue: Rather than viewing CBAM purely as an external imposition, Pakistan should engage proactively in EU climate policy discussions. The European Commission’s textiles strategy acknowledges supporting developing countries in green transitions. Pakistan could negotiate technical assistance, preferential access to EU climate technology, and potentially transitional measures recognizing countries making good-faith decarbonization efforts even if absolute emission levels remain elevated.
Integrate Climate into Trade Negotiations: Future trade agreements should explicitly incorporate climate provisions—not as barriers but as frameworks for mutual support. Pakistan’s trade offices, currently focused on traditional market access issues, need climate expertise to navigate this evolving landscape where environmental performance increasingly determines commercial access.
Turning Carbon Constraints into Export Resilience
Pakistan stands at a crossroads that Professor Naz articulated so starkly in Karachi. The convergence of climate vulnerabilities and carbon-linked trade regulations creates genuine risks to an export sector that remains the economy’s lifeblood. Yet this same pressure could catalyze the modernization, innovation, and sustainability transitions that Pakistan’s textile industry has deferred for decades.
The Pakistan climate change budget FY2026-27 represents a historic first step—acknowledgment that fiscal policy and climate action are inseparable in an era of European Green Deals and carbon border adjustments. Climate Budget Tagging, ministerial mandates for pro-climate proposals, and integration of environmental screening into subsidy allocation all signal genuine political commitment. But ambition must meet execution.
The $348 billion question—whether Pakistan can mobilize the investment required for climate resilience while maintaining export competitiveness—has no easy answer. It demands governmental coordination that transcends bureaucratic silos, private sector investment despite uncertain returns, international partnerships balancing support with accountability, and public understanding that short-term costs yield long-term sustainability.
For Pakistan’s textile exporters eyeing European markets nervously as 2027 approaches, the message is clear: adaptation is not optional. The only choice is whether to scramble reactively when CBAM expansion hits or to invest proactively in the cleaner, more efficient, climate-resilient production systems that increasingly define global competitiveness.
As Khurram Schehzad’s unprecedented budget directive demonstrates, Pakistan’s government has recognized the stakes. Now comes the harder work: translating recognition into action, climate tags into tangible emissions reductions, and constraint into catalyst. The path from carbon vulnerability to export resilience exists—but the window to walk it is narrowing with each passing fiscal year.
For more information on Pakistan’s climate adaptation efforts and financing challenges, see Dawn’s coverage of the climate funding gap and Business Recorder’s analysis of CBAM implications.
Discover more from The Economy
Subscribe to get the latest posts sent to your email.



Navigating Mortgage and Loan Refinancing in a High-Yield Environment
Global public debt crossing critical thresholds has kept central bank policies volatile, resulting in fluctuating US Treasury yields throughout 2026. For homeowners and commercial property holders burdened by previous high-interest borrowing cycles, finding optimal refinance windows has become a high-stakes financial puzzle. Stalled disinflation and stubborn employment numbers mean rate cuts are incremental, requiring borrowers to act with precision.
Timing your mortgage or commercial loan refinance in this environment requires a deep understanding of yield curve movements and lender risk appetites.
Decoding 2026 Refinance Dynamics
The 10-Year Treasury Yield Benchmark
Mortgage rates continue to track closely with the 10-year US Treasury yield. When macroeconomic anxiety spikes debt issuance, yields rise, tightening consumer borrowing capacity. Savvy borrowers monitor weekly Treasury auctions to lock in rates during brief dip windows.
Hybrid ARMs and Alternative Structures
With fixed rates remaining elevated, 7/1 and 10/1 adjustable-rate mortgages (ARMs) have surged in popularity. These products offer lower initial monthly payments, giving borrowers breathing room until central bank easing cycles fully materialize.
| Loan Product | Current Rate Range | Best For | Key Risk Factor |
| 30-Year Fixed Mortgage | 6.2% – 6.8% | Long-term predictability | Higher initial monthly outlay |
| 7/1 Hybrid ARM | 5.5% – 5.9% | Short-term ownership / flipping | Rate reset risk after year 7 |
| Commercial Refinance | 7.0% – 8.2% | Corporate asset restructuring | Strict DSCR lender covenants |
Actionable Steps for Successful Refinancing
To maximize your chances of securing favorable refinance terms in a volatile market, follow a disciplined preparation strategy.
Boost Your Credit Score Immediately: Lenders in 2026 are applying stringent credit tiering; a 20-point increase can drop your APR by a crucial quarter-point.
Shop Regional Credit Unions: Smaller financial institutions often offer portfolio loans with more flexible underwriting than major national banks.
Calculate the Break-Even Point: Ensure your total closing costs are recouped through monthly savings within 24 months of closing.
“Market Strategist View: Refinancing in 2026 is an exercise in opportunistic timing. Borrowers must maintain immaculate financial profiles ready to strike the moment Treasury yields dip.”
Mastering the complexities of today’s debt environment ensures you can successfully lower your debt service costs and protect your long-term financial stability.
Discover more from The Economy
Subscribe to get the latest posts sent to your email.

The days of pulling generic auto insurance quotes based purely on your zip code and age are officially over. In 2026, insurance comparison engines are powered entirely by generative AI and real-time telematics. These platforms digest thousands of live data points—ranging from your driving smoothness via connected vehicle sensors to real-time traffic congestion patterns—to generate hyper-personalized premiums instantly.
For consumers, this evolution represents both a massive opportunity for savings and a hidden trap for penalty pricing. Understanding how AI algorithms evaluate risk is essential for anyone looking to lower their monthly auto insurance premiums.
How AI Comparison Engines Evaluate Your Risk Profile
Behavioral Telematics and Connected Cars
Modern cars stream performance data directly to insurance aggregators. Generative AI models analyze braking sharpness, acceleration curves, cornering G-forces, and phone distraction metrics. Drivers who maintain smooth, defensive habits are rewarded with dynamic rate cuts of up to 40% compared to traditional rating tiers.
Predictive Traffic and Weather Modeling
AI tools now cross-reference your daily commute route with predictive weather and accident probability models. If your standard parking location or driving corridor has a statistically higher incidence of uninsured motorist claims, your quotes will reflect that hyper-local risk assessment.
| Comparison Factor | Traditional Rating Model | 2026 Generative AI Model | Impact on Premium |
| Mileage & Usage | Annual estimated odometer reading | GPS tracking & live trip duration | High (up to 35% savings) |
| Driving Behavior | MVR driving record & accidents | Real-time braking, speed, & G-force | Critical (determines tier) |
| Vehicle Tech | Make, model, and safety rating | ADAS calibration & repair cost data | Moderate |
Strategies to Lower Your AI-Driven Insurance Quote
To outsmart the algorithm and secure the lowest possible premium in 2026, drivers must proactively manage their digital footprint on insurance platforms.
Opt-In for Telematics Trial Periods: Many insurers offer immediate 15% discounts just for installing their driving app; let it track safe habits for 30 days to lock in permanent savings.
Scrub Unverified Public Records: Ensure your motor vehicle report is free of clerical errors that AI risk models misinterpret as reckless behavior.
Compare AI Aggregators: Use platforms that integrate multi-carrier API feeds rather than single-brand comparison sites to find the best risk-adjusted rate.
“Industry Note: AI-driven pricing rewards transparency and precision. Drivers who actively manage their telematics data consistently out-save those relying on legacy quote calculators.”
Embracing AI comparison tools allows savvy policyholders to customize coverage limits precisely to their driving habits, eliminating wasted premium spend while ensuring robust protection.
Discover more from The Economy
Subscribe to get the latest posts sent to your email.

Despite decades of bans and strict handling mandates, asbestos remains a silent killer across legacy manufacturing plants, shipyards, and modern green-energy infrastructure retrofits. In 2026, regulatory changes by the EPA and tightened occupational health standards have triggered a fresh wave of mesothelioma litigation. Manufacturers attempting to fast-track industrial transitions are encountering catastrophic oversight, exposing workers to legacy toxins and opening corporate parent companies to unprecedented liability.
Navigating a mesothelioma claim in 2026 requires understanding how modern industrial supply chains intersect with historical exposure. Trusts established decades ago are being audited under stricter transparency laws, altering payout ratios and accelerating fast-track settlements for terminally ill plaintiffs.
Modern Industrial Exposure Hotspots
Green Retrofitting and Renewable Energy Infrastructure
A primary source of 2026 asbestos exposure occurs during the decommissioning and retrofitting of older industrial facilities for renewable energy production. Workers insulating electrical grids, modernizing HVAC systems, or upgrading manufacturing floors frequently disturb encapsulated asbestos materials that were improperly documented or ignored during facility audits.
Automotive and Aerospace Supply Chains
With advanced manufacturing booming, workers handling specialized friction materials, gaskets, and heat shields face ongoing risks. Supply chain tracing has become more sophisticated, allowing legal teams to pinpoint exact corporate entities responsible for raw material distribution across multinational borders.
| Industry Sector | Primary Exposure Risk | Legal Venue / Trust | Avg. Claim Value Range |
| Green Energy Retrofit | Disturbed insulation, pipe lagging | Federal Tort / Manufacturer Trust | $1.2M – $3.5M |
| Shipbuilding & Marine | Boiler insulation, structural seals | Asbestos Bankruptcy Trusts | $800K – $2.4M |
| Automotive Manufacturing | Brake components, high-heat gaskets | Third-Party Product Liability | $600K – $1.8M |
Securing Maximum Compensation: Steps for Plaintiffs
Time is of the essence in mesothelioma cases. Plaintiffs and their families must act decisively to secure financial recovery before statutes of limitations expire.
Retain Specialized Counsel: Work exclusively with national mesothelioma law firms possessing deep historical databases of asbestos-containing products.
Audit Employment History: Document every job site, supervisor name, and equipment brand encountered throughout your career.
Expedite Medical Filings: Secure a formal pathological diagnosis quickly to qualify for expedited trust fund distribution and priority trial settings.
“Expert Insight: Modern asbestos litigation is no longer just about historical tracking; it is about holding modern corporations accountable for failing to conduct rigorous environmental safety audits before initiating industrial retrofits.”
By combining meticulous work history reconstruction with aggressive multi-trust filings, victims can secure substantial financial relief to cover specialized immunotherapy and family support.
Discover more from The Economy
Subscribe to get the latest posts sent to your email.

Balance of Payments (BOP)

The Falkland Islands Dispute: Sovereign Wealth, Offshore Drilling, and Market Impacts

Gross Domestic Product (GDP): Nominal vs. Real

What is Inflation and the Consumer Price Index (CPI)?

US-China Trade Competition 2026: Supply Chain Relocation Guide

Oil Prices Break $100 in 2026: Middle East Conflict & Energy Markets

South-South Trade Expansion: Digital Integration and Emerging Market Growth

$166B Tariff Refund Tapering Fast: Is Your Business Missing Out?

Stock Market Today: Dow Climbs 500 Points as Markets Shake Off Inflation Jitters

14th WTO Conference 2026: Tariffs & Global Supply Chain Impact

Swish Secures $24M Funding to Disrupt India’s $100B Food Market

Physical AI and Driverless Tech: The Next Trillion-Dollar Industrial Revolution

Enterprise AI Platforms Disrupting B2B SaaS in 2026: Full Analysis

Crypto vs. Safe Haven Assets 2026: Where Institutions Are Hedging

State Farm’s $5B Dividend 2026: Who Qualifies & Payout Dates

US-China Relations in Q3 2026: Trade Tariffs and Supply Chain Risks

Gold’s Wild 2026: From a Record $5,600 Peak to a 24% Crash and Back Toward $4,500

Oil Surges as Strait of Hormuz Traffic Collapses Again

The Rocket That Won’t Quit: Inside SpaceX’s Falcon 9 Launch Machine

Bank of England Set to Hold Rates Through Year-End, Reuters Poll Shows

SpaceX Starship Flight 14: First Orbital Attempt & Starlink V3 Launch Explained

The 2026 Crypto Regulatory Shift: What It Means for Institutional Investors

AI Chip Stocks 2026: The Best Semiconductor Investments Beyond Marvell

Retail Earnings Week: What Home Depot, Target & Walmart Reveal

AI-Powered Training: The Next Multi-Billion Dollar Ecosystem in Fitness

Russia’s Black Sea Oil Exports Fall for a Fifth Straight Week

Global Chip Selloff Deepens: What’s Driving the Aug. 19 Semiconductor Rout

Tween Back-to-School Trends 2026: What’s Driving the $85B Season
-

 Markets & Finance8 months ago
Top 15 Stocks for Investment in 2026 in PSX: Your Complete Guide to Pakistan’s Best Investment Opportunities
-

 Analysis7 months ago
Johor’s Investment Boom: The Hidden Costs Behind Malaysia’s Most Ambitious Economic Surge
-

 Analysis7 months ago
Top 10 Stocks for Investment in PSX for Quick Returns in 2026
-

 Analysis7 months ago
Brazil’s Rare Earth Race: US, EU, and China Compete for Critical Minerals as Tensions Rise
-

 Banks8 months ago
Best Investments in Pakistan 2026: Top 10 Low-Price Shares and Long-Term Picks for the PSX
-

 Investment8 months ago
Top 10 Mutual Fund Managers in Pakistan for Investment in 2026: A Comprehensive Guide for Optimal Returns
-

 Global Economy9 months ago
15 Most Lucrative Sectors for Investment in Pakistan: A 2025 Data-Driven Analysis
-

 Global Economy9 months ago
Pakistan’s Export Goldmine: 10 Game-Changing Markets Where Pakistani Businesses Are Winning Big in 2025