
Analysis
How a Chinese Engineer Built a Billion-Dollar Empire with Robotic ‘Eyes’


Inside Orbbec’s 3D Vision Revolution: How Howard Huang’s Technology Powers China’s Humanoid Robot Boom and Reshapes Global Markets
BEIJING — On a sweltering August afternoon in 2025, a sleek humanoid robot named Tiangong Ultra streaked across a specially modified track at Beijing’s National Speed Skating Oval, completing the 100-meter sprint in 21.50 seconds. While nowhere near Usain Bolt’s record, the achievement marked something far more significant: the first fully autonomous humanoid to win a track event at the inaugural World Humanoid Robot Games. Behind the robot’s uncanny ability to navigate, perceive depth, and avoid obstacles lay a critical component most spectators overlooked—a pair of 3D vision cameras manufactured by a Shenzhen-based company called Orbbec.
Those robotic “eyes” have made their creator, 45-year-old engineer Howard Huang (Huang Yuanhao), a billionaire. As China’s artificial intelligence and robotics sectors explode, Orbbec has emerged as the invisible backbone of the nation’s humanoid robot revolution—and Huang’s personal fortune has soared alongside it. With Orbbec’s stock surging over 315% in the past year and reaching a market capitalization of approximately $5.2 billion, Forbes estimates Huang’s net worth at $1.4 billion, making him one of China’s newest tech tycoons.
Yet Huang’s journey from MIT-trained optical physicist to billionaire entrepreneur illuminates more than just a personal success story. It reveals how China is methodically constructing dominance in the robotics sector, building an ecosystem that spans from chip design to system integration, from academic research to commercial deployment. And at the center of this strategic push sits Orbbec’s technology—the depth-sensing cameras that give machines the spatial awareness they need to function in the real world.
The Rise of Robotic ‘Eyes’: From Academic Labs to Robot Marathon Winners
Howard Huang’s path to robotics royalty began not in boardrooms but in laboratories. After earning his PhD from City University of Hong Kong, specializing in optical measurement and laser speckle interferometry, Huang spent years as a postdoctoral researcher at the Singapore-MIT Alliance for Research and Technology (SMART) Center. His academic work produced over 40 published papers on 3D scanning technology—research that would later become the foundation for Orbbec’s proprietary depth-sensing systems.
In 2013, Huang founded Orbbec in Shenzhen with a singular vision: to “create 3D vision for a 3D world.” The timing proved prescient. Intel’s RealSense cameras had validated the market for depth-sensing technology, but Huang saw an opportunity to build something more comprehensive. Where competitors purchased components and assembled them, Orbbec developed its own chips from scratch—a vertically integrated approach that would later give the company crucial advantages in cost and customization.
“My motto is: ‘Climb the highest peaks in the best of times, and tackle the toughest challenges in the most cutting-edge industries,'” Huang told City University of Hong Kong in an August 2025 interview. “Achieving global influence in the robotics industry—that is the highest peak we aim to conquer.”
The company’s 3D vision cameras work by projecting structured light or using stereo vision to create detailed depth maps—enabling robots to perceive three-dimensional space much like human eyes do, but with millimeter-level precision. Orbbec’s RGBD (Red, Green, Blue, Depth) cameras combine traditional color imaging with depth sensing, giving robots the ability to identify objects, measure distances, and navigate complex environments in real-time. This technology has applications far beyond robotics: facial recognition for contactless payments, 3D scanning for industrial measurement, and autonomous navigation for warehouse logistics.
China’s Robot Craze: The Perfect Storm for Orbbec’s Ascent
Orbbec’s explosive growth coincides with—and directly fuels—China’s unprecedented push into humanoid robotics. The numbers tell a compelling story. According to the 2025 World Humanoid Robot Games, held in Beijing from August 15-17, 280 teams from 16 countries competed with over 500 humanoid robots across 26 events. Chinese robots dominated: Unitree Robotics swept medals in the 1,500-meter, 400-meter, and relay races, while Beijing’s Tiangong Ultra—powered by Orbbec cameras—won the 100-meter sprint and had earlier become the first humanoid to complete a half-marathon.
These aren’t just publicity stunts. The games revealed the real-world capabilities that Chinese manufacturers are racing to commercialize. Robots sorted medicine, handled logistics, cleaned hotel rooms, and performed industrial tasks—all applications where Orbbec’s depth-sensing technology provides critical advantages. Ant Group’s wheeled robot R1, unveiled in September 2025, uses advanced Orbbec 3D cameras. So does state-backed X-Humanoid’s flagship Tiangong 3.0 platform, which recently achieved “the first full-size humanoid robot capable of touch-interactive, high-dynamic whole-body control.”
The broader Chinese robotics market reflects this momentum. According to the International Federation of Robotics (IFR), China installed over 276,000 industrial robots in 2023—more than 51% of the global total. The nation’s robot density in manufacturing reached 392 robots per 10,000 employees, up from virtually zero two decades ago. Statista projects the global robotics market will reach $205 billion by 2030, with China commanding the lion’s share of production capacity and an increasingly large portion of innovation.
Shenzhen’s manufacturing ecosystem has proved particularly fertile ground for Orbbec. The city’s unmatched supply chains allow rapid prototyping and scaling—advantages that Western competitors struggle to match. When Intel controversially announced in 2021 it was “winding down” RealSense camera production (the decision was later reversed, but the division was eventually spun out in July 2025), Orbbec moved swiftly to capture market share, hiring former Intel RealSense sales leader Mike McSweeney as Vice President of Sales in 2024.
Outpacing Global Competitors: The Technology War Heats Up
In the high-stakes 3D vision market, Orbbec faces formidable competitors—yet has systematically carved out advantages. Intel’s RealSense, now operating independently after its July 2025 spin-out with $50 million in funding, remains a major player. The company’s new D555 camera, featuring 5 TOPS of onboard AI compute, targets industrial robotics with advanced edge processing. RealSense claims to work with 60% of AMR and humanoid developers, including high-profile clients like Agility Robotics and Geek+.
Yet Orbbec has competitive edges that extend beyond technology. Independent testing by OpenCV researchers comparing Orbbec’s Gemini 2 L against RealSense D455 found Orbbec cameras delivered lower temporal noise (0.15mm vs. 1.41mm) and more stable depth images in challenging conditions. While RealSense’s D455 performed better in certain scenarios involving strong light reflections, Orbbec’s newer Gemini 2 XL addressed many of these limitations.
More critically, Orbbec offers superior pricing and customization. Where RealSense cameras must serve a global market with standardized products, Orbbec can rapidly develop specialized versions for Chinese robotics companies. The company’s Gemini 435Le, priced competitively around $499, claims 30-50% better depth precision than comparable alternatives while maintaining the same price point. For cost-sensitive Chinese manufacturers racing to scale production, this value proposition proves compelling.
Other competitors include Luxonis (focusing on embedded AI cameras), Zivid (industrial 3D cameras), and various Chinese players. But none combine Orbbec’s vertically integrated manufacturing, local market access, and proven track record in humanoid robotics. According to market research firm Interact Analysis, Orbbec held a commanding 72% market share in South Korea’s mobile robot 3D vision market in 2024—a testament to its competitive strength even in export markets.
The Business Model: From Facial Recognition to Humanoid Robots
Orbbec went public on Shanghai’s STAR Market (ticker: 688322) in July 2022, raising 1.2 billion yuan ($170 million) in its IPO. The company’s subsequent financial performance has been volatile but increasingly positive. In the first half of 2025, Orbbec posted net profit of 30 million yuan ($4.1 million), reversing an 81 million yuan loss from the same period in 2024. Revenue more than doubled to 436 million yuan, with 62% still coming from facial recognition modules for retail and healthcare—not robotics.
This reveals both Orbbec’s current business reality and its future trajectory. The company’s bread-and-butter revenue comes from 3D cameras used in China’s ubiquitous contactless payment systems and medical insurance verification kiosks. Jack Ma’s Ant Group, which deployed Orbbec cameras in millions of Alipay terminals, remains a critical customer. But robotics represents the growth engine. In September 2025, Orbbec announced plans to raise up to 1.9 billion yuan ($262 million) through private placement, specifically targeting “AI vision and spatial perception technology” for robotics. Management projects robotics revenue will grow at a compound annual rate of approximately 100% over the next three to five years.
Huang, who holds a 27% stake in Orbbec, has seen his paper wealth fluctuate with the stock’s dramatic swings. Trading around 103 yuan per share in mid-February 2026 (up from lows of 41.53 yuan in early 2025), the stock remains highly volatile—reflecting both investor enthusiasm for China’s robot boom and uncertainty about when humanoid robots will achieve mass-market adoption. Analysts note that with a price-to-earnings ratio exceeding 395, Orbbec is priced for perfection, betting that robotics revenue will eventually dwarf the company’s current facial recognition business.
Global Implications: The New Technology Arms Race
Orbbec’s success sits at the intersection of several global trends that extend far beyond one company’s fortunes. First, it exemplifies China’s systematic approach to achieving technological self-sufficiency. Unlike previous generations of Chinese tech companies that relied on foreign components, Orbbec designs its own photosensitive chips, depth computation algorithms, and system architectures. This vertical integration insulates the company from supply chain disruptions and potential sanctions—a strategic priority as U.S.-China tech rivalry intensifies.
Second, the company’s growth underscores how China’s manufacturing advantages extend beyond low-cost labor to encompass entire industrial ecosystems. Shenzhen’s electronics supply chains, talent pools, and rapid iteration cycles allow companies like Orbbec to move from prototype to production at speeds unmatched in the West. When Orbbec needs a custom chip or modified optical system, local suppliers can deliver in weeks, not months.
Third, robotics raises profound questions about labor markets and economic disruption. According to IFR research, more than half of manufacturing operators will work alongside robots by 2034. In China, where youth unemployment already exceeds 15% in some regions, the robot revolution presents both opportunity and risk. Orbbec’s cameras enable automation that could displace millions of factory workers—even as they create new roles in robot maintenance, programming, and oversight.
Western policymakers are taking notice. The U.S. Department of Commerce has added various Chinese robotics and AI companies to export control lists, citing national security concerns. While Orbbec isn’t currently targeted, the company’s deep integration into China’s military-civil fusion strategy—Huang serves as a guest professor at Peking University’s robotics program—makes future restrictions plausible. For now, Orbbec sells globally: its cameras power robots in South Korea, Japan, and increasingly Europe, though the company has been cautious about expanding too aggressively into the U.S. market.
The Road Ahead: Challenges and Opportunities
For all Orbbec’s success, significant challenges loom. The humanoid robotics market remains largely speculative—full of impressive demos but limited commercial deployment outside controlled environments. Tesla, Figure AI, and other Western competitors are racing to develop general-purpose humanoids that could render specialized Chinese robots obsolete. Boston Dynamics’ Atlas, recently upgraded with electric actuators, demonstrates capabilities that still exceed most Chinese humanoids.
Orbbec also faces potential technical disruption. The rapid advance of end-to-end AI vision systems—where neural networks process raw camera feeds directly—could reduce demand for specialized depth cameras. NVIDIA’s latest robotics platforms, including the Jetson Thor module announced in 2025, increasingly handle depth perception through AI rather than hardware sensors. Orbbec is hedging by developing AI-enhanced cameras, but the company’s core value proposition could erode if pure computer vision proves sufficient.
Financial sustainability remains uncertain. Despite revenue growth, Orbbec reported negative free cash flow of -247 million yuan in the past 12 months as of late 2025. Heavy R&D spending—necessary to stay ahead of competitors—consumes much of the company’s revenue. The planned 1.9 billion yuan capital raise will provide runway, but investor patience may wear thin if robotics revenue doesn’t accelerate quickly.
Yet Huang remains bullish. At CES 2026 in January, Orbbec unveiled the ultra-compact Gemini 305 camera specifically designed for robotic arms, alongside announcements of full compatibility with NVIDIA’s Jetson Thor platform. The company is also expanding manufacturing capacity, establishing a dual-hub strategy across China and Vietnam to mitigate geopolitical risks. Partnerships with major chipmakers like MediaTek (an investor) and platform providers like NVIDIA suggest Orbbec is being woven into the broader robotics technology stack.
The Bigger Picture: What Orbbec’s Rise Tells Us
Howard Huang’s journey from MIT researcher to billionaire robotics magnate encapsulates a broader shift in global innovation leadership. China is no longer playing catch-up in advanced technologies—it’s increasingly setting the pace, particularly in fields like robotics where manufacturing prowess and scale advantages matter most.
Orbbec’s 3D cameras won’t make headlines the way flashy humanoid robots do. But they represent the unsexy infrastructure—the picks and shovels—of the robot revolution. Just as NVIDIA grew rich selling GPUs during the AI boom, Orbbec is positioned to profit regardless of which specific robot manufacturer wins the humanoid race. As long as robots need to see, Orbbec has a product to sell.
The World Humanoid Robot Games in Beijing may have seemed like spectacle—clumsy robots stumbling through sprints and football matches. But they previewed a future that’s arriving faster than most anticipated. A future where Chinese companies like Orbbec don’t just participate in global technology markets—they define them. Where a trained engineer’s vision for “3D vision in a 3D world” becomes the foundation of billion-dollar fortunes. And where the eyes of tomorrow’s robots, seeing the world with inhuman precision, bear the mark “Made in Shenzhen.”
For Western competitors and policymakers, Orbbec’s ascent poses an uncomfortable question: In the race to build the robots of tomorrow, who is really seeing clearly?
Key Sources and Further Reading
• Forbes: “How A Chinese Engineer Became A Billionaire Making Robotic ‘Eyes'” – Primary source on Huang’s net worth and Orbbec’s market performance
• Orbbec Official Website – Company technology specifications, product lines, and corporate announcements
• Global Times: “First World Humanoid Robot Games conclude” – Coverage of the Beijing robot games and Chinese robotics achievements
• The Robot Report: “After Intel exit, RealSense maps its own future” – Analysis of competitive landscape in 3D vision market
• OpenCV: “A Quick Comparison of the Orbbec and RealSense 3D Cameras” – Independent technical comparison of depth camera performance
• Statista: Global Robotics Market Forecast – Market size projections and industry growth data
• International Federation of Robotics (IFR) World Robotics 2024 Report – Authoritative data on global robot deployment and manufacturing trends
Discover more from The Economy
Subscribe to get the latest posts sent to your email.



China’s global hunt for billions in unpaid taxes is rewriting the rules for its wealthy citizens.
Just after the Lunar New Year in 2026, a Shenzhen-based family office manager began fielding a new, unwelcome kind of call from his clients. Chinese tax authorities were asking them to settle liabilities on overseas capital gains—some dating back to 2017, others as far as 2000. He had no explanation for the arbitrary five-year window, only the stark reality of a new era: the era of Beijing’s global tax hunt.
Within weeks, the picture became clearer and more alarming for the country’s ultra-wealthy. Banks in mainland China had received instructions to freeze the accounts of wealthy depositors until they could prove taxes on foreign assets, trusts, and investments had been paid. As one banker put it, speaking to the Financial Times under the condition of anonymity: “These wealthy individuals now immediately need to pay penalties and taxes in cash to reactivate their accounts.” The policy response is unambiguous: the People’s Republic has launched a campaign to recover what it believes to be hundreds of billions of dollars in unpaid taxes.
It is, by any measure, a foundational shift in China’s fiscal policy, prompted by a grinding budget deficit and a genuine overhaul of its tax system to align more closely with the United States’ model of global taxation.
The Crunch and the Crackdown
The reason for the campaign’s urgency is a stark one: Beijing is running out of money. The traditional engines of state revenue have seized. Total government land sales, once a core source of funding for local governments, have collapsed from a peak of 8.7 trillion yuan ($1.3 trillion) in 2021 to just 4.15 trillion yuan after the spectacular unwinding of the property market .
This is not a short-term liquidity crisis. It is a structural fiscal realignment. Since the pandemic, overall budget revenue in China has largely stagnated, falling by 1.7% to 21.6 trillion yuan ($3.2 trillion) in 2025 . With the property sector no longer the reliable cash cow it once was, the state has been forced to look elsewhere, and it has set its sights on the billions of dollars in wealth held offshore by its citizens. The State Taxation Administration and the Ministry of Finance confirmed the new measures, formalising a pursuit that was already well underway .
This is the hard data behind the crackdown: a fiscal imperative. It signals that the government is willing to reach decades back into the past—some accounts are being scrutinised as far back as the year 2000—to plug the hole in the present.
The Core Development: A Data-Driven Manhunt
What makes this campaign different from previous sporadic efforts is its technological sophistication and its sheer scope. The hunt is not merely targeted; it is systematic and data-driven.
Chinese authorities are leveraging the full force of modern financial surveillance, utilising data obtained through the OECD’s Common Reporting Standard (CRS), which China has been an active participant in since 2018. As tax lawyer Ye Yongqing of Anli Partners noted, regulators are steadily strengthening the supervision of cross-border capital flows and foreign exchange transactions, narrowing the scope for wealthy Chinese to transfer assets offshore .
Private bankers and wealth managers are already seeing the impact. Singapore-based bankers who manage assets for Chinese families have confirmed that new rules on foreign trusts have “shocked” their clients . Last month, China introduced comprehensive tax rules on assets transferred to foreign trusts, closing a long-standing loophole. Under the new regime, income generated by overseas trusts will be taxed at 20% across multiple stages.
The specific assets under scrutiny are varied, including real estate, stocks, precious metals, and even cryptocurrencies . Financial institutions are being asked to verify whether income from these assets has been declared to Beijing. The retroactive nature of the campaign—in some cases extending more than 25 years—has been confirmed by multiple officials, bankers, and advisors .
Why are banks freezing accounts?
Chinese banks have been instructed to cooperate with tax authorities by freezing the accounts of wealthy depositors until they settle tax liabilities on their overseas assets. This includes gains from foreign stocks, real estate, trusts, and insurance policies. The freeze is only lifted when the individual pays the outstanding tax and penalties in cash, creating powerful leverage for the state to enforce compliance quickly.
An American Model, A Chinese Reality
The structural ambition of this campaign reaches well beyond a one-off tax grab. It represents a deliberate strategy to move China’s tax system closer to the US model.
Just as the US Internal Revenue Service taxes American citizens on their worldwide income regardless of where they reside, China is beginning to adopt a similar territorial approach. This is a significant escalation. For years, wealthy Chinese individuals have used offshore trusts and other complex structures to defer or eliminate tax liabilities on foreign earnings. These structures were often established during the heyday of Hong Kong IPOs, providing a “perfect income tax shield,” according to a Singapore-based banker . The new rules aim to dismantle those shields.
The implications are profound. When the taxman begins to treat offshore gains the same as domestic profits, the calculus of wealth management for high-net-worth individuals changes entirely. As Ye Yongqing noted, this “reduces the scope for wealthy Chinese to transfer their assets abroad or structure their tax affairs through offshore vehicles” .
Victor Shih, a professor of political economy at the University of California, San Diego, summed up the driving force simply: “The motive behind the new campaign is clearly fiscal” . That fiscal necessity is now reshaping the legal architecture of Chinese wealth.
The Second-Order Effects: Compliance and Capital Flight
Downstream consequences of this policy are already rippling through the economy and across borders.
For those in the cross-border trade business, the squeeze is tangible. Zhejiang-based exporter Henry Huang told the South China Morning Post that the heightened scrutiny of unreported overseas income is “taking a real bite out of profits,” forcing him to rethink cross-border operations with little room to pass on costs to price-sensitive US and European customers .
Chinese authorities are also ramping up the legal and psychological pressure. The public security ministry’s “Fox Hunt” campaign, which focuses on extraditing economic fugitives, has already captured over 880 overseas suspects, demonstrating a hardened stance on economic crime .
Yet the most significant risk might be a self-inflicted wound. There is a growing concern that such an aggressive enforcement posture, while potentially lucrative, could accelerate the very capital flight it is designed to reverse. If the wealthy feel they are being pursued relentlessly and facing punitive fines, they may seek to move not just their cash but their entire operations to jurisdictions they perceive as safer.
A Dissenting View: The Cost of Compliance
Of course, the narrative is not without its critics. Some experts warn that the crackdown could have unintended consequences that outweigh the potential revenue gains. The shift in policy, while designed to boost state coffers, might create an exodus of talent and capital.
Furthermore, the operational challenges for tax authorities are immense. While big data and the CRS give them a new level of visibility, they are still largely in the dark about the total quantum of overseas assets. A Bloomberg report from January noted that “even in Beijing’s tightly controlled society, the crackdown is proving spotty,” with local authorities largely unaware of the amount of wealth stashed abroad .
The risk is that a “one-size-fits-all” approach could drive the most mobile taxpayers away. A banker in Singapore managing Chinese wealth observed that many trust owners now face “one-off tax liabilities” and may be forced to sell assets to cover the bills . The campaign may ultimately shrink the tax base it is trying to capture, a classic Laffer Curve dilemma applied to capital.
The “global tax hunt” is, at its heart, a story of transformation. It illustrates a China trying to build a modern welfare state without the traditional safety net of property speculation. The era of the tax-free offshore account for Chinese citizens is ending, not with a whimper but with a series of account freezes and data-driven audits. The policy represents a historic pivot, a move to international norms that at once strengthens Beijing’s fiscal position and challenges the global mobility of its wealthiest citizens. The state’s appetite for its own citizens’ foreign wealth has only just begun, and it is ravenous.
Discover more from The Economy
Subscribe to get the latest posts sent to your email.
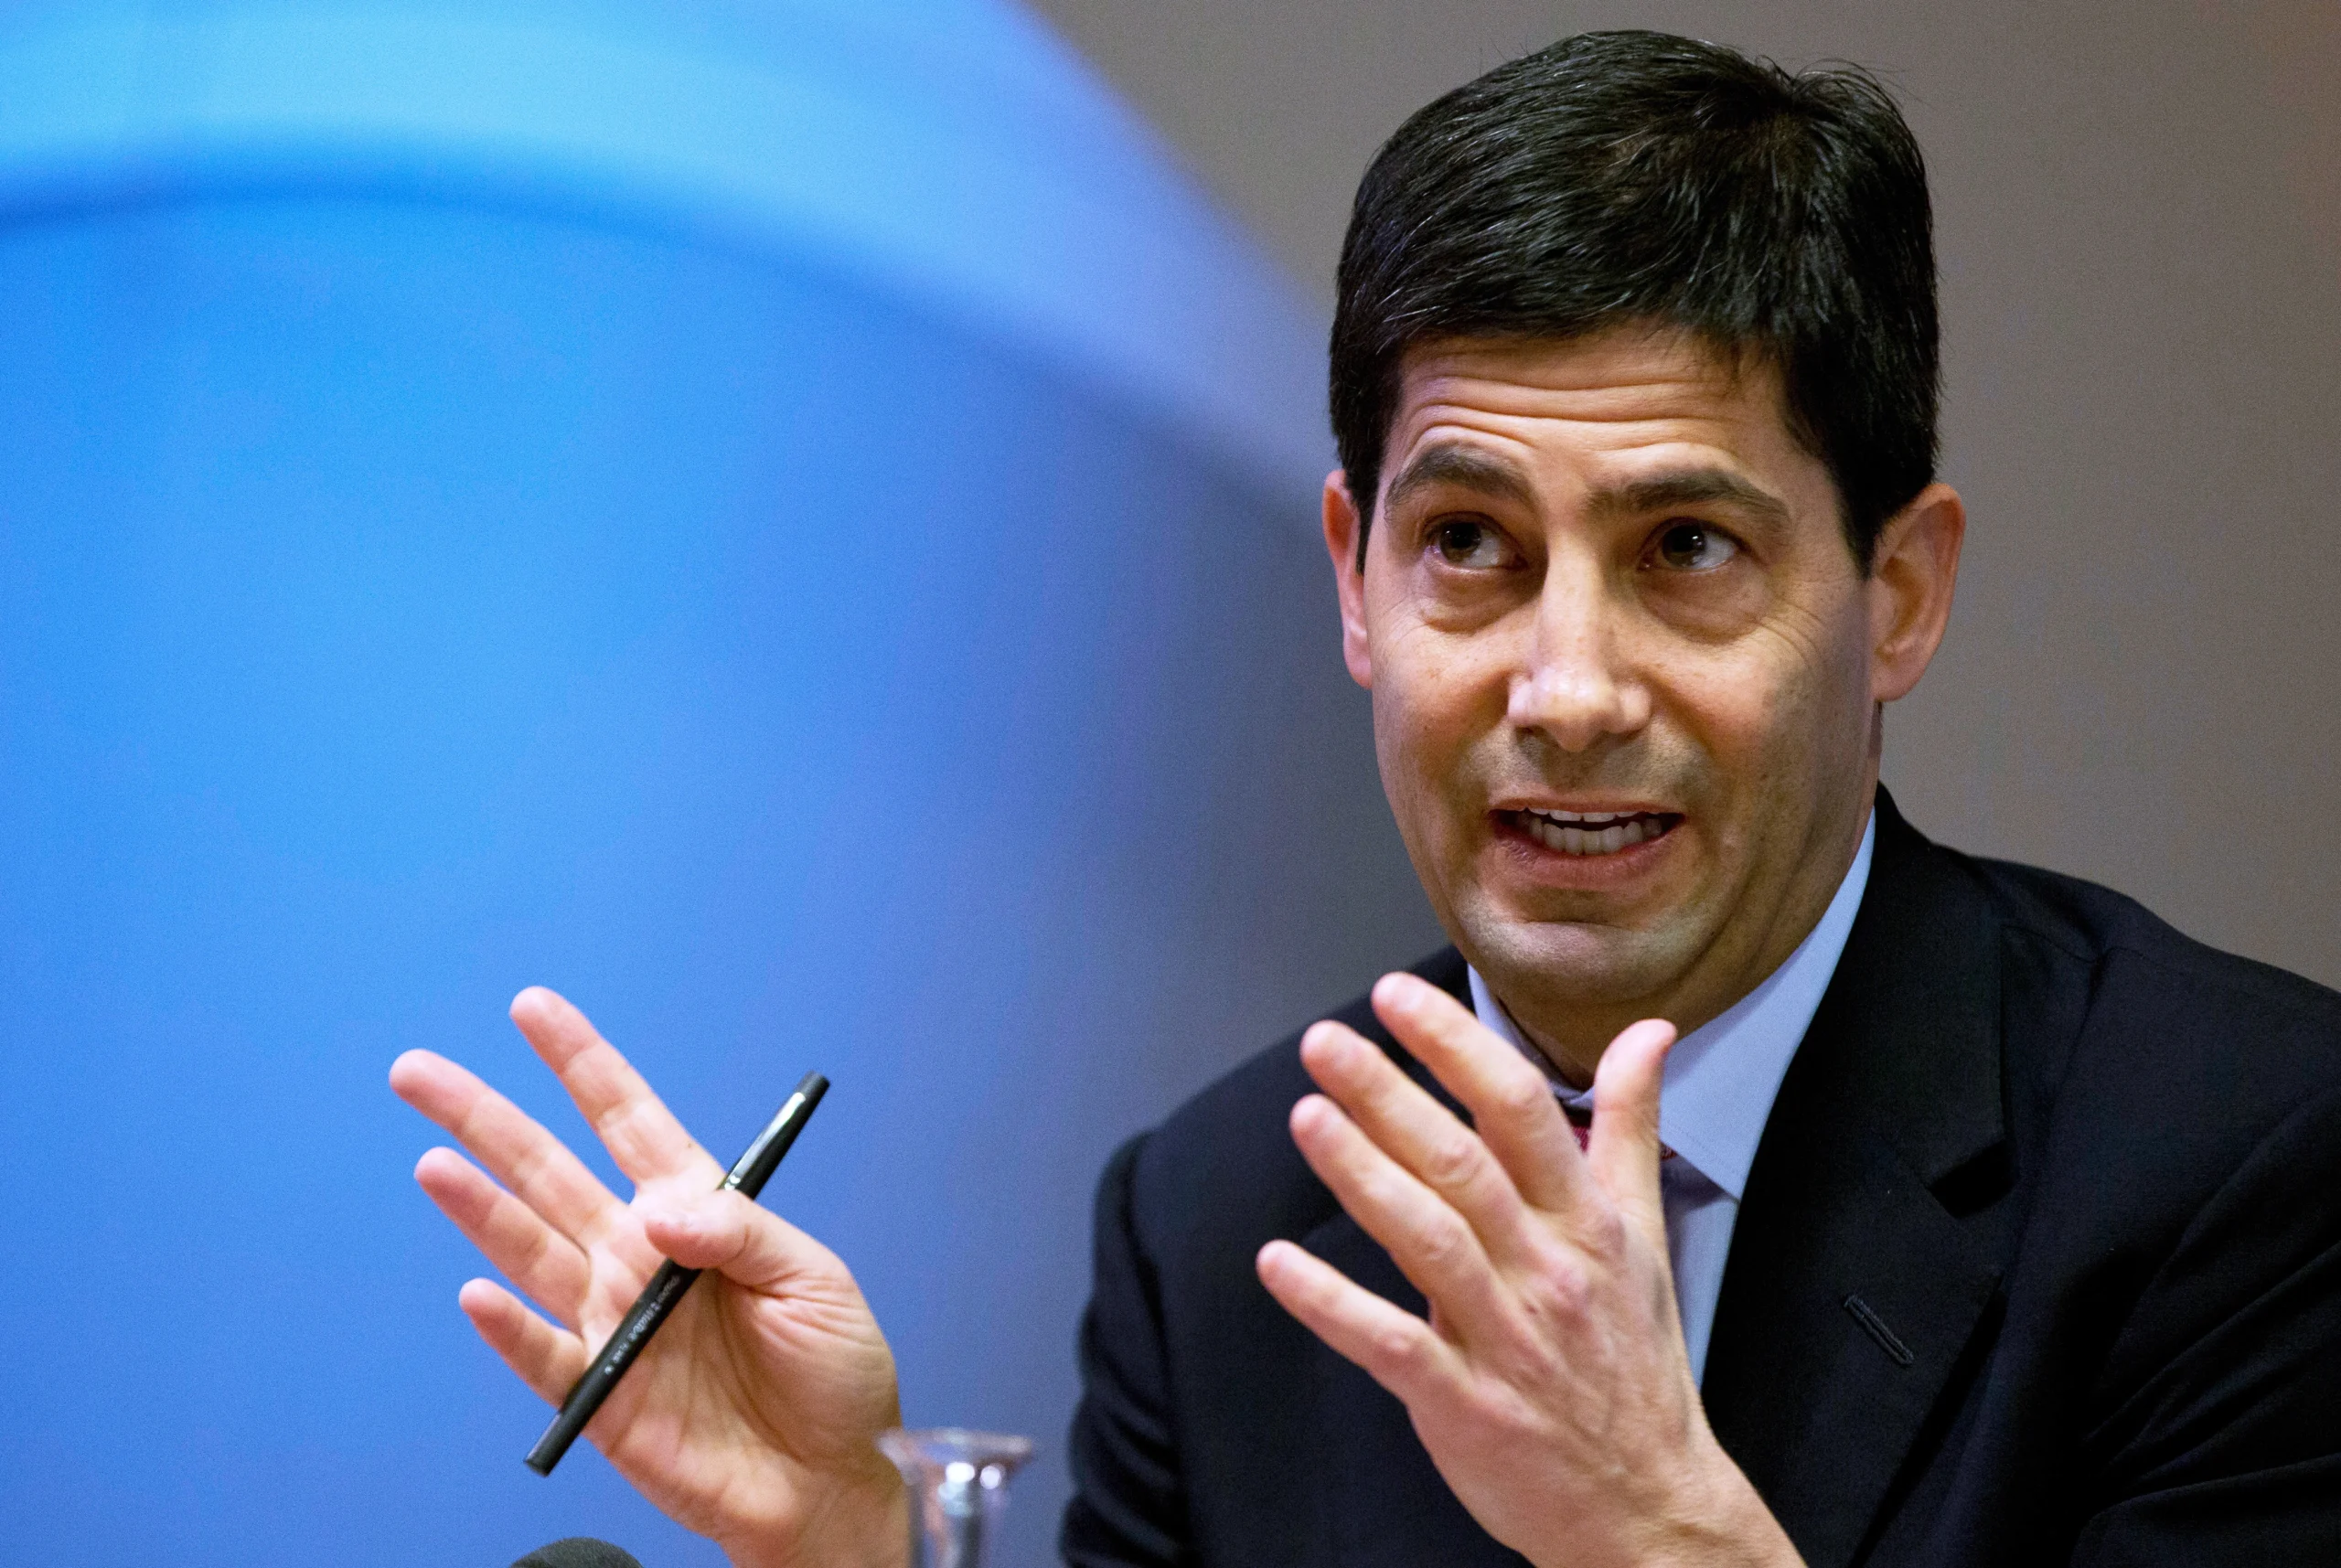
The Federal Reserve’s rate-setting committee held its benchmark borrowing rate steady on July 29, keeping it in a range of 3.5% to 3.75% — but the calm on the surface masked one of the most contested votes of the post-pandemic era. The Federal Open Market Committee split 9 to 3, with three members pushing to raise rates rather than hold, according to NPR’s coverage of the decision.
Chair Kevin Warsh, who took over the Eccles Building earlier this year after a nomination process that rattled bond markets, used his post-meeting press conference to make a point of not making a point. Rather than signal where rates are headed next, Warsh told reporters the Fed would judge market reaction “direct and unfiltered” instead of offering the rolling forecasts investors have come to expect, a stance detailed in CNBC’s meeting recap.
A rate hike was genuinely on the table
What made this meeting unusual wasn’t just the dissent — it was how close markets came to pricing in a hike rather than a cut. Fed funds futures tracked by CME Group put the odds of a rate increase at roughly 35% heading into the decision, up sharply from 26% a week earlier, according to CNBC’s markets analysis. That is a striking reversal from the rate-cutting cycle many investors had expected when Warsh’s nomination was first floated as a “productivity-led growth” pivot away from his predecessor’s caution.
The market reaction told its own story. The S&P 500 slid roughly 0.6% during Warsh’s press conference, the Dow shed more than 840 points intraday, and the 10-year Treasury yield rose to 4.657%, even as the Fed opted for a hold rather than a hike.
Why Warsh is playing it differently
Warsh’s approach reflects both economic and political calculus. Treasury yields have climbed since the Fed’s prior meeting despite the hold, a dynamic Warsh acknowledged directly. And unlike his predecessor, Warsh has been explicit that he intends to set policy independent of the White House’s preferences — even as he awaits a possible additional ally on the Board once a pending internal review concludes, according to CNBC’s analysis of the political backdrop.
Why this matters beyond Washington
A genuinely undecided Fed has knock-on effects well past US borrowers. Higher-for-longer Treasury yields pull global capital toward dollar assets, complicating rate paths in London, Ottawa, and emerging markets alike — a dynamic playing out in parallel with the UK’s own fiscal squeeze (see our companion report on the Autumn Budget) and China’s deflationary drag on global demand. For businesses and investors across the Gulf, Southeast Asia, and South Asia weighing dollar-denominated debt or dollar-pegged currencies, an unpredictable Fed chair is arguably a bigger variable than the rate level itself.
Discover more from The Economy
Subscribe to get the latest posts sent to your email.
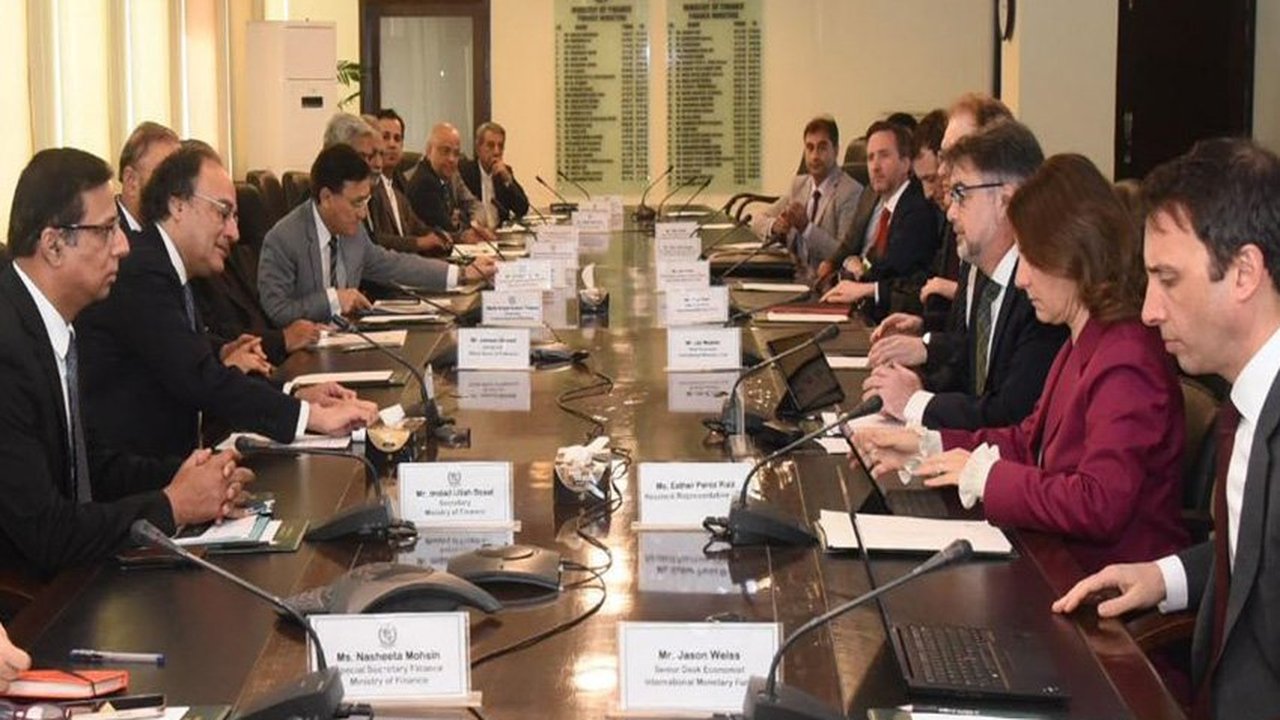
The IMF’s Executive Board completed Pakistan’s third review of its 37-month Extended Fund Facility (EFF) and second review of its Resilience and Sustainability Facility (RSF) on May 8, 2026, unlocking roughly $1.1 billion under the EFF and $220 million under the RSF, according to the IMF’s official statement. Total disbursements under both arrangements now stand at roughly $4.8 billion. Acting Chair Nigel Clarke credited Pakistan’s “strong program implementation” for supporting macroeconomic recovery and building resilience to shocks.
The Genuinely Good Numbers
By the IMF’s own account, the underlying data supports the assessment. GDP growth accelerated to an average of 3.8% year-on-year in the first half of FY26, driven by the auto, construction and garment industries, even accounting for flood disruption in July-August, according to the IMF’s staff report. Inflation, while ticking up to 7.3% year-on-year in March as commodity price pass-through hit domestic energy prices, remained within a broadly contained range, with core inflation at 7.6%. The current account was described as broadly balanced, and reserve rebuilding exceeded earlier projections — the State Bank of Pakistan projects reserves continuing to climb to roughly $18 billion by June 2026, according to analysis from the Islamabad Policy Research Institute.
The State Bank confirmed receipt of $1.3 billion from the IMF on May 12, 2026, according to CSS Prep’s policy analysis, which notes reserves had fallen to dangerously low levels in 2022-2023 before this recovery.
The External Risk the IMF Flagged Explicitly
The Fund’s own report is notably candid about downside exposure: under its April 2026 World Economic Outlook adverse scenario, the cumulative hit to Pakistan’s GDP from continued Middle East conflict could rise to around 1.5 percentage points by FY27, with inflation and the current account deficit each worsening by roughly 1.5-2.5 percentage points of GDP, according to the IMF’s staff country report. Given Pakistan’s reliance on imported energy, oil price volatility discussed in the IMF’s global outlook feeds directly into this specific country risk.
The Reform Question That Keeps Recurring
The structural policy conditions attached to this review read as familiar territory: sustaining fiscal consolidation, broadening the tax base, maintaining tight monetary policy to keep inflation within the State Bank’s target range, and advancing energy-sector reform — commitments the IMF’s own end-of-mission statement described as still “ongoing” rather than complete, per the IMF’s March 2026 mission statement.
A sharper framing comes from Pakistani policy analysts themselves: reforms that would genuinely break the IMF-program cycle — broadening the tax base to include agriculture and retail, ending energy subsidies, privatizing loss-making state-owned enterprises — impose concentrated, visible costs on politically organized interest groups, while the benefits of reversing those costs are diffuse and delayed, according to CSS Prep’s analysis. That political-economy imbalance, the analysis argues, consistently favors populist continuation of stabilization support over the structural reform that would end the need for it — a pattern this third review’s genuine macroeconomic progress doesn’t yet break.
Social Cost of the Adjustment
Pakistan’s poverty headcount rate rose to 25.3% in FY24, up sharply from 18.3% in FY22, driven by overlapping shocks from COVID, floods and inflation, according to the IMF’s staff report. The Benazir Income Support Programme (BISP) remains the primary social protection mechanism absorbing the distributional cost of IMF-mandated energy price increases and fiscal tightening — whether its scale is adequate remains, in the IMF’s own words, a live policy question rather than a settled one.
Discover more from The Economy
Subscribe to get the latest posts sent to your email.

The Taxman Cometh from Beijing

Pakistan IMF Program 2026: Inside the Push Toward an Interest-Free Economy

Russia Oil Revenue 2026: How Sanctions on Rosneft and Lukoil Are Draining the War Chest

Canada US Trade War 2026: Inside Carney’s Push to Cut Ties With Trump’s Tariffs

Rachel Reeves’s £25 Billion Problem: What the Autumn Budget Gap Means for Britain

Inside the Fed’s Most Divided Vote in Years: Why Warsh Held the Line on Rates

Pakistan Passed Its Third IMF Review

The Fed Is Fractured — And a New Chair Just Made It Louder, Not Quieter

The UK Economy in 2026 Is Neither Recession Nor Recovery :Stagflaton

Indonesia’s $121 Billion Nickel Bet Is Facing a Battery Chemistry

Why Ultra-Wealthy Families Are Splitting Between Singapore and Dubai inmarkets 2026

China Chose Political Control Over Fixing Its Deflation Trap in 2026

Oil Markets Are Oversupplied and Geopolitically Explosive at the Same Time

Russia’s Budget Deficit Blew Past Its Full-Year Target in Three Months

Russia Bans Diesel Exports 2026: Global Fuel Market Impact Explained

Gold Price Forecast 2026: Fed’s July 29 Decision and Record Central Bank Buying Explained

Strait of Hormuz Blockade 2026: Oil Prices Surge 9% as US-Iran Conflict Reignites

Strait of Hormuz 2026: Why Markets Still Don’t Trust It’s Open

China Politburo July 2026: Stimulus Signals Explained

Pakistan Economy 2026: GDP Grows 3.7% as IMF Completes EFF Review Amid Middle East Risk

Down But Not Out: Inside the Slow Sinking of Russia’s War Economy

Gulf Capital Retreat From Pakistan 2026: UAE Loan Freeze & What It Means

Apple vs OpenAI Lawsuit: The Economic Story Behind the Headline

Indonesia Russian Oil Imports 2026: Why Jakarta Is Diversifying Crude Supply

Global Stock Market Selloff 2026: Stagflation Fears Return as Iran Conflict Reignites

The Yuan Now Settles 67% of Russian Oil Payments — Quiet De-Dollarization in Action

AI Capex Bubble 2026: The Hidden $662B Debt Nobody Reports

Pakistan’s Economic Survey FY26: Inflation Spike Insights
-

 Markets & Finance7 months ago
Top 15 Stocks for Investment in 2026 in PSX: Your Complete Guide to Pakistan’s Best Investment Opportunities
-

 Analysis5 months ago
Johor’s Investment Boom: The Hidden Costs Behind Malaysia’s Most Ambitious Economic Surge
-

 Analysis6 months ago
Top 10 Stocks for Investment in PSX for Quick Returns in 2026
-

 Analysis6 months ago
Brazil’s Rare Earth Race: US, EU, and China Compete for Critical Minerals as Tensions Rise
-

 Banks7 months ago
Best Investments in Pakistan 2026: Top 10 Low-Price Shares and Long-Term Picks for the PSX
-

 Investment7 months ago
Top 10 Mutual Fund Managers in Pakistan for Investment in 2026: A Comprehensive Guide for Optimal Returns
-

 Global Economy7 months ago
15 Most Lucrative Sectors for Investment in Pakistan: A 2025 Data-Driven Analysis
-

 Global Economy7 months ago
Pakistan’s Export Goldmine: 10 Game-Changing Markets Where Pakistani Businesses Are Winning Big in 2025