
Analysis
Pakistan’s Economic Crossroads: Rising Poverty and the Stagnation Trap in 2026

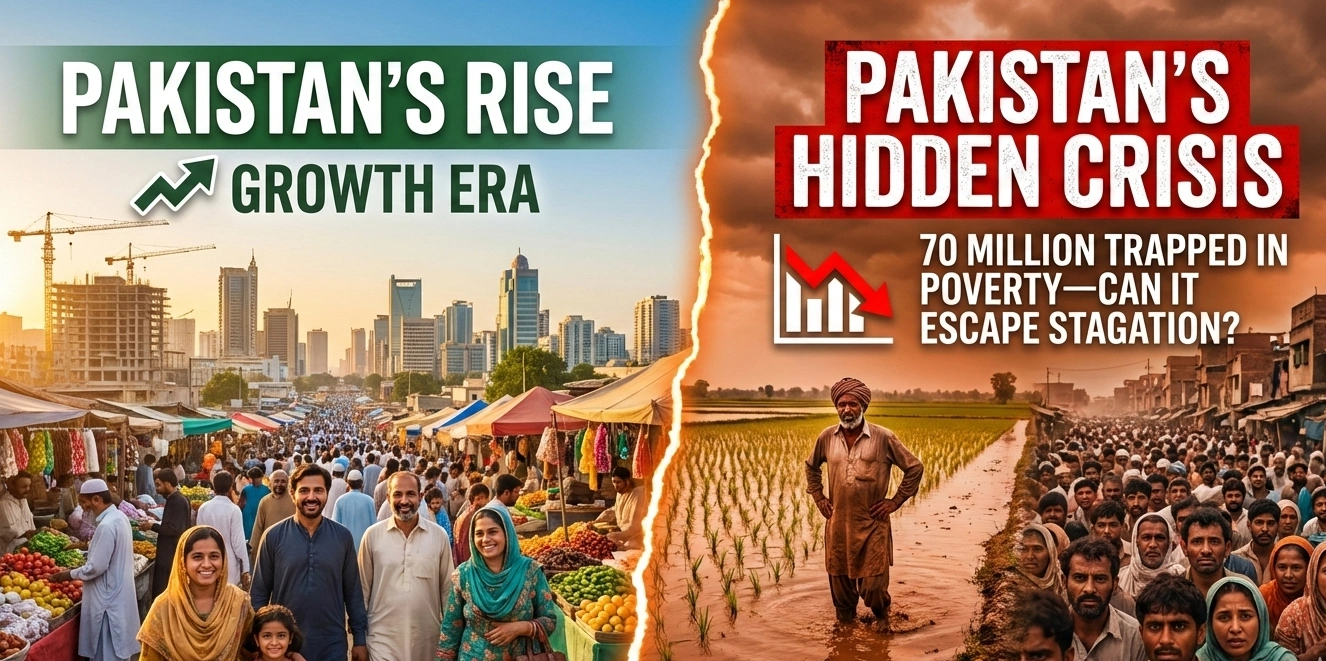
Pakistan’s poverty rate hits 28.9% in 2025, with 70 million people below the poverty line. Explore the causes of poverty in Pakistan 2026, economic stagnation, inequality trends, and the policy rethink the country desperately needs.
Imagine a wheat farmer in rural Punjab — call him Aslam — who has tilled the same two acres his father left him for thirty years. In 2022, catastrophic floods submerged his fields for six weeks. In 2023, erratic monsoons halved his harvest. By 2024, the government’s support price for wheat had been slashed under IMF conditionality, and the middlemen who once paid a modest premium had moved on. Aslam’s real income today, inflation-adjusted, is lower than it was a decade ago. He is not alone. He is, statistically speaking, one of 70 million Pakistanis.
Pakistan’s economic stagnation is no longer a forecast. It is a lived reality — etched into household budgets, migration patterns, and the quiet despair of a shrinking middle class. The country’s latest Household Integrated Economic Survey (HIES 2024–25), released by the Planning Commission, confirms what many economists had long warned: the poverty rate has surged to 28.9%, the highest level since 2014, up sharply from 21.9% in 2018–19. For a nation of 240 million, that translates to roughly 70 million people subsisting on less than Rs8,484 per month — approximately $30.
The macroeconomic headline numbers tell a different story, of course. Inflation has cooled from its 38% peak. The current account has stabilised. The IMF programme is on track. Foreign exchange reserves have recovered. Islamabad calls this “stabilisation.” But stabilisation, it turns out, is not the same as development. And the gap between the two — in human terms — is widening by the year.
Pakistan Poverty Rate 2025: A Decade of Lost Ground
The Planning Commission data is unambiguous and, frankly, damning. Real household income — adjusted for inflation — in 2024–25 is 13% lower than it was in 2015–16. Real consumption has fallen 8% over the same period. These are not rounding errors. They represent a structural deterioration of living standards across an entire generation.
Key Economic and Poverty Indicators: Pakistan 2015–2025
| Indicator | 2015–16 | 2018–19 | 2021–22 | 2024–25 |
|---|---|---|---|---|
| Poverty Rate (%) | ~24.3 | 21.9 | ~21.4 | 28.9 |
| Gini Coefficient | ~29.0 | 28.4 | ~28.8 | 31.7 |
| Rural Poverty (%) | ~30.0 | 28.2 | ~27.0 | 36.2 |
| Urban Gini | ~33.0 | ~33.5 | ~34.0 | 34.4 |
| Rural Gini | ~25.0 | 25.1 | ~26.0 | 29.2 |
| Real Household Income (Index) | 100 | ~98 | ~96 | 87 |
| LSM Index | ~110 | ~118 | 128 | 115 |
| Unemployment Rate (%) | ~5.9 | 6.3 | 6.3 | 7.1 |
| GDP Growth (%) | 4.6 | 3.3 | 6.1 | ~2.5 |
Sources: Pakistan Planning Commission HIES 2024–25; World Bank Pakistan Overview; IMF Article IV Consultation 2024
Income inequality, as measured by the Gini coefficient, has risen to 31.7 nationally — up from 28.4 in 2018–19. Rural inequality has jumped from 25.1 to 29.2, while urban inequality sits at 34.4. The countryside, long assumed to be Pakistan’s economic cushion, is fraying fastest. Rural poverty now stands at 36.2%, up from 28.2% just six years ago.
The UNDP Human Development Report 2023–24 places Pakistan’s HDI at 0.540, ranking it 164th out of 193 countries, with a 33% decline when adjusted for inequality — one of the steeper inequality-adjusted drops in South Asia. This is not a country on the cusp of emerging market status. It is a country sliding in the wrong direction.
Causes of Poverty in Pakistan 2026: Climate, Policy, and the Urban-Rural Divide
The Climate Shock No One Planned For
Aslam’s story is not idiosyncratic. Climate change has become a structural driver of rural poverty in Pakistan. The 2022 floods submerged one-third of the country, destroying crops, livestock, and infrastructure worth an estimated $30 billion, according to World Bank damage assessments. The recovery was incomplete before the next climate shock arrived.
Small farmers, who constitute the backbone of Pakistan’s agricultural sector, are disproportionately exposed. They lack irrigation alternatives when rains fail, insurance when floods arrive, and credit to replant after losses. The government’s response — oscillating support prices for wheat and sugarcane, and import/export restrictions that shift with fiscal pressures — has amplified rather than cushioned these shocks. When the wheat support price was cut in 2023–24 under IMF programme conditionality, it was economically defensible. But for farmers already operating at subsistence margins, it was catastrophic.
As the Guardian’s climate desk has documented, Pakistan contributes less than 1% of global greenhouse gas emissions yet ranks among the top ten countries most vulnerable to climate impacts. The moral asymmetry is real; the policy response has been inadequate.
The Urban Worker Squeezed from Both Sides
Three hundred kilometres east of Aslam’s flooded fields, a garment worker named Nadia stitches denim in a Lahore factory. Her nominal wage has risen — just not nearly as fast as prices. Urban inflation, which exceeded 40% at its 2023 peak before retreating, eroded purchasing power faster than any wage negotiation could track.
Urban Pakistan’s manufacturing base, meanwhile, has contracted. The Large Scale Manufacturing (LSM) index stands at 115 in 2024–25, down from a peak of 128 in 2021–22. Food processing and textiles — sectors that employ millions at the lower end of the income spectrum — have struggled under high energy costs, import restrictions on raw materials (introduced during the 2022–23 foreign exchange crisis), and weak domestic demand. Some sectors have rebounded: automobile sales have recovered, and apparel exports hit record highs in 2024, buoyed by global supply chain diversification away from Bangladesh. But these gains are concentrated in capital-intensive niches that create fewer jobs per unit of output.
Urban unemployment, at 7.1%, understates underemployment — the millions working part-time, informally, or below their skill level. Pakistan’s youth bulge intensifies the pressure: roughly 60% of the population is under 30, and an economy growing at 2–3% annually cannot absorb the 1.5–2 million new labour market entrants each year.
Pakistan Economic Stagnation: A Lost Decade Compared
The contrast with the early 2000s is instructive — and painful. Between 2002 and 2007, Pakistan grew at an average of 7% annually. Poverty fell sharply. A nascent middle class emerged in urban Punjab and Sindh. Consumer goods companies expanded distribution networks into secondary cities. That growth story attracted foreign direct investment, spurred telecom expansion, and created something rare in Pakistan’s economic history: optimism.
What happened? Partly geopolitics — the war economy distortions of the post-9/11 decade. Partly structural: the early 2000s growth was partly debt-financed and built on shallow foundations. The textile and agriculture sectors never underwent the productivity transformation that, say, Bangladesh’s garment industry did through sustained investment and export discipline.
The Bangladesh and India Comparison
The regional comparison is sobering. Bangladesh, starting from a lower base, has sustained export-led manufacturing growth, reduced its poverty rate to below 19%, and achieved per capita income convergence with Pakistan. It did so through a narrow but disciplined focus: the garment sector, remittances, and microfinance penetration at scale. The IMF’s South Asia Regional Economic Outlook credits Bangladesh’s export institutional framework — stable energy supply, reliable port infrastructure, workers’ rights minimum floors — as critical differentiators.
India, despite its own inequality challenges documented by the World Inequality Lab, has managed 6–7% growth rates that structurally reduce extreme poverty even if inequality rises. The key difference is productive investment: India’s gross fixed capital formation runs at approximately 30% of GDP. Pakistan’s hovers around 13–15% — insufficient to generate the employment density a young population requires.
Pakistan’s FDI inflows have been chronically low — under $2 billion in most recent years — and several multinational firms (in consumer goods, pharmaceuticals, and energy) have scaled back or exited entirely, citing regulatory uncertainty, energy costs, and currency risk. The Financial Times has tracked this multinational exodus as symptomatic of a broader investment climate problem that stabilisation packages alone cannot fix.
Impact of Inequality on Pakistan Growth: A Vicious Cycle
Rising inequality is not merely a moral concern — it is an economic drag. When the Gini coefficient rises and the middle class contracts, domestic consumption loses its dynamism. Pakistan’s consumer market, once a compelling growth story for multinationals, becomes less attractive. Tax revenues from a narrowing formal economy remain inadequate. Public investment in health, education, and infrastructure — the long-run foundations of productivity — is crowded out by debt servicing, which now consumes nearly 50% of federal revenue.
The World Bank’s “Fragile Gains” assessment notes that while macroeconomic stabilisation has reduced tail risks, it has not addressed the structural drivers of low growth and high vulnerability. A country where real household incomes are 13% below their 2015–16 levels is not stabilising around a healthy equilibrium. It is stabilising around a poverty trap.
Poverty Alleviation Strategies for Pakistan: What Would Actually Work
The policy menu is not mysterious. Economists from Islamabad to Washington have outlined the broad contours for years. What has been missing is political will, sequencing, and a coherent growth vision that complements — rather than defers to — stabilisation.
1. Debt Restructuring and Fiscal Space Creation Pakistan’s external debt obligations leave almost no room for productive public investment. A credible medium-term debt restructuring — ideally coordinated with bilateral creditors (China, Saudi Arabia, UAE) and multilaterals — could free fiscal space for the infrastructure and human capital investment that growth requires. The early 2000s precedent is instructive: the Paris Club rescheduling of 2001 gave Pakistan’s government the breathing room to invest, and growth followed.
2. Tax Base Broadening — Genuinely Pakistan’s tax-to-GDP ratio, at approximately 10–11%, is among the lowest in the region. Agricultural income — concentrated among large landowners — is largely untaxed. Real estate capital gains escape formal taxation. The retail and wholesale trade sector, dominated by politically connected interests, contributes minimally to the exchequer. Broadening the tax base is not technically difficult. It is politically difficult. The IMF has repeatedly flagged these exemptions; the government has repeatedly deferred action.
3. A Jobs-Centred Industrial Policy Pakistan needs a Bangladesh-style sectoral focus — probably in textiles and apparel (where it has comparative advantage and recent export momentum), agro-processing (where raw material inputs are domestic), and digital services (where the youth bulge becomes an asset). This requires stable energy supply at competitive prices, predictable trade policy, and investment in technical and vocational education aligned to employer needs.
4. Climate-Resilient Agriculture Small farmers need crop insurance, drought-resistant seed varieties, water-efficient irrigation, and access to credit at non-usurious rates. These are not novel ideas — they are standard development economics. The challenge is delivery through institutions that have historically served large landowners rather than smallholders.
5. Restoring Private Sector Confidence State-owned enterprises continue to crowd out private investment, drain fiscal resources, and distort markets. A credible privatisation programme — with transparent processes and regulatory frameworks that protect consumers — would signal seriousness to both domestic and foreign investors.
Conclusion: Stabilisation Is Not Enough
Pakistan in 2026 stands at a genuine crossroads. The IMF programme has averted the acute crisis that loomed in 2022–23. Inflation is retreating. Reserves are recovering. These are real achievements, and dismissing them is unfair.
But stabilisation around stagnation is not a development strategy. Seventy million people below the poverty line is not a rounding error on the path to recovery — it is a structural failure demanding structural response. The shrinking middle class, the youth unemployment crisis, the rural poverty surge, the climate vulnerability of smallholder agriculture: these are interconnected problems that no single IMF tranche will resolve.
The early 2000s showed that Pakistan can grow — and when it grows inclusively, poverty falls. The ingredients are known. What is required is the political economy to assemble them: debt relief to create fiscal space, tax reform to fund public investment, industrial policy to generate jobs, and climate adaptation to protect the rural poor.
Aslam cannot wait another decade for the theory to become practice. Neither can the 70 million Pakistanis who share his predicament.
Discover more from The Economy
Subscribe to get the latest posts sent to your email.



Navigating Mortgage and Loan Refinancing in a High-Yield Environment
Global public debt crossing critical thresholds has kept central bank policies volatile, resulting in fluctuating US Treasury yields throughout 2026. For homeowners and commercial property holders burdened by previous high-interest borrowing cycles, finding optimal refinance windows has become a high-stakes financial puzzle. Stalled disinflation and stubborn employment numbers mean rate cuts are incremental, requiring borrowers to act with precision.
Timing your mortgage or commercial loan refinance in this environment requires a deep understanding of yield curve movements and lender risk appetites.
Decoding 2026 Refinance Dynamics
The 10-Year Treasury Yield Benchmark
Mortgage rates continue to track closely with the 10-year US Treasury yield. When macroeconomic anxiety spikes debt issuance, yields rise, tightening consumer borrowing capacity. Savvy borrowers monitor weekly Treasury auctions to lock in rates during brief dip windows.
Hybrid ARMs and Alternative Structures
With fixed rates remaining elevated, 7/1 and 10/1 adjustable-rate mortgages (ARMs) have surged in popularity. These products offer lower initial monthly payments, giving borrowers breathing room until central bank easing cycles fully materialize.
| Loan Product | Current Rate Range | Best For | Key Risk Factor |
| 30-Year Fixed Mortgage | 6.2% – 6.8% | Long-term predictability | Higher initial monthly outlay |
| 7/1 Hybrid ARM | 5.5% – 5.9% | Short-term ownership / flipping | Rate reset risk after year 7 |
| Commercial Refinance | 7.0% – 8.2% | Corporate asset restructuring | Strict DSCR lender covenants |
Actionable Steps for Successful Refinancing
To maximize your chances of securing favorable refinance terms in a volatile market, follow a disciplined preparation strategy.
Boost Your Credit Score Immediately: Lenders in 2026 are applying stringent credit tiering; a 20-point increase can drop your APR by a crucial quarter-point.
Shop Regional Credit Unions: Smaller financial institutions often offer portfolio loans with more flexible underwriting than major national banks.
Calculate the Break-Even Point: Ensure your total closing costs are recouped through monthly savings within 24 months of closing.
“Market Strategist View: Refinancing in 2026 is an exercise in opportunistic timing. Borrowers must maintain immaculate financial profiles ready to strike the moment Treasury yields dip.”
Mastering the complexities of today’s debt environment ensures you can successfully lower your debt service costs and protect your long-term financial stability.
Discover more from The Economy
Subscribe to get the latest posts sent to your email.

The days of pulling generic auto insurance quotes based purely on your zip code and age are officially over. In 2026, insurance comparison engines are powered entirely by generative AI and real-time telematics. These platforms digest thousands of live data points—ranging from your driving smoothness via connected vehicle sensors to real-time traffic congestion patterns—to generate hyper-personalized premiums instantly.
For consumers, this evolution represents both a massive opportunity for savings and a hidden trap for penalty pricing. Understanding how AI algorithms evaluate risk is essential for anyone looking to lower their monthly auto insurance premiums.
How AI Comparison Engines Evaluate Your Risk Profile
Behavioral Telematics and Connected Cars
Modern cars stream performance data directly to insurance aggregators. Generative AI models analyze braking sharpness, acceleration curves, cornering G-forces, and phone distraction metrics. Drivers who maintain smooth, defensive habits are rewarded with dynamic rate cuts of up to 40% compared to traditional rating tiers.
Predictive Traffic and Weather Modeling
AI tools now cross-reference your daily commute route with predictive weather and accident probability models. If your standard parking location or driving corridor has a statistically higher incidence of uninsured motorist claims, your quotes will reflect that hyper-local risk assessment.
| Comparison Factor | Traditional Rating Model | 2026 Generative AI Model | Impact on Premium |
| Mileage & Usage | Annual estimated odometer reading | GPS tracking & live trip duration | High (up to 35% savings) |
| Driving Behavior | MVR driving record & accidents | Real-time braking, speed, & G-force | Critical (determines tier) |
| Vehicle Tech | Make, model, and safety rating | ADAS calibration & repair cost data | Moderate |
Strategies to Lower Your AI-Driven Insurance Quote
To outsmart the algorithm and secure the lowest possible premium in 2026, drivers must proactively manage their digital footprint on insurance platforms.
Opt-In for Telematics Trial Periods: Many insurers offer immediate 15% discounts just for installing their driving app; let it track safe habits for 30 days to lock in permanent savings.
Scrub Unverified Public Records: Ensure your motor vehicle report is free of clerical errors that AI risk models misinterpret as reckless behavior.
Compare AI Aggregators: Use platforms that integrate multi-carrier API feeds rather than single-brand comparison sites to find the best risk-adjusted rate.
“Industry Note: AI-driven pricing rewards transparency and precision. Drivers who actively manage their telematics data consistently out-save those relying on legacy quote calculators.”
Embracing AI comparison tools allows savvy policyholders to customize coverage limits precisely to their driving habits, eliminating wasted premium spend while ensuring robust protection.
Discover more from The Economy
Subscribe to get the latest posts sent to your email.

Despite decades of bans and strict handling mandates, asbestos remains a silent killer across legacy manufacturing plants, shipyards, and modern green-energy infrastructure retrofits. In 2026, regulatory changes by the EPA and tightened occupational health standards have triggered a fresh wave of mesothelioma litigation. Manufacturers attempting to fast-track industrial transitions are encountering catastrophic oversight, exposing workers to legacy toxins and opening corporate parent companies to unprecedented liability.
Navigating a mesothelioma claim in 2026 requires understanding how modern industrial supply chains intersect with historical exposure. Trusts established decades ago are being audited under stricter transparency laws, altering payout ratios and accelerating fast-track settlements for terminally ill plaintiffs.
Modern Industrial Exposure Hotspots
Green Retrofitting and Renewable Energy Infrastructure
A primary source of 2026 asbestos exposure occurs during the decommissioning and retrofitting of older industrial facilities for renewable energy production. Workers insulating electrical grids, modernizing HVAC systems, or upgrading manufacturing floors frequently disturb encapsulated asbestos materials that were improperly documented or ignored during facility audits.
Automotive and Aerospace Supply Chains
With advanced manufacturing booming, workers handling specialized friction materials, gaskets, and heat shields face ongoing risks. Supply chain tracing has become more sophisticated, allowing legal teams to pinpoint exact corporate entities responsible for raw material distribution across multinational borders.
| Industry Sector | Primary Exposure Risk | Legal Venue / Trust | Avg. Claim Value Range |
| Green Energy Retrofit | Disturbed insulation, pipe lagging | Federal Tort / Manufacturer Trust | $1.2M – $3.5M |
| Shipbuilding & Marine | Boiler insulation, structural seals | Asbestos Bankruptcy Trusts | $800K – $2.4M |
| Automotive Manufacturing | Brake components, high-heat gaskets | Third-Party Product Liability | $600K – $1.8M |
Securing Maximum Compensation: Steps for Plaintiffs
Time is of the essence in mesothelioma cases. Plaintiffs and their families must act decisively to secure financial recovery before statutes of limitations expire.
Retain Specialized Counsel: Work exclusively with national mesothelioma law firms possessing deep historical databases of asbestos-containing products.
Audit Employment History: Document every job site, supervisor name, and equipment brand encountered throughout your career.
Expedite Medical Filings: Secure a formal pathological diagnosis quickly to qualify for expedited trust fund distribution and priority trial settings.
“Expert Insight: Modern asbestos litigation is no longer just about historical tracking; it is about holding modern corporations accountable for failing to conduct rigorous environmental safety audits before initiating industrial retrofits.”
By combining meticulous work history reconstruction with aggressive multi-trust filings, victims can secure substantial financial relief to cover specialized immunotherapy and family support.
Discover more from The Economy
Subscribe to get the latest posts sent to your email.

Balance of Payments (BOP)

The Falkland Islands Dispute: Sovereign Wealth, Offshore Drilling, and Market Impacts

Gross Domestic Product (GDP): Nominal vs. Real

What is Inflation and the Consumer Price Index (CPI)?

US-China Trade Competition 2026: Supply Chain Relocation Guide

Oil Prices Break $100 in 2026: Middle East Conflict & Energy Markets

South-South Trade Expansion: Digital Integration and Emerging Market Growth

$166B Tariff Refund Tapering Fast: Is Your Business Missing Out?

Stock Market Today: Dow Climbs 500 Points as Markets Shake Off Inflation Jitters

14th WTO Conference 2026: Tariffs & Global Supply Chain Impact

Swish Secures $24M Funding to Disrupt India’s $100B Food Market

Physical AI and Driverless Tech: The Next Trillion-Dollar Industrial Revolution

Enterprise AI Platforms Disrupting B2B SaaS in 2026: Full Analysis

Crypto vs. Safe Haven Assets 2026: Where Institutions Are Hedging

State Farm’s $5B Dividend 2026: Who Qualifies & Payout Dates

US-China Relations in Q3 2026: Trade Tariffs and Supply Chain Risks

Gold’s Wild 2026: From a Record $5,600 Peak to a 24% Crash and Back Toward $4,500

Oil Surges as Strait of Hormuz Traffic Collapses Again

The Rocket That Won’t Quit: Inside SpaceX’s Falcon 9 Launch Machine

Bank of England Set to Hold Rates Through Year-End, Reuters Poll Shows

SpaceX Starship Flight 14: First Orbital Attempt & Starlink V3 Launch Explained

The 2026 Crypto Regulatory Shift: What It Means for Institutional Investors

AI Chip Stocks 2026: The Best Semiconductor Investments Beyond Marvell

Retail Earnings Week: What Home Depot, Target & Walmart Reveal

AI-Powered Training: The Next Multi-Billion Dollar Ecosystem in Fitness

Russia’s Black Sea Oil Exports Fall for a Fifth Straight Week

Global Chip Selloff Deepens: What’s Driving the Aug. 19 Semiconductor Rout

Top 30 Stocks for Investment in PSX for Massive ROI in 2026
-

 Markets & Finance8 months ago
Top 15 Stocks for Investment in 2026 in PSX: Your Complete Guide to Pakistan’s Best Investment Opportunities
-

 Analysis7 months ago
Johor’s Investment Boom: The Hidden Costs Behind Malaysia’s Most Ambitious Economic Surge
-

 Analysis7 months ago
Top 10 Stocks for Investment in PSX for Quick Returns in 2026
-

 Analysis7 months ago
Brazil’s Rare Earth Race: US, EU, and China Compete for Critical Minerals as Tensions Rise
-

 Banks8 months ago
Best Investments in Pakistan 2026: Top 10 Low-Price Shares and Long-Term Picks for the PSX
-

 Investment8 months ago
Top 10 Mutual Fund Managers in Pakistan for Investment in 2026: A Comprehensive Guide for Optimal Returns
-

 Global Economy9 months ago
15 Most Lucrative Sectors for Investment in Pakistan: A 2025 Data-Driven Analysis
-

 Global Economy9 months ago
Pakistan’s Export Goldmine: 10 Game-Changing Markets Where Pakistani Businesses Are Winning Big in 2025