
Analysis
Pakistan’s Economic Crossroads: Rising Poverty and the Stagnation Trap in 2026
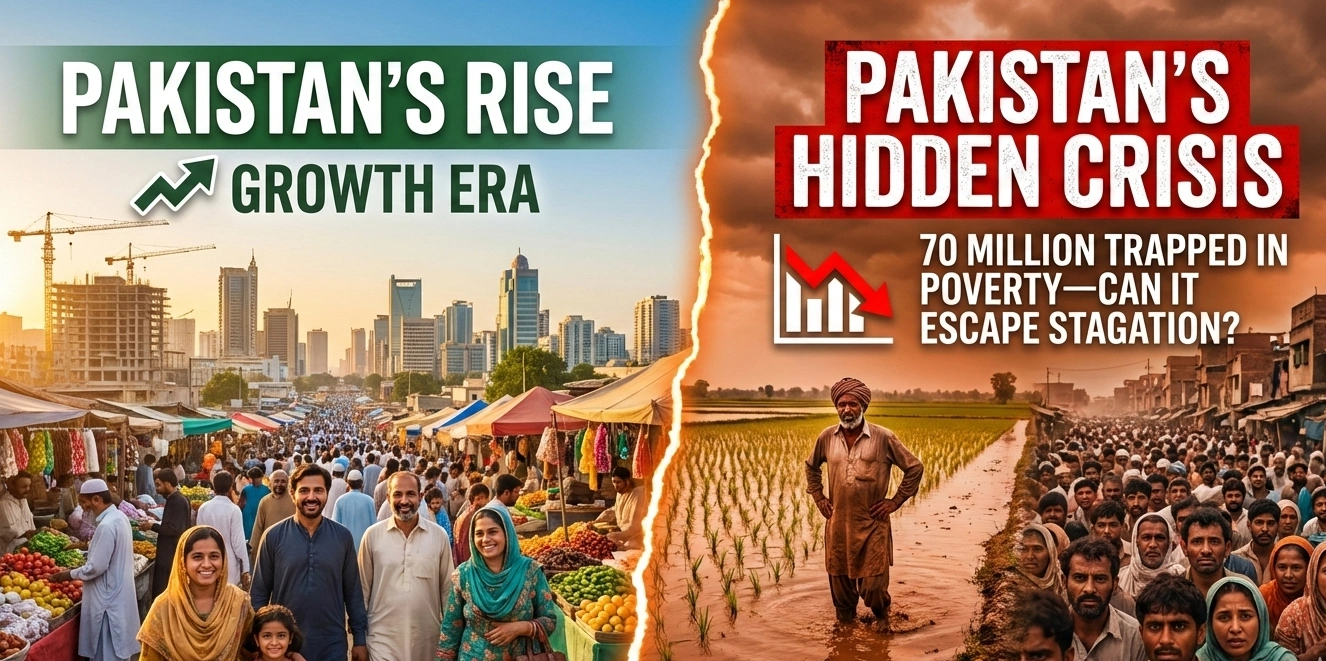
Pakistan’s poverty rate hits 28.9% in 2025, with 70 million people below the poverty line. Explore the causes of poverty in Pakistan 2026, economic stagnation, inequality trends, and the policy rethink the country desperately needs.
Imagine a wheat farmer in rural Punjab — call him Aslam — who has tilled the same two acres his father left him for thirty years. In 2022, catastrophic floods submerged his fields for six weeks. In 2023, erratic monsoons halved his harvest. By 2024, the government’s support price for wheat had been slashed under IMF conditionality, and the middlemen who once paid a modest premium had moved on. Aslam’s real income today, inflation-adjusted, is lower than it was a decade ago. He is not alone. He is, statistically speaking, one of 70 million Pakistanis.
Pakistan’s economic stagnation is no longer a forecast. It is a lived reality — etched into household budgets, migration patterns, and the quiet despair of a shrinking middle class. The country’s latest Household Integrated Economic Survey (HIES 2024–25), released by the Planning Commission, confirms what many economists had long warned: the poverty rate has surged to 28.9%, the highest level since 2014, up sharply from 21.9% in 2018–19. For a nation of 240 million, that translates to roughly 70 million people subsisting on less than Rs8,484 per month — approximately $30.
The macroeconomic headline numbers tell a different story, of course. Inflation has cooled from its 38% peak. The current account has stabilised. The IMF programme is on track. Foreign exchange reserves have recovered. Islamabad calls this “stabilisation.” But stabilisation, it turns out, is not the same as development. And the gap between the two — in human terms — is widening by the year.
Pakistan Poverty Rate 2025: A Decade of Lost Ground
The Planning Commission data is unambiguous and, frankly, damning. Real household income — adjusted for inflation — in 2024–25 is 13% lower than it was in 2015–16. Real consumption has fallen 8% over the same period. These are not rounding errors. They represent a structural deterioration of living standards across an entire generation.
Key Economic and Poverty Indicators: Pakistan 2015–2025
| Indicator | 2015–16 | 2018–19 | 2021–22 | 2024–25 |
|---|---|---|---|---|
| Poverty Rate (%) | ~24.3 | 21.9 | ~21.4 | 28.9 |
| Gini Coefficient | ~29.0 | 28.4 | ~28.8 | 31.7 |
| Rural Poverty (%) | ~30.0 | 28.2 | ~27.0 | 36.2 |
| Urban Gini | ~33.0 | ~33.5 | ~34.0 | 34.4 |
| Rural Gini | ~25.0 | 25.1 | ~26.0 | 29.2 |
| Real Household Income (Index) | 100 | ~98 | ~96 | 87 |
| LSM Index | ~110 | ~118 | 128 | 115 |
| Unemployment Rate (%) | ~5.9 | 6.3 | 6.3 | 7.1 |
| GDP Growth (%) | 4.6 | 3.3 | 6.1 | ~2.5 |
Sources: Pakistan Planning Commission HIES 2024–25; World Bank Pakistan Overview; IMF Article IV Consultation 2024
Income inequality, as measured by the Gini coefficient, has risen to 31.7 nationally — up from 28.4 in 2018–19. Rural inequality has jumped from 25.1 to 29.2, while urban inequality sits at 34.4. The countryside, long assumed to be Pakistan’s economic cushion, is fraying fastest. Rural poverty now stands at 36.2%, up from 28.2% just six years ago.
The UNDP Human Development Report 2023–24 places Pakistan’s HDI at 0.540, ranking it 164th out of 193 countries, with a 33% decline when adjusted for inequality — one of the steeper inequality-adjusted drops in South Asia. This is not a country on the cusp of emerging market status. It is a country sliding in the wrong direction.
Causes of Poverty in Pakistan 2026: Climate, Policy, and the Urban-Rural Divide
The Climate Shock No One Planned For
Aslam’s story is not idiosyncratic. Climate change has become a structural driver of rural poverty in Pakistan. The 2022 floods submerged one-third of the country, destroying crops, livestock, and infrastructure worth an estimated $30 billion, according to World Bank damage assessments. The recovery was incomplete before the next climate shock arrived.
Small farmers, who constitute the backbone of Pakistan’s agricultural sector, are disproportionately exposed. They lack irrigation alternatives when rains fail, insurance when floods arrive, and credit to replant after losses. The government’s response — oscillating support prices for wheat and sugarcane, and import/export restrictions that shift with fiscal pressures — has amplified rather than cushioned these shocks. When the wheat support price was cut in 2023–24 under IMF programme conditionality, it was economically defensible. But for farmers already operating at subsistence margins, it was catastrophic.
As the Guardian’s climate desk has documented, Pakistan contributes less than 1% of global greenhouse gas emissions yet ranks among the top ten countries most vulnerable to climate impacts. The moral asymmetry is real; the policy response has been inadequate.
The Urban Worker Squeezed from Both Sides
Three hundred kilometres east of Aslam’s flooded fields, a garment worker named Nadia stitches denim in a Lahore factory. Her nominal wage has risen — just not nearly as fast as prices. Urban inflation, which exceeded 40% at its 2023 peak before retreating, eroded purchasing power faster than any wage negotiation could track.
Urban Pakistan’s manufacturing base, meanwhile, has contracted. The Large Scale Manufacturing (LSM) index stands at 115 in 2024–25, down from a peak of 128 in 2021–22. Food processing and textiles — sectors that employ millions at the lower end of the income spectrum — have struggled under high energy costs, import restrictions on raw materials (introduced during the 2022–23 foreign exchange crisis), and weak domestic demand. Some sectors have rebounded: automobile sales have recovered, and apparel exports hit record highs in 2024, buoyed by global supply chain diversification away from Bangladesh. But these gains are concentrated in capital-intensive niches that create fewer jobs per unit of output.
Urban unemployment, at 7.1%, understates underemployment — the millions working part-time, informally, or below their skill level. Pakistan’s youth bulge intensifies the pressure: roughly 60% of the population is under 30, and an economy growing at 2–3% annually cannot absorb the 1.5–2 million new labour market entrants each year.
Pakistan Economic Stagnation: A Lost Decade Compared
The contrast with the early 2000s is instructive — and painful. Between 2002 and 2007, Pakistan grew at an average of 7% annually. Poverty fell sharply. A nascent middle class emerged in urban Punjab and Sindh. Consumer goods companies expanded distribution networks into secondary cities. That growth story attracted foreign direct investment, spurred telecom expansion, and created something rare in Pakistan’s economic history: optimism.
What happened? Partly geopolitics — the war economy distortions of the post-9/11 decade. Partly structural: the early 2000s growth was partly debt-financed and built on shallow foundations. The textile and agriculture sectors never underwent the productivity transformation that, say, Bangladesh’s garment industry did through sustained investment and export discipline.
The Bangladesh and India Comparison
The regional comparison is sobering. Bangladesh, starting from a lower base, has sustained export-led manufacturing growth, reduced its poverty rate to below 19%, and achieved per capita income convergence with Pakistan. It did so through a narrow but disciplined focus: the garment sector, remittances, and microfinance penetration at scale. The IMF’s South Asia Regional Economic Outlook credits Bangladesh’s export institutional framework — stable energy supply, reliable port infrastructure, workers’ rights minimum floors — as critical differentiators.
India, despite its own inequality challenges documented by the World Inequality Lab, has managed 6–7% growth rates that structurally reduce extreme poverty even if inequality rises. The key difference is productive investment: India’s gross fixed capital formation runs at approximately 30% of GDP. Pakistan’s hovers around 13–15% — insufficient to generate the employment density a young population requires.
Pakistan’s FDI inflows have been chronically low — under $2 billion in most recent years — and several multinational firms (in consumer goods, pharmaceuticals, and energy) have scaled back or exited entirely, citing regulatory uncertainty, energy costs, and currency risk. The Financial Times has tracked this multinational exodus as symptomatic of a broader investment climate problem that stabilisation packages alone cannot fix.
Impact of Inequality on Pakistan Growth: A Vicious Cycle
Rising inequality is not merely a moral concern — it is an economic drag. When the Gini coefficient rises and the middle class contracts, domestic consumption loses its dynamism. Pakistan’s consumer market, once a compelling growth story for multinationals, becomes less attractive. Tax revenues from a narrowing formal economy remain inadequate. Public investment in health, education, and infrastructure — the long-run foundations of productivity — is crowded out by debt servicing, which now consumes nearly 50% of federal revenue.
The World Bank’s “Fragile Gains” assessment notes that while macroeconomic stabilisation has reduced tail risks, it has not addressed the structural drivers of low growth and high vulnerability. A country where real household incomes are 13% below their 2015–16 levels is not stabilising around a healthy equilibrium. It is stabilising around a poverty trap.
Poverty Alleviation Strategies for Pakistan: What Would Actually Work
The policy menu is not mysterious. Economists from Islamabad to Washington have outlined the broad contours for years. What has been missing is political will, sequencing, and a coherent growth vision that complements — rather than defers to — stabilisation.
1. Debt Restructuring and Fiscal Space Creation Pakistan’s external debt obligations leave almost no room for productive public investment. A credible medium-term debt restructuring — ideally coordinated with bilateral creditors (China, Saudi Arabia, UAE) and multilaterals — could free fiscal space for the infrastructure and human capital investment that growth requires. The early 2000s precedent is instructive: the Paris Club rescheduling of 2001 gave Pakistan’s government the breathing room to invest, and growth followed.
2. Tax Base Broadening — Genuinely Pakistan’s tax-to-GDP ratio, at approximately 10–11%, is among the lowest in the region. Agricultural income — concentrated among large landowners — is largely untaxed. Real estate capital gains escape formal taxation. The retail and wholesale trade sector, dominated by politically connected interests, contributes minimally to the exchequer. Broadening the tax base is not technically difficult. It is politically difficult. The IMF has repeatedly flagged these exemptions; the government has repeatedly deferred action.
3. A Jobs-Centred Industrial Policy Pakistan needs a Bangladesh-style sectoral focus — probably in textiles and apparel (where it has comparative advantage and recent export momentum), agro-processing (where raw material inputs are domestic), and digital services (where the youth bulge becomes an asset). This requires stable energy supply at competitive prices, predictable trade policy, and investment in technical and vocational education aligned to employer needs.
4. Climate-Resilient Agriculture Small farmers need crop insurance, drought-resistant seed varieties, water-efficient irrigation, and access to credit at non-usurious rates. These are not novel ideas — they are standard development economics. The challenge is delivery through institutions that have historically served large landowners rather than smallholders.
5. Restoring Private Sector Confidence State-owned enterprises continue to crowd out private investment, drain fiscal resources, and distort markets. A credible privatisation programme — with transparent processes and regulatory frameworks that protect consumers — would signal seriousness to both domestic and foreign investors.
Conclusion: Stabilisation Is Not Enough
Pakistan in 2026 stands at a genuine crossroads. The IMF programme has averted the acute crisis that loomed in 2022–23. Inflation is retreating. Reserves are recovering. These are real achievements, and dismissing them is unfair.
But stabilisation around stagnation is not a development strategy. Seventy million people below the poverty line is not a rounding error on the path to recovery — it is a structural failure demanding structural response. The shrinking middle class, the youth unemployment crisis, the rural poverty surge, the climate vulnerability of smallholder agriculture: these are interconnected problems that no single IMF tranche will resolve.
The early 2000s showed that Pakistan can grow — and when it grows inclusively, poverty falls. The ingredients are known. What is required is the political economy to assemble them: debt relief to create fiscal space, tax reform to fund public investment, industrial policy to generate jobs, and climate adaptation to protect the rural poor.
Aslam cannot wait another decade for the theory to become practice. Neither can the 70 million Pakistanis who share his predicament.
Discover more from The Economy
Subscribe to get the latest posts sent to your email.


Oil Markets
China’s Oil Shock Absorber: How Beijing Kept Crude Prices Half of What Analysts Predicted

Analysts predicted oil above $200 during the Hormuz crisis. China’s intervention kept prices roughly half that. Fortune and Bloomberg explain how Beijing did it — and why the strategy has limits that markets have not fully priced in.
The $200 Oil That Never Arrived
When Iranian forces declared the Strait of Hormuz closed in early March 2026, the analytical consensus in energy markets shifted rapidly toward a catastrophic scenario. The Strait carries 27% of globally traded crude oil and petroleum products (Congressional Research Service, 2026). Iran had demonstrated both the capability and willingness to enforce that closure through attacks on shipping. A sustained blockade, analysts projected, could push Brent crude to $150, $175, or even above $200 per barrel — levels not seen since the 1970s oil shocks in real terms.
Brent reached approximately $113 at its peak in April. That is a severe price spike by any historical standard — a 100%-plus rise from January levels of around $56. But it is emphatically not $200. And the primary reason it is not $200, according to reporting from Fortune and Bloomberg, is China (Fortune, June 2026).
How Beijing managed to suppress oil prices to roughly half of what the most bearish forecasters projected — and why analysts warn that capability has limits — is one of the most consequential and under-analysed stories in global energy markets this year.
Key Takeaways
- Analyst consensus during the Hormuz closure was for Brent crude to potentially breach $200/barrel
- China’s strategic reserve releases, demand management, and alternative supply sourcing kept prices around $100–113 at their peak
- China receives approximately one-third of its total oil imports via the Strait of Hormuz
- Beijing is reportedly running out of its ability to continue suppressing oil price volatility through reserves alone
- The longer-term consequence may be a permanent reshaping of Asian energy supply chains away from Gulf dependence
China’s Structural Exposure and Its Response
China is not merely a passive participant in global oil markets. It is, by a significant margin, the world’s largest crude oil importer, and the Strait of Hormuz occupies a central role in its energy security architecture. Approximately one-third of China’s total oil imports — representing about 3–4 million barrels per day — transits the Strait of Hormuz (Wikipedia / 2026 Hormuz Crisis). The disruption of that supply was not an abstract geopolitical concern for Beijing; it was a direct threat to industrial production, electricity generation, and economic stability.
China’s response operated on multiple fronts simultaneously. The most immediate was the release of strategic petroleum reserves — a buffer that Beijing has been systematically expanding since the early 2000s precisely in anticipation of supply disruptions. China’s strategic reserve capacity, estimated at approximately one billion barrels by the time of the conflict, provided a multi-month cushion that allowed Chinese refineries to maintain throughput without paying spot prices at the elevated levels that would otherwise have cleared the market (Wikipedia / Hormuz Crisis).
Simultaneously, Beijing accelerated the diversification of its spot purchasing toward West African, Russian, and Central Asian supply — suppliers not exposed to the Strait bottleneck. Russia, whose pipeline export routes run overland through Central Asia and whose Pacific coast ports access Chinese markets without Middle East transit, saw a significant increase in contracted volumes. The rapid rerouting of demand is a function of commercial relationships that China’s National Petroleum Corporation and Sinopec have been cultivating for precisely this scenario for over a decade.
Demand Management: The Hidden Tool
Less visible but equally important was demand-side management. China’s centralised economic planning apparatus has tools that market economies simply do not possess. When spot crude prices spiked, Chinese industrial regulators directed state-owned enterprises in energy-intensive sectors — aluminum smelting, steel production, cement manufacturing — to reduce output or shift to pre-accumulated inventory rather than purchase at market prices.
This is not a price mechanism adjustment; it is a direct administrative intervention in the quantity of oil demanded. By reducing industrial throughput in sectors where the marginal cost of a production pause is relatively low, Beijing effectively shifted the demand curve downward during the period of peak supply disruption — suppressing the equilibrium price without directly intervening in international markets.
The geopolitical complexity of this strategy should not be overlooked. China’s demand management created cover for an implicit diplomatic position: Beijing was neither supporting the U.S.-led international effort to reopen the Strait nor openly backing Tehran’s closure. It was simply managing its own economic exposure — a position that Xi Jinping could maintain with public statements calling the Strait’s openness “in the common interest of regional countries and the international community” while privately doing whatever was necessary to insulate the Chinese economy from the worst consequences (Wikipedia / Hormuz Crisis).
Why the Strategy Has Limits
Fortune’s analysis is clear: China’s oil shock absorption cannot continue indefinitely, and cannot protect global markets much longer at current intensity (Fortune, June 2026).
The strategic petroleum reserve, however large, is a finite buffer. It is designed to cover weeks or a few months of disruption — not a sustained multi-year reorientation of global supply chains. Every barrel released from reserve must eventually be replaced, and replacement purchases at a time of market tightness push prices back up. If the Hormuz situation were to deteriorate again after a partial reopening, China’s reserve cushion would be materially depleted compared to its pre-crisis level.
The administrative demand management approach also carries economic costs that compound over time. Cutting aluminum or steel output during a supply shock is tolerable for weeks. Sustained output reductions damage trade relationships, create delivery failures on international contracts, and impose real economic costs on the downstream industries that depend on those materials. At some point, the cost of demand suppression exceeds the cost of simply paying higher oil prices.
The most durable consequence of the crisis is not what China did in the short term — it is what it is now doing structurally. Long-term supply agreements with non-Gulf producers, accelerated domestic refinery investment, expanded strategic reserve capacity, and intensified electric vehicle and renewable energy adoption are all being fast-tracked as direct lessons of the 2026 disruption. Those investments will reduce China’s Hormuz dependency over a five-to-ten-year horizon — permanently altering the geopolitical leverage that control of the Strait confers.
What This Means for Global Oil Prices
The two-sided implication for global energy markets is stark. In the near term, as the Hormuz deal is implemented and Chinese reserve releases wind down, the physical oil market will need to find a new equilibrium without Beijing’s suppressive effect. The natural clearing price — in the absence of further disruption — is likely in the $75–90 Brent range, reflecting OPEC-plus production discipline, recovering non-Gulf supply, and the partial demand destruction caused by the price spike.
In the medium term, China’s structural shift away from Gulf dependency represents a secular demand reduction for Hormuz-routed barrels. That reduction, distributed across a five-to-ten year transition, is manageable for Gulf producers who can reroute via pipeline (Saudi Arabia, UAE) but is structurally damaging for those who cannot (Iraq, Kuwait, Qatar).
For energy investors, the China oil story of 2026 offers a counterintuitive insight: the country that was most exposed to the supply disruption also proved to be the most effective damper on the price shock. That capability will not disappear — but it will not be unlimited either. The next disruption will test reserves and administrative levers that are now partially depleted, and the price response, when it comes, may be harder to contain.
Discover more from The Economy
Subscribe to get the latest posts sent to your email.
Analysis
U.S. Inflation at a Three-Year High: How the Iran War Turned an Economic Recovery Into a Stagflation Risk

U.S. inflation hit 4.2% in May 2026 — its highest since April 2023 — driven by an oil price surge linked to the U.S.-Iran conflict and the Strait of Hormuz closure. Here’s what it means for households, the Fed, and economic growth.
Key Takeaways
- U.S. CPI rose 4.2% year-on-year in May 2026, the highest reading since April 2023
- Core CPI (ex-food and energy) is more contained at 2.9%, limiting but not eliminating the Fed’s concern
- WTI crude rose from ~$57/barrel in January to a peak of $113 in April — nearly doubling in three months
- The Federal Reserve has revised its 2026 PCE inflation forecast up sharply, from 2.7% to 3.6%
- The risk of second-round inflationary effects — where energy costs embed into the broader price level — is Citigroup’s primary concern
From Recovery to Renewed Pressure
Entering 2026, the U.S. economic outlook appeared broadly constructive. Inflation had trended down from post-pandemic peaks; the Federal Reserve had delivered three successive quarter-point rate cuts in the final months of 2025; the labour market, while cooling, remained healthy; and consumer spending was proving more resilient than many forecasters expected.
Then, in late February 2026, the United States and Israel launched military operations against Iran, and the macroeconomic calculus changed almost overnight.
The Consumer Price Index rose 4.2% year-on-year in May 2026 — the highest annual reading since April 2023, and a dramatic reversal of the disinflationary trajectory that had defined 2024 and most of 2025 (CBS News, June 2026). The Federal Reserve revised its headline PCE inflation forecast for 2026 up from 2.7% to 3.6% at the June FOMC meeting — a 90-basis-point upward revision in a single quarter, the most aggressive single-meeting inflation reassessment in years (Fox Business, June 17, 2026).
The Oil Price Channel: From $57 to $113
The transmission mechanism is straightforward. Iran’s declaration that the Strait of Hormuz was “closed” on March 4, 2026 — through which approximately 27% of globally traded crude flows — created an immediate and severe supply shock. West Texas Intermediate crude futures rose from approximately $57 per barrel at the start of the year to a peak of $113 in April (U.S. Bank Asset Management, June 2026).
At the pump, the consequences were immediate. U.S. gasoline prices track crude oil prices closely, with a lag of several weeks. By the time WTI peaked in April, American consumers were paying materially more to fill their tanks, heat their homes, and power their businesses. Energy is both a direct component of the CPI and an indirect input cost for virtually every sector of the economy — transportation, manufacturing, agriculture, and retail alike.
The energy shock was the primary driver behind the May CPI reading. Core inflation — which strips out volatile food and energy prices and is the Fed’s preferred gauge of underlying price dynamics — came in at a more contained 2.9% (NPR, June 17, 2026). That 130-basis-point gap between headline and core is the central interpretive challenge facing policymakers: it suggests the inflation is mostly a supply shock rather than a demand-driven phenomenon — but that is cold comfort when households are paying 4.2% more for their consumption basket than they were a year ago.
The Second-Round Effect: The Slow Spread
The more dangerous scenario, from a monetary policy perspective, is not the initial energy price spike — it is what economists call second-round effects. These occur when energy cost increases flow into the prices of non-energy goods and services through transportation costs, higher manufacturing input costs, and wage demands that workers make in response to a higher cost of living.
Citigroup flagged this risk in a late-May research note, warning that the prolonged run-up in crude prices was already beginning to spill into broader inflation pressures, with second-round effects becoming visible in sectors where energy costs are a significant input — logistics, food processing, and industrial manufacturing in particular (CNBC, May 28, 2026). Once second-round effects are embedded in the wage-price dynamic, the supply-shock origin becomes irrelevant: the inflation is self-sustaining regardless of what happens to oil.
This mechanism is why the Federal Reserve — which under normal doctrine would look through a supply-driven energy shock — has moved to a hawkish posture despite the conflict being the source of price pressure. Nine of 18 FOMC members now project a rate hike before year-end 2026 (Fox Business). The committee has explicitly raised its inflation outlook and removed its easing-biased forward guidance. That is not the behaviour of a central bank confident it can look through an energy spike.
Labour Market Complexity
What makes this inflation episode particularly difficult to manage is the backdrop of a surprisingly resilient labour market. U.S. employers added an average of 188,000 jobs per month over the three months to May, and the unemployment rate has held steady at 4.3% for a full year — a remarkably stable number given the geopolitical disruption (CNBC, June 17, 2026).
In a conventional supply-shock inflation scenario, one would expect the real income compression caused by higher energy prices to dampen consumer spending and slow growth — effectively doing the Fed’s tightening work for it. That has not clearly happened yet. Consumer spending has remained resilient, supported by a tight labour market, lower income and corporate taxes enacted earlier in the Trump administration, and fiscal tailwinds from government spending programmes.
The combination of elevated inflation and a still-strong labour market is, in monetary policy terms, the worst of all worlds for a central bank trying to justify patience. It removes the “growth is already slowing” argument that would otherwise support a hold-and-wait posture. The hawks within the FOMC have a clean case: prices are too high, jobs are plenty, and there is no compelling reason to leave rates where they are.
How American Households Are Feeling It
Behind the statistics is a lived economic reality for American households. Inflation has now been running above the Fed’s 2% target for five consecutive years (Fox Business). The compounding effect of sustained above-target inflation on real purchasing power is substantial: a household that was earning $75,000 in 2021 needs approximately $89,000 in 2026 to maintain the same standard of living, even before accounting for the latest energy-driven spike.
The political consequences are significant. Inflation is historically the most potent economic grievance among voters. An inflation reading of 4.2% — after a period when the public narrative had shifted to “inflation is under control” — represents a reputational setback for the administration and a genuine hardship for lower- and middle-income households, who spend a disproportionate share of their income on energy and food.
SNAP benefit restrictions — under active congressional consideration — would compound the impact on the most vulnerable households. Food companies and grocery chains are watching the policy debate closely, as changes to SNAP purchasing rules could meaningfully alter demand patterns for staple goods (CNBC, June 20, 2026).
The Path Forward
The good news — and it is significant — is that the primary driver of the inflation surge is now partially reversing. Brent crude has retreated from its April peak of approximately $113 to approximately $78 by mid-June, as the U.S.-Iran peace framework reduces near-term supply disruption fears (Al Jazeera, June 17, 2026). If Brent settles in the $70–80 range and the Strait reopening is durable, the energy component of CPI should provide disinflationary relief in the June, July, and August prints.
The lagged second-round effects will take longer to unwind. Wage growth that has been pulled higher by workers’ cost-of-living concerns does not retreat immediately when pump prices fall. Transportation costs embedded in goods pricing take months to work out of supply chain contracts. Services inflation — already running hot before the conflict — has limited sensitivity to oil prices in either direction.
The base case, shared by most economists surveyed ahead of the June FOMC meeting, is that inflation moderates back toward 3% by year-end as energy effects dissipate — but that the Fed holds rates steady at best, and hikes once at worst. The stagflationary risk — where growth slows meaningfully while inflation remains above target — is not the central scenario but is no longer a tail risk.
Discover more from The Economy
Subscribe to get the latest posts sent to your email.
IPO
IPO Summer 2026: Anthropic, OpenAI, and the Race to Price Artificial Intelligence on Public Markets
With SpaceX now public, Anthropic has confidentially filed at a ~$965 billion valuation and OpenAI follows at $852 billion. We break down what their IPOs mean for public markets, AI competition, and investors.
Key Takeaways
- Anthropic confidentially filed its S-1 with the SEC on June 1, 2026; OpenAI followed on June 8
- Anthropic’s latest funding values it at approximately $965 billion; OpenAI targets a $852 billion debut valuation
- Anthropic’s annualised revenue run rate crossed $44–47 billion in May 2026, growing at roughly 10x per year
- Both Goldman Sachs and Morgan Stanley are bookrunning both deals, each expected to raise at least $60 billion
- Together with SpaceX, the three mega-IPOs could demand north of $200 billion from public markets in 2026
The Year Public Markets Had to Price AGI
SpaceX’s June 12 debut was historic. But in the longer narrative arc of 2026, it may prove to be the prelude. With Elon Musk’s rocket company now trading on the Nasdaq and raising $85.7 billion in the largest IPO in history, Wall Street’s attention has pivoted immediately to the next act: Anthropic and OpenAI, the two companies whose products are reshaping global knowledge work, coding, legal services, healthcare, and finance — and whose valuations are asking public markets to price something it has never priced before: the plausible path to artificial general intelligence.
The sequence is moving fast. Anthropic confidentially filed its S-1 with the SEC on June 1, 2026, the company confirmed in a blog post that day (Fortune, June 1, 2026). OpenAI followed exactly one week later, on June 8, announcing its own filing rather than allowing it to leak — a signal from Sam Altman’s team that they intend to control the IPO narrative (FutureSearch, June 2026). Both are bookrun by the same dual-bank syndicate: Goldman Sachs and Morgan Stanley, each expected to raise at least $60 billion (FutureSearch).
Anthropic: The Quiet Frontrunner
Twelve months ago, Anthropic was universally described as OpenAI’s challenger. Today, by several key metrics, it has pulled ahead. The company’s annualised revenue run rate crossed $44–47 billion in May 2026, compounding at approximately 10x per year — a growth rate that makes OpenAI’s roughly 3.4x annualised growth look almost conventional by comparison (IndMoney, June 2026; BitMEX).
Anthropic raised $30 billion in a Series G round in February 2026 at a $380 billion post-money valuation, before a $65 billion Series H-1 round in May pushed the private valuation to approximately $965 billion — eclipsing OpenAI’s valuation for the first time (Fortune, June 2026). The company is also on track to post its first-ever operating profit in Q2 2026, projecting approximately $559 million on $10.9 billion in quarterly revenue (IndMoney).
The enterprise thesis is central to Anthropic’s public market story. Approximately 80% of revenue comes from enterprise customers, and Anthropic’s share of the enterprise AI market surpassed OpenAI’s for the first time in April 2026, driven by Claude’s dominance in agentic coding workflows, legal research, and financial analysis (IG UK, June 2026). Anthropic has told investors its annualised run rate will surpass $50 billion by July, and has projected $70 billion in revenue with $17 billion in free cash flow by 2028 (IG UK).
The risks are real. A $5.6 billion net loss in 2024 and a 2028 cash-flow profitability target — rather than an immediate one — mean investors must take a long-dated view. The company is also embroiled in a legal dispute with the U.S. government after the Pentagon designated it a supply-chain risk, a designation Anthropic argues could jeopardise billions in revenue (Fortune). Additionally, a June 12 regulatory action suspending the “Claude Fable” model export has widened the tail risk on Anthropic’s IPO timeline, pushing the p10 downside date out to April 2028 in some analyst models (FutureSearch).
The consensus target date for Anthropic’s listing is December 2026, with a first-day market cap median of approximately $1.10 trillion — which would make it the first pure-enterprise AI safety company to trade publicly, and one of the most valuable companies ever to debut (FutureSearch).
OpenAI: Bigger by Brand, Smaller by Growth Rate
OpenAI carries extraordinary brand recognition — ChatGPT crossed 900 million weekly active users by early 2026 — and its revenue trajectory, while slower than Anthropic’s in percentage terms, is still formidable in absolute terms: revenues grew from approximately $2 billion annualised in 2023 to over $20 billion by end-2025 (IndMoney).
But the loss picture gives public investors pause. FutureSearch estimates OpenAI’s 2026 GAAP net loss at $25–26 billion against a widely cited $14 billion non-GAAP figure — a gap that reflects the difference between the story management is telling on the roadshow and the financial reality a public company must disclose in quarterly filings (FutureSearch). The 90-day post-IPO market cap estimate of $0.86 trillion — materially below the first-day median — reflects the prediction that institutional models, once they have time to fully digest the loss line, will price more conservatively than day-one narrative demand.
OpenAI’s $852 billion debut valuation target positions it slightly below Anthropic’s pre-IPO mark (Fortune, June 2026). The later it lists, the more revenue compounds under the number — meaning OpenAI has a structural incentive to maximise quality of disclosure ahead of its September target rather than rush to beat Anthropic to market.
The Capital Markets Challenge: Can the System Absorb It?
The scale of capital being demanded is genuinely unprecedented. SpaceX alone raised $85.7 billion. Anthropic and OpenAI are each expected to raise at least $60 billion. Total 2026 U.S. IPO proceeds could reach approximately $160 billion, according to Goldman Sachs projections — against a 2025 baseline of $45 billion (IndMoney).
The liquidity case is that there is an estimated $8 trillion sitting in U.S. money market funds. SpaceX’s $85.7 billion raise represents roughly 1% of that pool. Institutional investors who have spent years gaining AI exposure indirectly — via Nvidia for chips, Microsoft for its OpenAI stake, Alphabet for its Anthropic investment — now have the option of owning the underlying models directly. The pent-up demand for pure-play AI exposure is enormous.
The displacement risk is subtler but real. Money rotating into SpaceX, Anthropic, and OpenAI must come from somewhere — and that somewhere is likely existing Magnificent 7 positions or cash allocations that would otherwise flow into other sectors (IndMoney). The portfolio rebalancing triggered by three mega-listings could create meaningful headwinds for established large-cap tech stocks in the second half of 2026.
The Race to First-Mover Advantage
Anthropic’s decision to file first was strategically deliberate. By going to market ahead of OpenAI, the company avoids being overshadowed by its more famous rival and benefits from scarcity — institutional investors who buy Anthropic have less capital available for OpenAI when it comes. OpenAI, meanwhile, gains a tactical advantage from watching how the market prices audited frontier AI financials before committing to its own price.
It is worth noting, as IG UK observes, that both companies filed within days of each other despite being direct competitors — suggesting that both management teams made independent calculations that the post-SpaceX IPO window represents an optimal moment for AI listings, when investor appetite for frontier technology is at a verifiable high and the SpaceX roadshow has done the work of educating institutional allocators on how to think about pre-profitability, mission-driven, deeply moated technology businesses (IG UK).
2026: The Year That Changes Public Markets Forever
If SpaceX, Anthropic, and OpenAI all complete their listings before year-end, 2026 will be remembered as the year public markets were forced to price artificial general intelligence for the first time. Their combined target valuations of approximately $3.6 trillion equal the GDP of France — and they are not asking investors to value what they earn today, but what humanity becomes tomorrow (IndMoney).
That is a proposition without precedent in the history of capital markets. Whether public markets accept it enthusiastically, price it conservatively, or — as some veteran investors warn — create the conditions for a correction of historic proportions when the gap between narrative and quarterly earnings becomes undeniable, is the central investment question of 2026.
Discover more from The Economy
Subscribe to get the latest posts sent to your email.

Goldman Sachs: “The Circulatory System Is Not Working”

Why the U.S. Budget Airline Model Is Running Out of Runway

China’s Oil Shock Absorber: How Beijing Kept Crude Prices Half of What Analysts Predicted

CRH Nears Biggest-Ever Deal to Acquire Arcosa

U.S. Inflation at a Three-Year High: How the Iran War Turned an Economic Recovery Into a Stagflation Risk

IPO Summer 2026: Anthropic, OpenAI, and the Race to Price Artificial Intelligence on Public Markets

Strait of Hormuz Crisis 2026: How a Waterway War Broke Global Oil Markets

Kevin Warsh’s Fed Debut: Rate Hikes Now on the Table as U.S. Monetary Policy Enters a New Era

SpaceX IPO 2026: Inside the $85.7 Billion Listing That Made Elon Musk the World’s First Trillionaire

PSX KSE-100 Up 500+ Points: The Geopolitical Impact on Stocks

Did Anthropic Talk Its Way Into an AI Export Ban?

Big Bonuses for South Korea’s Chip Workers Put Central Bank on Inflation Alert

Easing Iran Tensions Push Mortgage Rates Lower — But a Potential Fed Hike Clouds the Outlook

Paramount’s $111 Billion Warner Bros. Discovery Merger Clears DOJ, But Faces New Hurdles

China Overhauls the World’s Biggest Surveillance Network with Advanced AI

SpaceX IPO: Inside the $2 Trillion Market Debut

KPMG Australia CEO Resigns After Whistleblower Claims Exposed Investigation Failures

PwC China Partner Payouts Cut Amid Evergrande Audit Fraud

Broadcom Market Value Loss: Revenue Forecast Disappoints

The Guardrails Are Down: How Meta and Google’s AI Models Fold Under Pressure

Pakistan Budget FY 2026-27: Relief, Prospects, and the Tightrope Walk

Benefitbay Raises $18M to Build the Plumbing for America’s ICHRA Shift

Nasdaq Tumbles 4% as Chip and Memory Stocks Sink: A $1.2 Trillion Wipeout

Here’s How Much It’ll Cost You to Be Part of SpaceX’s Record-Breaking $75 Billion IPO

Japanese Mid-Sized Firms Flock to Southeast Asia for Growth

Singapore Puts a Clock on Wealth: MAS Orders Banks to Halve Account-Opening Times

Can Exxon Build the World’s Biggest Carbon Capture Business?

Smash Capital Leads $200M Funding for Allen Control Systems
-

 Markets & Finance6 months ago
Top 15 Stocks for Investment in 2026 in PSX: Your Complete Guide to Pakistan’s Best Investment Opportunities
-

 Analysis4 months ago
Top 10 Stocks for Investment in PSX for Quick Returns in 2026
-

 Analysis5 months ago
Brazil’s Rare Earth Race: US, EU, and China Compete for Critical Minerals as Tensions Rise
-

 Analysis4 months ago
Johor’s Investment Boom: The Hidden Costs Behind Malaysia’s Most Ambitious Economic Surge
-

 Banks5 months ago
Best Investments in Pakistan 2026: Top 10 Low-Price Shares and Long-Term Picks for the PSX
-

 Investment5 months ago
Top 10 Mutual Fund Managers in Pakistan for Investment in 2026: A Comprehensive Guide for Optimal Returns
-

 Global Economy6 months ago
15 Most Lucrative Sectors for Investment in Pakistan: A 2025 Data-Driven Analysis
-

 Global Economy6 months ago
Pakistan’s Export Goldmine: 10 Game-Changing Markets Where Pakistani Businesses Are Winning Big in 2025