
Analysis
Singapore Puts a Clock on Wealth: MAS Orders Banks to Halve Account-Opening Times

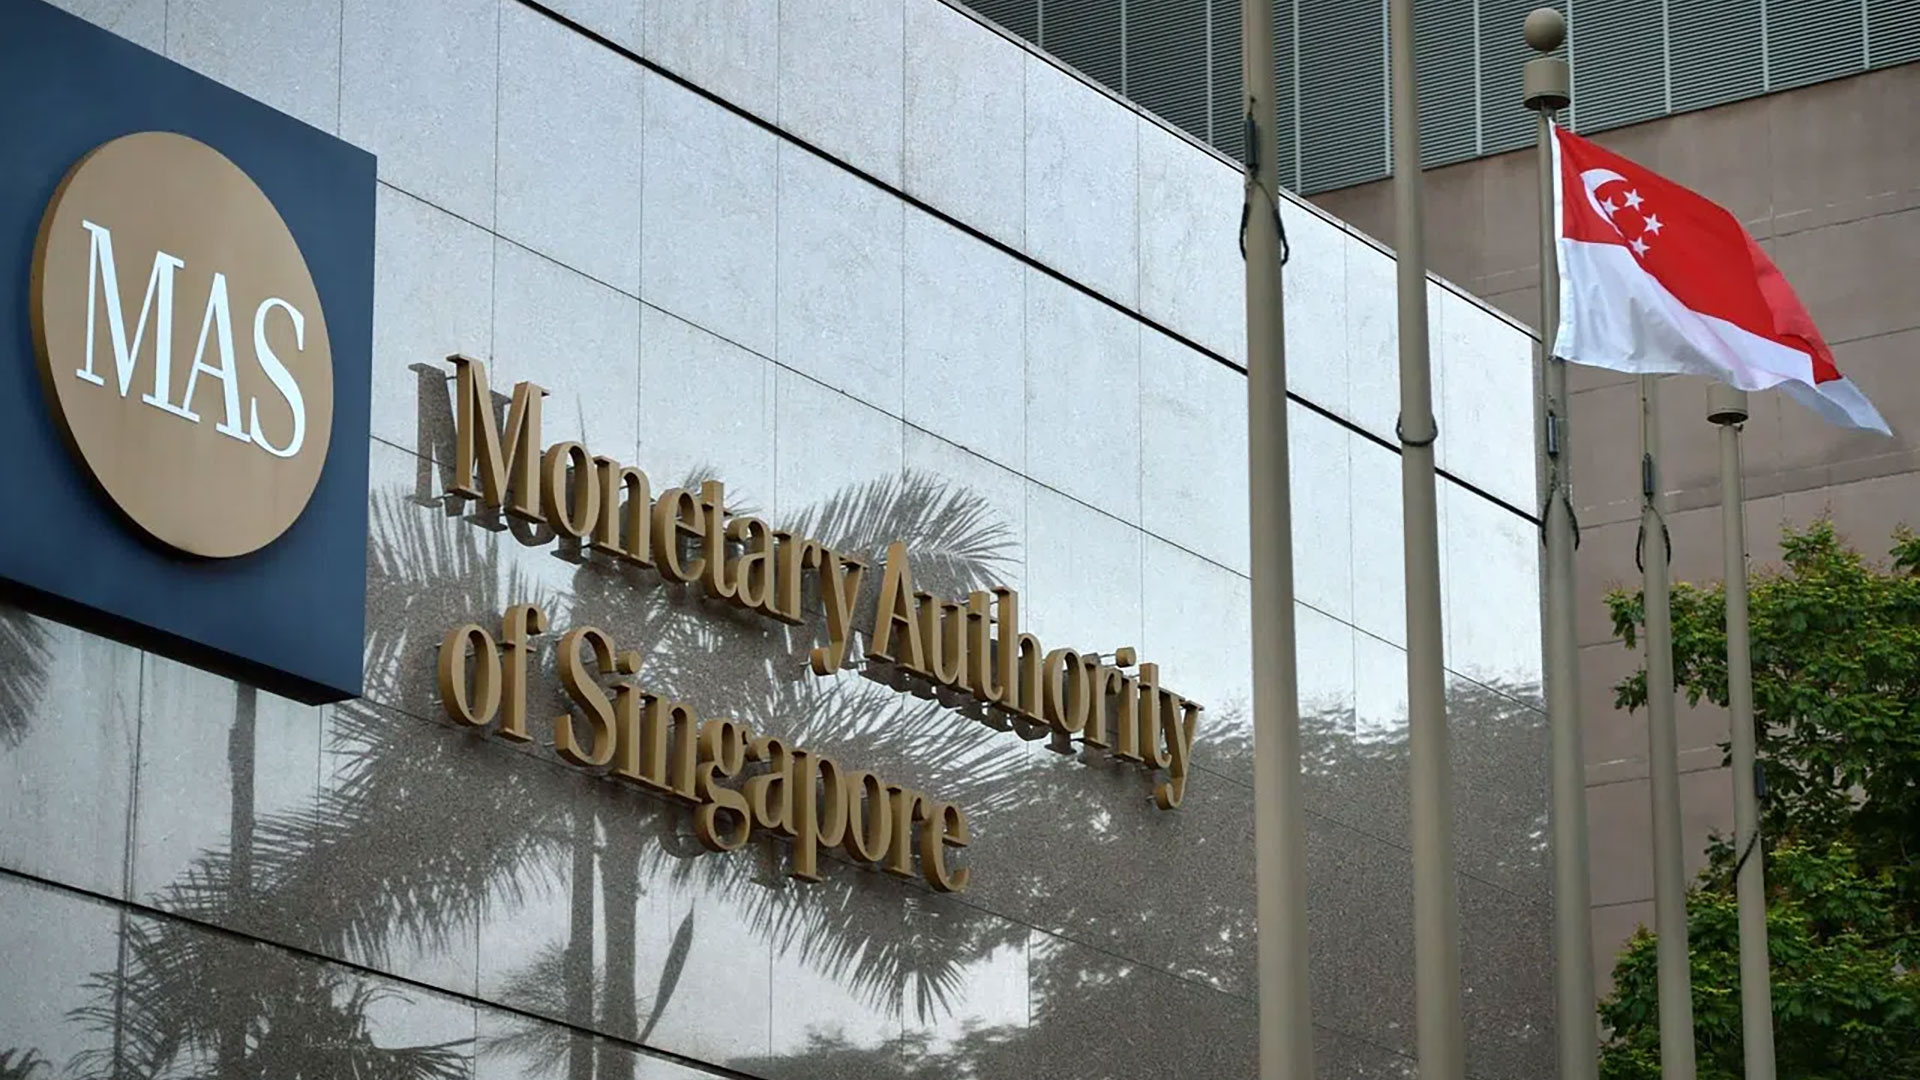
The queue outside Singapore’s private banking system has, until now, been invisible. For the ultra-wealthy arriving in the city-state with capital to place and patience they won’t spend, the wait has mattered enormously. On Monday, 25 May 2026, Chia Der Jiun, managing director of the Monetary Authority of Singapore, told an audience at the UBS Asian Investment Conference that private banks must cut account-opening times for wealthy clients to within one month — down from a current median of roughly six weeks, and considerably longer for the most complex cases. The regulator didn’t merely advise. It issued a circular to all financial institutions the same day.
Setting the Scene: A Wealth Hub Under Pressure
The directive arrives at a moment of genuine tension for one of Asia’s most prized financial addresses. Singapore’s private wealth industry has grown at a pace that rivals any jurisdiction on earth. By the end of 2024, the city-state’s total assets under management had reached approximately SGD 6.7 trillion, representing 12% year-on-year growth, with roughly 77% of those assets originating from outside Singapore’s borders. The number of single-family offices had surpassed 2,000 by late 2024, up from just 400 in 2020. Capital from mainland China, India, and Southeast Asia continues flowing in, often alongside the physical relocation of the families that own it.
Yet behind those figures sits an uncomfortable reality. Following Singapore’s largest-ever money laundering scandal — a S$3 billion case that resulted in the conviction of 10 Chinese nationals and, in July 2025, in fines totalling S$27.45 million across nine financial institutions — banks across the city-state began applying due diligence checks of a scope and duration that industry insiders say went well beyond what regulators actually required. The result was measurable and damaging: wealthy clients left. Some didn’t come back. Others never arrived.
Singapore’s financial establishment watched as account-opening timelines bloated, family office applications stalled, and the city-state’s reputation for efficient administration — one of its core competitive assets — began to fray.
Singapore Private Banking Account Opening: A New One-Month Mandate
The mechanics of the MAS’s new directive are precise. The regulator wants Singapore private banking account opening procedures for wealthy clients completed within one calendar month, not the six weeks that had become the industry norm, nor the year that some family offices once waited simply for their tax incentive applications to be processed. Chia Der Jiun, who delivered the announcement at the UBS Asian Investment Conference in Singapore, framed the move as a “risk-appropriate” approach — designed to ensure banks avoid unnecessary and excessive checks on clients’ sources of wealth while maintaining high standards. The Edge Singapore
The circular issued on 25 May gives financial institutions more detailed guidance on this calibrated approach. The industry will also develop case studies and training materials for bankers and compliance professionals — a signal that the problem isn’t purely structural, but cultural. Banks, spooked after the 2023 scandal, had defaulted to over-caution. Every application became a potential liability. Every wealthy client, a possible source of reputational risk.
That caution carried real commercial consequences. Research published earlier this year found that nearly 90% of banks operating in Singapore lost clients in 2024 due to slow or inefficient onboarding — the highest rate among all major financial hubs, outpacing both the United Kingdom and the United States. Only 1% of Singapore’s banks had successfully automated the majority of their KYC and onboarding workflows. The rest were relying on manual processes that made every wealthy client application a slow, expensive exercise.
The timing of the MAS intervention reflects a frank acknowledgement that the compliance overcorrection had gone too far. Speaking earlier at a separate engagement, Minister Chee Hong Tat, who serves as both Singapore’s National Development Minister and deputy chairman of the MAS, described the country’s approach to risk plainly: Singapore takes a “risk-proportionate approach, and not a zero-risk approach” — because excessive caution forfeits new opportunities. itiger
For banks, the immediate challenge is operational. Reducing an account-opening timeline from six weeks to four — without compromising anti-money laundering standards that the MAS has spent years fortifying — requires either additional staff, smarter technology, or a fundamental redesign of compliance workflows. The new circular appears designed to give institutions permission to streamline, and expectation, not just encouragement, to do so. Regulators rarely issue circulars they don’t intend to follow up on.
Why Singapore’s Compliance Pendulum Swung Too Hard — And What It Cost
To understand why the MAS felt compelled to intervene, it helps to trace the arc of events that produced the problem. The 2023 money laundering case was, by any measure, a watershed. Authorities seized more than S$3 billion in assets — prime real estate, luxury vehicles, gold bars, cryptocurrency — from a network of ten Chinese nationals who had used Singapore’s financial system to launder proceeds from overseas criminal operations, including illegal online gambling. In its aftermath, banks didn’t simply tighten controls. Many effectively froze. Compliance functions that were already expanded after enforcement actions tied to the 1MDB scandal added layers of documentation and review that slowed every application, regardless of client profile.
How long does it take to open a private bank account in Singapore in 2026?
As of May 2026, the median timeline for opening a private banking account in Singapore is approximately six weeks, with complex cases taking significantly longer. The MAS has now directed banks to complete standard account-opening procedures within one month, applying a risk-calibrated process that avoids excessive documentation requirements for clients whose wealth sources are transparent and well-substantiated.
The picture is more complicated than it first appears. The nine institutions fined S$27.45 million in July 2025 — including UBS, Citibank, UOB, DBS, Julius Baer, and others — weren’t penalised for being too lenient. They were penalised for inconsistency: poor implementation of the controls they already had in place. The lesson was subtle and easily missed: the core problem wasn’t too little compliance infrastructure. It was compliance infrastructure that had lost its sense of purpose.
What followed was institutional overcorrection on a considerable scale. Compliance teams, uncertain about what the regulator actually expected, defaulted to maximum friction. The rational response to ambiguity in a heavily regulated industry is always to do more, never less. The new MAS guidance — particularly the case studies and training modules the authority has promised — is an attempt to replace that ambiguity with operational clarity, giving compliance officers a framework they can apply with confidence rather than anxiety.
The commercial consequences were concrete. Standard Chartered, whose Singapore operations draw heavily on Chinese wealth flows, reported that the string of money-laundering investigations had prompted closer inspection of sources of wealth and led to delays in account openings — with some clients considering Gulf states, where setting up accounts can be materially less complex. The bank had already committed $1.5 billion over five years to expanding its Asian wealth management operation. That investment was being undermined, at least in part, by process drag. Yahoo Finance
Singapore vs. Dubai: The Real Stakes in Asia’s Wealth Hub Race
The competitive dimension of this directive is impossible to separate from the policy one. Singapore’s most pressing rival for Asia’s mobile capital isn’t Hong Kong alone — it’s Dubai. The UAE has invested heavily in private wealth infrastructure, including legal frameworks designed explicitly for wealthy family structures and an onboarding reputation that relationship managers across Asia describe, with barely concealed envy, as genuinely frictionless. For clients accustomed to opening Gulf accounts within days, a six-week wait in Singapore — however explicable in context — became a persuasive argument for taking their business elsewhere.
Industry gatherings in late 2025 and early 2026 reflected an anxiety that rarely appeared in official statements. Singapore retains a structural long-term advantage as a wealth centre, but competition from Dubai and a reviving Hong Kong is measurably intensifying. Talent is a parallel concern. Employment pass complexity has been a recurring grievance in Singapore’s private banking community, while Dubai’s relative accessibility — for both clients and the bankers who serve them — has drawn notice at senior management level.
The MAS directive addresses the most tractable of these problems: processing speed. It doesn’t resolve talent bottlenecks or employment pass friction. But it removes the most visible and most easily articulated grievance among wealthy clients weighing Singapore as a booking centre. For a city-state whose wealth management AUM reached approximately SGD 6.7 trillion by the end of 2024, with the overwhelming majority of assets originating abroad, protecting inflows is a strategic necessity, not a preference.
The downstream implications for Singapore’s domestic banks are equally significant. DBS, OCBC, and UOB have all built private banking operations whose earnings depend directly on the city-state’s wealth hub status. DBS’s multi-family office vehicle crossed SGD 1 billion in AUM in September 2025, with its leadership targeting a doubling to SGD 2 billion by end-2026. Faster onboarding doesn’t just improve client experience — it accelerates the start of fee-earning relationships, a meaningful driver for any institution competing on wealth management margin.
The MAS circular’s second-order effect may ultimately prove more valuable than its first. By signalling that Singapore’s compliance culture is shifting from fear-driven excess to precision-driven adequacy, the regulator is attempting to reframe the city-state’s offer to global wealth managers. That reframing matters in a business built on relationships, discretion, and long-term trust — not just regulatory tables.
The Case for Caution: Why Speed Has Its Costs
Not everyone in Singapore’s financial community greets the push for faster account openings without qualification.
The 2023 scandal exposed something important about the limits of expedited onboarding: motivated actors can pass surface-level due diligence checks. The ten individuals convicted had used multiple passports, operated through shell companies, and in several instances built credible-looking business profiles over years. They weren’t obvious risks. They were, in the language of AML professionals, designed to pass. Whether a one-month standard creates meaningfully more risk than a six-week one is a question that compliance professionals answer differently, depending on what they’ve seen.
Critics of the calibration argument point out that the institutions fined by MAS in July 2025 weren’t penalised for working too quickly — they were penalised for missing things they should have caught regardless of timeline. Compressing the processing window doesn’t fix the underlying detection problem; it simply reduces the time available to make mistakes that were already being made.
There’s also the less comfortable observation that efficient onboarding is desirable to bad actors as well as good ones. The industry’s most seasoned compliance professionals know this tension intimately: streamlined processes reduce friction across the board. The new MAS framework, which speaks of “risk-appropriate” rather than simply “faster” procedures, acknowledges this. Its success will depend on whether individual banks interpret the guidance as a calibration instrument — a tool for distinguishing necessary scrutiny from unnecessary delay — or as a commercial green light to cut corners under regulatory cover.
The MAS appears to be betting on the former.
A Bet on Calibration, Not Permissiveness
The directive issued on 25 May 2026 is, in its essence, a wager on precision over bluntness. Singapore made one substantial overcorrection after 2023 — not the initial tightening, which was warranted by the scale of what had been allowed to occur, but the subsequent retreat into defensive excess that pushed legitimate wealth toward the exit and kept it there. The MAS is now attempting to recalibrate: not to the permissive norms that allowed a S$3 billion scandal to develop undetected, but to a standard of precision that is both commercially sustainable and genuinely protective.
What that requires is not a relaxation of standards. It requires shared clarity about what those standards actually demand in practice. Compliance officers, relationship managers, and the private banks that employ them will spend the months ahead working through whether the new circular delivers that clarity or merely adds another layer of interpretation for already-stretched teams to navigate.
Asia’s capital is patient in the long run, but impatient in the short one.
In high finance, the most dangerous thing is rarely being too strict or too lenient. It’s not knowing, with confidence, which one you are.
Discover more from The Economy
Subscribe to get the latest posts sent to your email.



Key Takeaways
- Rolex’s secondary market rose approximately 7.9% year-over-year as of 2026 (per WatchCharts data) — trailing Patek Philippe (+16.2%) and Tudor (+11.4%) but still outperforming Audemars Piguet (+3.4%).
- Rolex raised U.S. retail prices 4–9% in January 2026 (steel models ~5.6%, gold models ~8.7%), narrowing the historical gap between retail and pre-owned pricing.
- Not every model appreciates: steel sports references (Submariner, GMT-Master II, Daytona) have held value far better than two-tone or widely available dress references like the standard Datejust.
- The Lady-Datejust posted the sharpest 2026 gain among tracked collections — up 22.73%, from roughly $9,269 to $11,376 — driven by demand for smaller, “everyday luxury” watches.
- Gold’s rise past $2,400/oz has directly lifted the investment case for Rolex’s precious-metal references (Day-Date, Sky-Dweller, Yacht-Master).
The Model-by-Model Picture
| Category | 2026 Trend |
|---|---|
| Lady-Datejust | +22.73% (strongest performer among tracked collections) |
| Steel sports models (Submariner, GMT-Master II) | Held value well; corrected from 2022 peak but stabilized above retail |
| Daytona | Corrected from highs above $50,000 to the mid-$30,000s; still among the most sought-after references |
| Two-tone/widely available Datejust | Flat to negative — “holds value” is an overstatement for this category |
| Gold references (Day-Date, Sky-Dweller) | Lifted by gold’s rise above $2,400/oz |
Why the “Rolex Always Appreciates” Myth Is Fading
The pandemic-era boom pushed some references — the Daytona above all — to speculative highs disconnected from historical norms. Since the March 2022 peak, steel sports models have compressed meaningfully, and dealers who bought inventory near the top have in some cases faced 20–40% markdowns on liquidation. The lesson for 2026 buyers: Rolex as a category is not a monolith. Value retention depends heavily on specific reference, condition, and whether the piece comes with box and papers (“full set”).
What’s Actually Driving 2026 Strength
- Retail price increases raise the floor. When a new Submariner retails at $10,050 (up from $9,500), a pre-owned example at $11,000–$12,000 suddenly represents a smaller premium — narrowing the gap without secondary prices actually moving.
- Supply discipline remains Rolex’s core lever. The brand has never confirmed production numbers, and secondary-market premiums remain entirely a function of Rolex’s own manufacturing decisions — a risk factor as much as a support.
- Certified Pre-Owned rollout. Rolex’s now fully rolled-out CPO program has changed how buyers transact in the used market, adding a layer of brand-verified legitimacy that supports pricing.
The Case for Rolex as a Portfolio Diversifier
Financial advisors increasingly frame luxury watches not as a replacement for equities or bonds, but as a tangible, historically low-correlation diversifier — one that carries its own risks (illiquidity, condition-dependent pricing, no yield) but has demonstrated multi-decade resilience for specific references.
Is Rolex a good investment in 2026?
It depends heavily on the specific reference. Steel sports models like the Submariner and Daytona have held or grown in value; two-tone and widely available dress models generally have not. Overall, Rolex’s secondary market rose about 7.9% year-over-year in 2026, trailing Patek Philippe but ahead of Audemars Piguet.
Discover more from The Economy
Subscribe to get the latest posts sent to your email.

Navigating Mortgage and Loan Refinancing in a High-Yield Environment
Global public debt crossing critical thresholds has kept central bank policies volatile, resulting in fluctuating US Treasury yields throughout 2026. For homeowners and commercial property holders burdened by previous high-interest borrowing cycles, finding optimal refinance windows has become a high-stakes financial puzzle. Stalled disinflation and stubborn employment numbers mean rate cuts are incremental, requiring borrowers to act with precision.
Timing your mortgage or commercial loan refinance in this environment requires a deep understanding of yield curve movements and lender risk appetites.
Decoding 2026 Refinance Dynamics
The 10-Year Treasury Yield Benchmark
Mortgage rates continue to track closely with the 10-year US Treasury yield. When macroeconomic anxiety spikes debt issuance, yields rise, tightening consumer borrowing capacity. Savvy borrowers monitor weekly Treasury auctions to lock in rates during brief dip windows.
Hybrid ARMs and Alternative Structures
With fixed rates remaining elevated, 7/1 and 10/1 adjustable-rate mortgages (ARMs) have surged in popularity. These products offer lower initial monthly payments, giving borrowers breathing room until central bank easing cycles fully materialize.
| Loan Product | Current Rate Range | Best For | Key Risk Factor |
| 30-Year Fixed Mortgage | 6.2% – 6.8% | Long-term predictability | Higher initial monthly outlay |
| 7/1 Hybrid ARM | 5.5% – 5.9% | Short-term ownership / flipping | Rate reset risk after year 7 |
| Commercial Refinance | 7.0% – 8.2% | Corporate asset restructuring | Strict DSCR lender covenants |
Actionable Steps for Successful Refinancing
To maximize your chances of securing favorable refinance terms in a volatile market, follow a disciplined preparation strategy.
Boost Your Credit Score Immediately: Lenders in 2026 are applying stringent credit tiering; a 20-point increase can drop your APR by a crucial quarter-point.
Shop Regional Credit Unions: Smaller financial institutions often offer portfolio loans with more flexible underwriting than major national banks.
Calculate the Break-Even Point: Ensure your total closing costs are recouped through monthly savings within 24 months of closing.
“Market Strategist View: Refinancing in 2026 is an exercise in opportunistic timing. Borrowers must maintain immaculate financial profiles ready to strike the moment Treasury yields dip.”
Mastering the complexities of today’s debt environment ensures you can successfully lower your debt service costs and protect your long-term financial stability.
Discover more from The Economy
Subscribe to get the latest posts sent to your email.

The days of pulling generic auto insurance quotes based purely on your zip code and age are officially over. In 2026, insurance comparison engines are powered entirely by generative AI and real-time telematics. These platforms digest thousands of live data points—ranging from your driving smoothness via connected vehicle sensors to real-time traffic congestion patterns—to generate hyper-personalized premiums instantly.
For consumers, this evolution represents both a massive opportunity for savings and a hidden trap for penalty pricing. Understanding how AI algorithms evaluate risk is essential for anyone looking to lower their monthly auto insurance premiums.
How AI Comparison Engines Evaluate Your Risk Profile
Behavioral Telematics and Connected Cars
Modern cars stream performance data directly to insurance aggregators. Generative AI models analyze braking sharpness, acceleration curves, cornering G-forces, and phone distraction metrics. Drivers who maintain smooth, defensive habits are rewarded with dynamic rate cuts of up to 40% compared to traditional rating tiers.
Predictive Traffic and Weather Modeling
AI tools now cross-reference your daily commute route with predictive weather and accident probability models. If your standard parking location or driving corridor has a statistically higher incidence of uninsured motorist claims, your quotes will reflect that hyper-local risk assessment.
| Comparison Factor | Traditional Rating Model | 2026 Generative AI Model | Impact on Premium |
| Mileage & Usage | Annual estimated odometer reading | GPS tracking & live trip duration | High (up to 35% savings) |
| Driving Behavior | MVR driving record & accidents | Real-time braking, speed, & G-force | Critical (determines tier) |
| Vehicle Tech | Make, model, and safety rating | ADAS calibration & repair cost data | Moderate |
Strategies to Lower Your AI-Driven Insurance Quote
To outsmart the algorithm and secure the lowest possible premium in 2026, drivers must proactively manage their digital footprint on insurance platforms.
Opt-In for Telematics Trial Periods: Many insurers offer immediate 15% discounts just for installing their driving app; let it track safe habits for 30 days to lock in permanent savings.
Scrub Unverified Public Records: Ensure your motor vehicle report is free of clerical errors that AI risk models misinterpret as reckless behavior.
Compare AI Aggregators: Use platforms that integrate multi-carrier API feeds rather than single-brand comparison sites to find the best risk-adjusted rate.
“Industry Note: AI-driven pricing rewards transparency and precision. Drivers who actively manage their telematics data consistently out-save those relying on legacy quote calculators.”
Embracing AI comparison tools allows savvy policyholders to customize coverage limits precisely to their driving habits, eliminating wasted premium spend while ensuring robust protection.
Discover more from The Economy
Subscribe to get the latest posts sent to your email.

Q3 2026 Earnings Preview: Can Record Profit Expectations Keep Wall Street’s Rally Alive?

Russia Diesel Deal 2026: Oil Prices and Inflation Risks

Fed Rates 2026: Treasury Yields, Bonds and SGOV Explained

S&P 500 Market Breadth 2026: Weak Rally or Rotation?

The AI Capex Boom: Data Centers Reshaping Growth

Palantir Stock in 2026: Extraordinary AI Growth

Tesla Physical AI 2026: Robotaxis, Optimus and TSLA Risks

NVIDIA’s AI Grip in 2026: Record Revenue Is Only Half the Investment Story

Hormuz Diesel Shortage: Why Crude Oil Recovery Isn’t Enough

Social Security Extra $90 Deposit: Who Qualifies for the October 2026 Medicare Rebate?

Anthropic Bans Sustained Abuse of Claude AI Under New Usage Policy Effective November 12, 2026

Jeff Bezos Three-Day Workweek View: What He Really Said

Celeste Frozen Pizza Discontinued: What Conagra Confirmed

US–China Critical Minerals Competition: Why a Trade Deal Cannot Fix Every Supply Risk

Oil Prices Break $100 in 2026: Middle East Conflict & Energy Markets

Middle East War Economics 2026: Oil Prices & Energy Markets

PSX Forecast 2026: KSE-100, IMF Reviews & Geopolitics

China Stocks Today: Are Big Economies in Asia Nearing a Market Bottom?

Crypto Daily Outlook: Bitcoin, Altcoins, and the Future of Decentralized Finance

Global Pension Systems Ranked: The World’s Best and Worst Retirement Frameworks

World’s Largest Economies: Ranking the Top Global Powers

Elon Musk’s Next Moves: Disrupting the 2026 Global Economy

Pakistan Economy 2026: Inside the SBP’s Balancing Act

GasBuddy Market Insights: How Crude Price Shifts Impact Local Fuel Cost Averages

World Bank & IMF Reports 2026: Why the “3% Growth” Consensus Is Actually a Debate

Global Equity Market Divergence: US Tech vs. European Dividend Stocks vs. Asian Growth

IMF & World Bank Global Economic Outlook: Growth Forecasts Across Europe and Asia

Silver Price Today: Why the Xi-Trump AI Standoff Is Fueling a Safe-Haven Rally
-

 Markets & Finance9 months ago
Top 15 Stocks for Investment in 2026 in PSX: Your Complete Guide to Pakistan’s Best Investment Opportunities
-

 Analysis8 months ago
Johor’s Investment Boom: The Hidden Costs Behind Malaysia’s Most Ambitious Economic Surge
-

 Analysis8 months ago
Top 10 Stocks for Investment in PSX for Quick Returns in 2026
-

 Banks9 months ago
Best Investments in Pakistan 2026: Top 10 Low-Price Shares and Long-Term Picks for the PSX
-

 Analysis8 months ago
Brazil’s Rare Earth Race: US, EU, and China Compete for Critical Minerals as Tensions Rise
-

 Investment9 months ago
Top 10 Mutual Fund Managers in Pakistan for Investment in 2026: A Comprehensive Guide for Optimal Returns
-

 Global Economy10 months ago
15 Most Lucrative Sectors for Investment in Pakistan: A 2025 Data-Driven Analysis
-

 Global Economy10 months ago
Pakistan’s Export Goldmine: 10 Game-Changing Markets Where Pakistani Businesses Are Winning Big in 2025