
Analysis
Turkish Airlines Targets the Global Hub Crown After Gulf Rivals Stumble

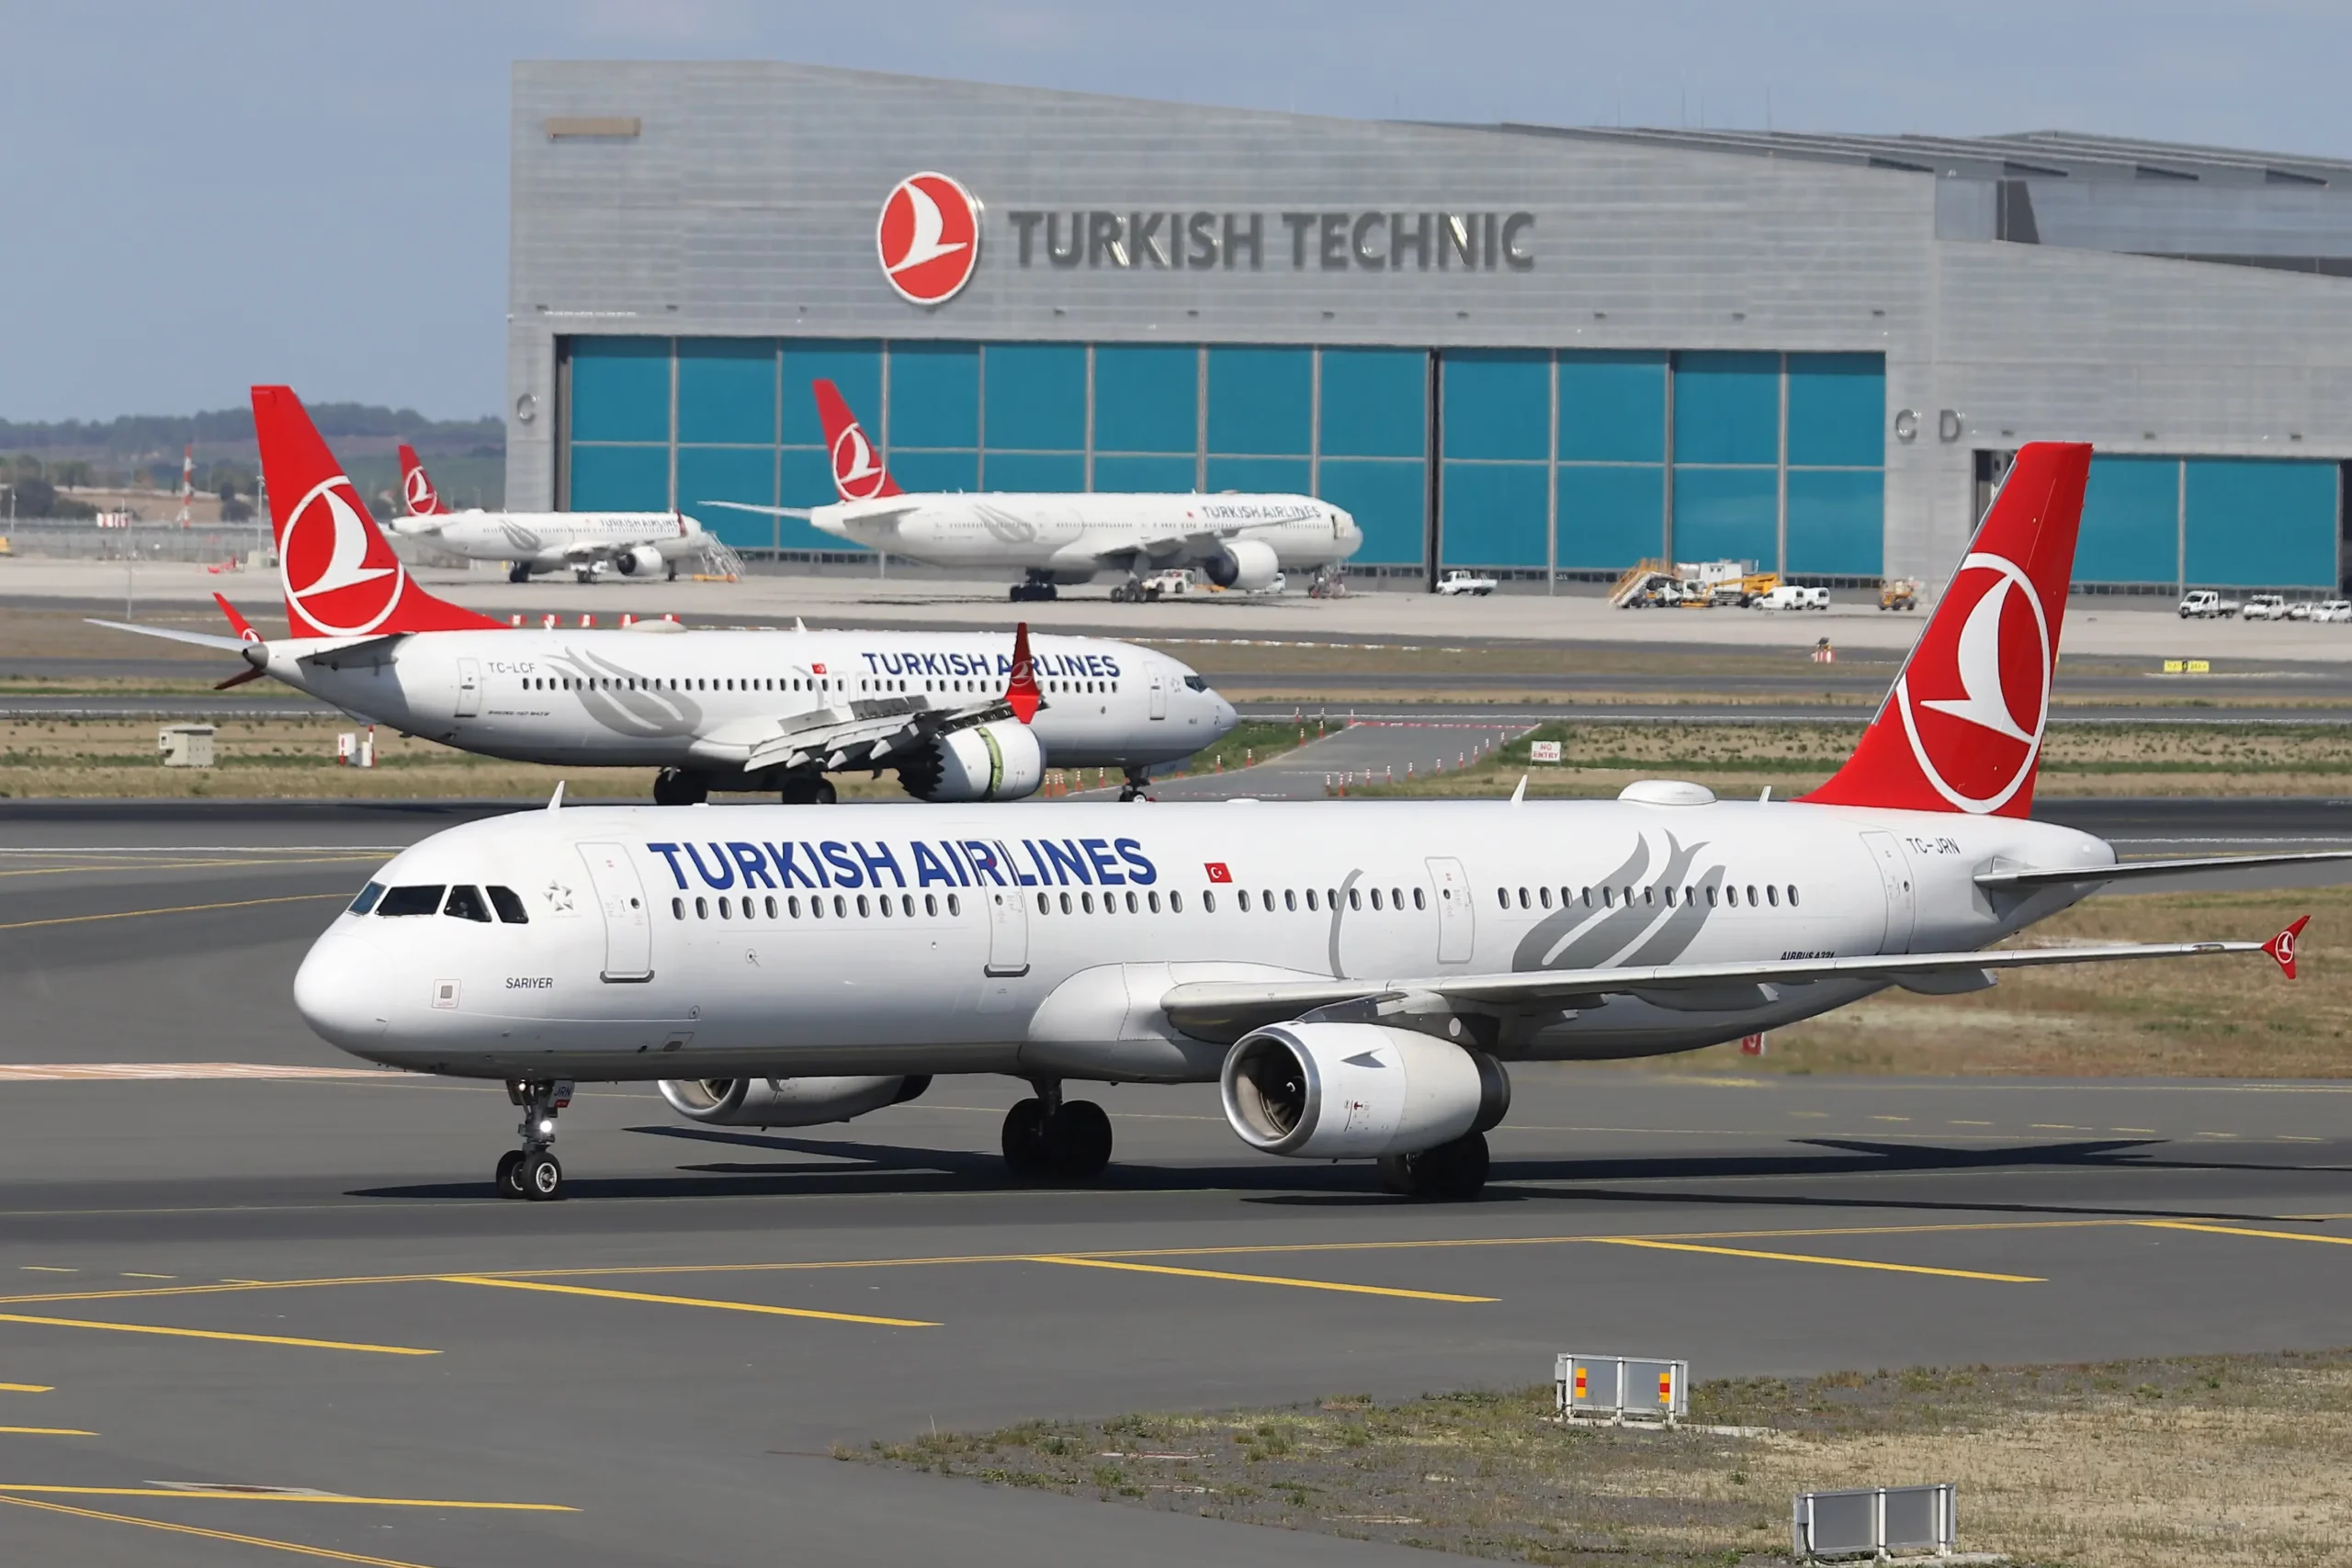
When Qatar’s airspace slammed shut on 28 February 2026, the global aviation order shifted overnight — and Istanbul was ready.
The U.S.-Israeli strikes on Iran that Saturday triggered simultaneous airspace closures across eight countries: Iran, Israel, Iraq, Qatar, Bahrain, Kuwait, the UAE, and parts of Syria. About 24 percent of all flights to the Middle East were cancelled on the opening day of the conflict, with carriers halting roughly half their services to Qatar and Israel, according to aviation monitor Cirium. The Gulf super-connectors — Emirates, Qatar Airways, Etihad — were grounded or severely curtailed. For Turkish Airlines, the crisis arrived not as a disruption but as an opportunity decades in the making. Al Jazeera
The carrier had already been growing faster than almost any network airline on earth. What the Iran conflict did was accelerate a structural shift that Turkish Airlines’ own executives had been engineering through billions of dollars of infrastructure investment and an audacious long-term fleet programme. The question now is whether Istanbul can convert a geopolitical windfall into something more permanent — a position at the very top of global aviation that was, until recently, thought to belong irrevocably to Dubai or Doha.
How Turkish Airlines Capitalised on Gulf Disruption in 2026
The numbers are stark. Turkish Airlines carried 21.3 million passengers in the first quarter of 2026, up 13 percent from 18.9 million in the same period a year earlier. In March alone, passenger numbers rose 16 percent annually to 7.2 million, while the passenger load factor — the share of seats occupied by paying travellers — climbed to nearly 84 percent. Those figures came despite the airline itself suspending routes into several conflict-affected destinations through March. AGBI
The mechanism is straightforward. Qatar Airways suspended Doha operations on 28 February when Qatari airspace closed amid escalating Iran-related regional tensions. Emirates reduced Dubai frequencies due to airspace constraints. Routes that had for years flowed through the Gulf — London to Bangkok, New York to Singapore, Frankfurt to Mumbai — required immediate rerouting. Istanbul, sitting at the intersection of Europe, Asia, and Africa, was the only major hub capable of absorbing the volume without significant operational restructuring. Air Traveler Club
Turkish Airlines responded with speed. The carrier increased frequencies on Europe-Asia corridors and pushed capacity onto transatlantic segments it already served. Istanbul Airport had handled a 15–20 percent traffic surge during the 2022 Russia-Ukraine airspace closures, a pattern now repeating at larger scale. The institutional muscle memory was there. Air Traveler Club
Yet this was not simply opportunism. Turkish Airlines entered 2026 with a fleet of 528 aircraft, a 12 percent year-on-year increase, serving 358 destinations. It had spent the previous year building the load-factor foundation — annual load factor reached 83.2 percent in 2025, with available seat kilometres growing 7.5 percent to 273.2 billion as the full-year passenger count hit a record 92.6 million, up 8.8 percent over 2024. A carrier running those numbers doesn’t stumble when a crisis redistributes demand. It absorbs it. AGBITS2
Chairman Ahmet Bolat had already signalled the ambition. Announcing more than 100 billion Turkish lira — roughly $2.32 billion at current exchange rates — in infrastructure commitments at Istanbul Airport earlier this year, he said the investments were designed to ensure that “fleet growth is matched by sufficient infrastructure and skilled personnel.” That wasn’t a response to the Iran conflict. The projects were announced in January 2026, six weeks before the first strike.
Why Istanbul Is the Hub the Gulf Crisis Revealed
How does Turkish Airlines compete with Emirates and Qatar Airways? The honest answer is: differently.
Emirates built its dominance on the sheer scale of Dubai International, a single mega-hub optimised for long-haul transfers, and a widebody fleet — primarily the A380 and 777 — configured for premium-cabin revenue on trunk routes. Qatar Airways pursued a similar model via Hamad International in Doha, consistently winning Skytrax awards and maintaining the highest hub transfer percentage among Gulf carriers at 84 percent. Both strategies depend on stable, open Gulf airspace.
Turkish Airlines’ model is structurally distinct. The airline operates in more countries than any other carrier and ranks twelfth globally by capacity, but climbs to ninth when measured by available seat kilometres — a reflection of longer-than-average sector lengths that define a true intercontinental network. Its domestic Turkish operations, the AJet low-cost subsidiary, and the long-haul international network together create a three-layered system that insulates the carrier from single-market shocks. When Gulf traffic collapsed, Turkish Airlines could redirect fleet and crew because those resources were already distributed across a far wider operational canvas. OAG
Istanbul’s geography does the rest. The city sits roughly equidistant between London and Delhi, between Nairobi and Tokyo. Unlike Dubai or Doha, whose geographic advantage over Europe-Asia routes depends on overflight rights through Iranian and Iraqi airspace, Istanbul sits to the north of that corridor — meaning it was never dependent on Persian Gulf overflights in the first place. Istanbul is now the only major hub capable of connecting South, East, and West without major detours during periods of Gulf airspace constraint. Etu Bonews
That structural reality is also the answer to the featured snippet question: Istanbul is becoming a dominant aviation hub because it combines geographic neutrality — sitting north of conflict-sensitive Middle Eastern airspace — with Turkish Airlines’ dense network of 358 destinations across 132 countries, a growing fleet exceeding 528 aircraft, and an airport infrastructure capable of absorbing diverted intercontinental demand at scale.
The $2.32 Billion Infrastructure Bet and the 2033 Vision
The traffic surge of early 2026 is the near-term story. The more consequential one is structural — a decade-long transformation that Turkish Airlines is funding whether or not the Iran conflict ever fully resolves.
The airline’s 10-year strategic roadmap calls for expanding its fleet to more than 800 aircraft by 2033, growing annual passenger numbers to around 170 million, and roughly doubling its economic contribution to Türkiye’s economy from approximately $65 billion today to $144 billion by the end of the period. CEO Bilal Ekşi has publicly stated the ambition is to rank among the world’s top five airlines by that centenary year. The Traveler
The infrastructure investments underpinning those projections are now underway. Additional aircraft maintenance hangars due to be completed in 2026 will increase Turkish Technic’s simultaneous heavy maintenance capacity by around 20 percent, enabling work on up to 12 aircraft at a time. A new main catering facility expected to enter service during 2027–2028 is designed to handle meals for more than 500,000 passengers per day. A dedicated e-commerce complex supporting Turkish Cargo’s Widect door-to-door freight platform is set for 2026 completion. Europe’s largest widebody aircraft engine maintenance facility is also under construction. Aerospace Global News
These infrastructure projects are expected to create 26,000 new jobs in 2026 and more than 36,000 jobs once all phases are complete. Travel And Tour World
The network recalibration is proceeding in parallel. In the second half of 2026, Turkish Airlines is upgrading its São Paulo-Santiago-Istanbul service to daily A350-900 operations, expanding Lisbon frequencies to 21 times weekly, and growing Sydney service to six weekly rotations via Kuala Lumpur. These are not emergency diversions. They are long-planned moves by a carrier that has been building South American and Asia-Pacific density for years, and which now operates the routes on aircraft purpose-built for ultra-long-haul efficiency.
International-to-international passenger traffic — the critical transfer metric — climbed 12.8 percent in 2025 to 35.7 million, highlighting the airline’s role as a transfer gateway for long-haul and regional journeys. That number, not the raw passenger total, is the clearest signal that Istanbul’s hub function is deepening. FTN News
The Complications the Headlines Omit
Still, the picture is more complicated than a simple narrative of Turkish Airlines ascending while Gulf rivals recede.
Turkish Airlines only hedges around 40 to 50 percent of its fuel, well below the 70 to 85 percent that top European carriers lock in — meaning the revenue from extra passengers could end up being partially absorbed by higher fuel bills driven by the very conflict redirecting demand to Istanbul. The Royal Aeronautical Society has noted that for the remainder of 2026, the industry can anticipate increased financial stress particularly among weaker carriers from high fuel prices, broader regional airspace closures, and potential airline industry-wide deterioration. Turkish Airlines is not a weak carrier. But its fuel hedging gap is a genuine vulnerability that competitors with deeper treasury operations can exploit. RTÉRoyal Aeronautical Society
There is also the question of permanence. Emirates and Qatar Airways are not structurally impaired. Emirates posted a $6.2 billion profit before tax in 2026 despite the disruptions, cementing its position as the world’s most profitable airline. Qatar Airways, operating at reduced capacity through Doha, still posted $1.7 billion in profit. These carriers have the balance sheets to rebuild quickly once Gulf airspace normalises, and their premium-cabin product — Emirates’ retrofitted suites, Qatar’s forthcoming QSuite Next Gen — targets a segment where Turkish Airlines has historically competed at a discount. Travel And Tour World
Aviation analysts also point to a structural ceiling. Turkish Airlines benefits enormously from its hub model, but Istanbul Airport operates under slot and infrastructure constraints that limit theoretical throughput. Unlike Dubai International or Hamad International — both purpose-engineered for transfer-optimised mega-hub operations — Istanbul Airport was built as a replacement for an older facility and is still maturing its gate capacity and ground-handling systems. The airline has trimmed 18 international destinations from its summer 2026 schedule precisely to concentrate resources and manage hub complexity during a period of extraordinary demand.
The geopolitical angle cuts in multiple directions too. The same Iran conflict that diverted Gulf traffic to Istanbul also forced Turkish Airlines to suspend its own routes into Iran, Iraq, Syria, Lebanon, and Jordan through March. Türkiye’s diplomatic positioning — non-aligned on the conflict, but maintaining operational ties with both Western and regional partners — gives it unusual flexibility. It does not, however, guarantee immunity from escalation.
What the Race for the Hub Crown Really Means
Turkish Airlines has not beaten Emirates, Qatar Airways, or Lufthansa. Not yet, and perhaps not on every metric that matters to investors. What it has done is demonstrate that the Istanbul model — geographically diversified, domestically anchored, relentlessly expanding its intercontinental transfer share — is resilient in exactly the conditions that expose the fragility of pure Gulf-hub dependency.
The 2026 crisis is, in a sense, the first real stress test of a competition that aviation analysts have been anticipating for a decade. Turkish Airlines passed it by growing 13 percent quarter-on-year during one of the most disruptive periods in regional aviation history. Its rivals, constrained by closed airspace and curtailed operations, mostly watched.
Turkish Airlines’ investment programme to transform Istanbul Airport into a world-leading aviation hub is projected to contribute over $144 billion to the Turkish economy by 2033. That ambition preceded the Iran crisis. The crisis may simply have given the airline its clearest argument yet that Istanbul belongs in the same sentence as Dubai and Doha — not as an understudy, but as an equal. Travel And Tour World
The race for the hub crown was never purely about passenger numbers or Skytrax stars. It’s about which city owns the world’s connecting traffic when the geopolitical ground shifts. Right now, the answer — increasingly, undeniably — is Istanbul.
Discover more from The Economy
Subscribe to get the latest posts sent to your email.


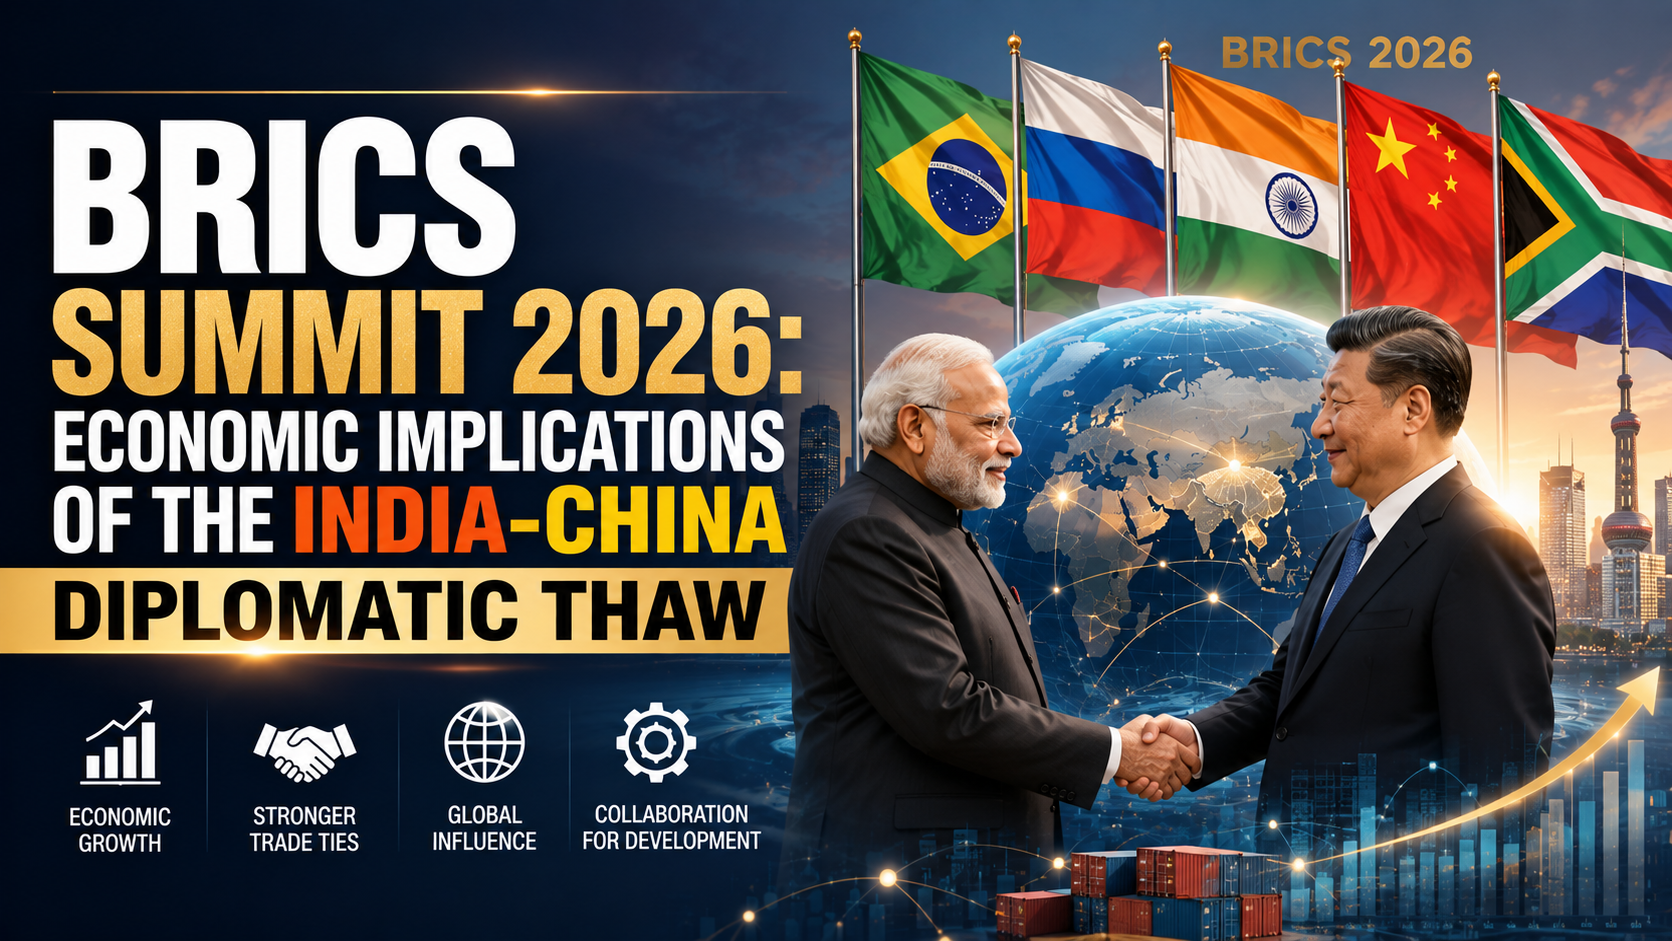
Chinese President Xi Jinping is expected to travel to New Delhi on September 12–13, 2026, for the 18th BRICS Summit — his first visit to India in six years, and the clearest signal yet that Beijing and New Delhi are prepared to move past the 2020 Galwan Valley border clash, according to Indian Defence News. For enterprise strategists and investors positioned across South Asian and Chinese supply chains, this is not a symbolic handshake — it is a signal event with direct implications for trade flows, tariff exposure, and capital competition across the Global South.
From Galwan to Kazan to New Delhi: The Timeline
The normalization process has moved in deliberate stages, not a single reset:
- October 2024 — Kazan, Russia: Modi and Xi meet on the sidelines of the BRICS summit, the first formal meeting since 2019, following a border disengagement agreement, according to The Diplomat.
- 2025 — Resumption of high-level visits: India’s defense and external affairs ministers visited Beijing; China’s Foreign Minister Wang Yi visited New Delhi, producing several bilateral agreements, per The Diplomat.
- August 2025 — Tianjin SCO Summit: Modi and Xi met again, described as the culmination of the resumed high-level engagement.
- May 2025 — India-Pakistan conflict stress test: The thaw survived Beijing providing military and political support to Islamabad against India during a brief conflict — evidence the normalization is now resilient to shocks, per The Diplomat.
- September 12–13, 2026 — New Delhi BRICS Summit: India chairs BRICS for a fourth time, hosting Xi for the first time since 2019, per Indian Defence News.
Why Now: The Strategic Logic on Both Sides
For Beijing, sustaining a frozen conflict with a rising economic power while simultaneously managing friction with Washington over the South China Sea and Taiwan Strait has become strategically costly, per Indian Defence News. For New Delhi, hosting Xi under the multilateral BRICS umbrella allows Modi to project global statesmanship while engaging Beijing without appearing to unilaterally concede on unresolved border issues.
Crucially, analysts at the China-Global South Project note the 2026 dynamic is being shaped primarily by regional realities and a deliberate decoupling of economic cooperation from security disputes — not by U.S. trade pressure, even though Trump-era tariff policy has often been cited as a contributing factor.
Where the Economic Exposure Sits
Import Dependency: India’s Structural Vulnerability
India’s supply chains remain heavily dependent on Chinese intermediate goods, particularly in pharmaceuticals and electronics, according to Indian Defence News. Any further normalization of technology-investment restrictions — India banned a range of Chinese tech applications and tightened border-nation investment rules after Galwan — would be the single highest-impact policy shift for enterprise B2B supply chain planners in the region.
The BRICS Bloc Itself: Expanded and More Consequential
The 2026 summit occurs against a materially expanded BRICS bloc. Since the original five-member group, Egypt, Ethiopia, Iran, Saudi Arabia, and the UAE joined in 2024, and Indonesia joined in 2025, per the official BRICS 2026 site — with ten additional partner countries (Belarus, Bolivia, Cuba, Kazakhstan, Malaysia, Nigeria, Thailand, Uganda, Uzbekistan, Vietnam) joining in 2025. The bloc’s prior Rio summit produced a Leaders’ Framework Declaration proposing to mobilize $300 billion annually by 2035 for climate finance, according to Business Standard.
Trade & Investment Exposure Matrix
| Sector | Pre-Thaw Position (2020–2024) | Post-Thaw Trajectory (2025–2026) | Enterprise Risk/Opportunity |
|---|---|---|---|
| Pharmaceuticals (API imports) | Heavy Indian dependency on Chinese active pharmaceutical ingredients | Potential easing of investment friction | Opportunity: supply diversification talks; Risk: continued single-source dependency |
| Electronics/consumer tech | Chinese app bans, investment screening for border-sharing nations | Selective, cautious relaxation possible | Watch for FDI rule changes ahead of/after the summit |
| Border trade | Suspended since 2020 | Partial resumption of trade at three border outposts | Direct logistics opportunity for regional trade B2B services |
| Africa infrastructure/capital | Parallel, competing Chinese BRI and Indian maritime/digital investment | Continued competition, not cooperation | Africa remains contested capital-deployment theatre, per Indian Defence News |
| AI governance | No joint framework | BRICS Leaders’ Statement on Global AI Governance (Rio) | Multilateral framework emphasizing Global South inclusion, UN-led process |
Sources: Indian Defence News, The Diplomat, Business Standard — see citations above.
What to Watch at the September Summit
- Border trade mechanics: Whether the Working Mechanism for Consultation and Coordination produces concrete friction-point resolutions in eastern Ladakh ahead of the summit, per Indian Defence News.
- Investment-screening rule changes: Any signal India will ease its border-nation FDI restrictions would be the most direct enterprise-relevant outcome.
- Africa positioning: Whether joint statements address, rather than paper over, competing Chinese BRI and Indian maritime-security/digital-investment strategies across the continent.
- AI governance follow-through: Concrete mechanisms building on the Rio AI governance statement, relevant to any enterprise operating AI infrastructure across BRICS-aligned markets.
The Caveat: This Is a Thaw, Not a Resolution
Independent policy analysis from the ISAS Brief is explicit that the Kazan-era thaw has not resolved bilateral mistrust or delivered progress on sensitive issues — it has stabilized the border and eased some economic restrictions without addressing the underlying territorial dispute. The China-Global South Project similarly notes India continues to treat Beijing with caution in the security domain even as it normalizes economic engagement. Investors should read the September summit as confirmation of a durable, deliberate de-escalation track — not as a signal that structural India-China rivalry has been resolved.
The Bottom Line
The India-China thaw formalized at the New Delhi BRICS Summit represents a genuine, multi-year, deliberately sequenced de-politicization of economic relations between two of the world’s largest economies — but one that leaves core security and territorial disputes unresolved. For enterprise and investment strategists, the actionable signal is narrower than “US-China rapprochement” headlines suggest: watch FDI screening rules, pharmaceutical/electronics supply-chain diversification announcements, and border-trade resumption specifics, not broad geopolitical sentiment.
Discover more from The Economy
Subscribe to get the latest posts sent to your email.
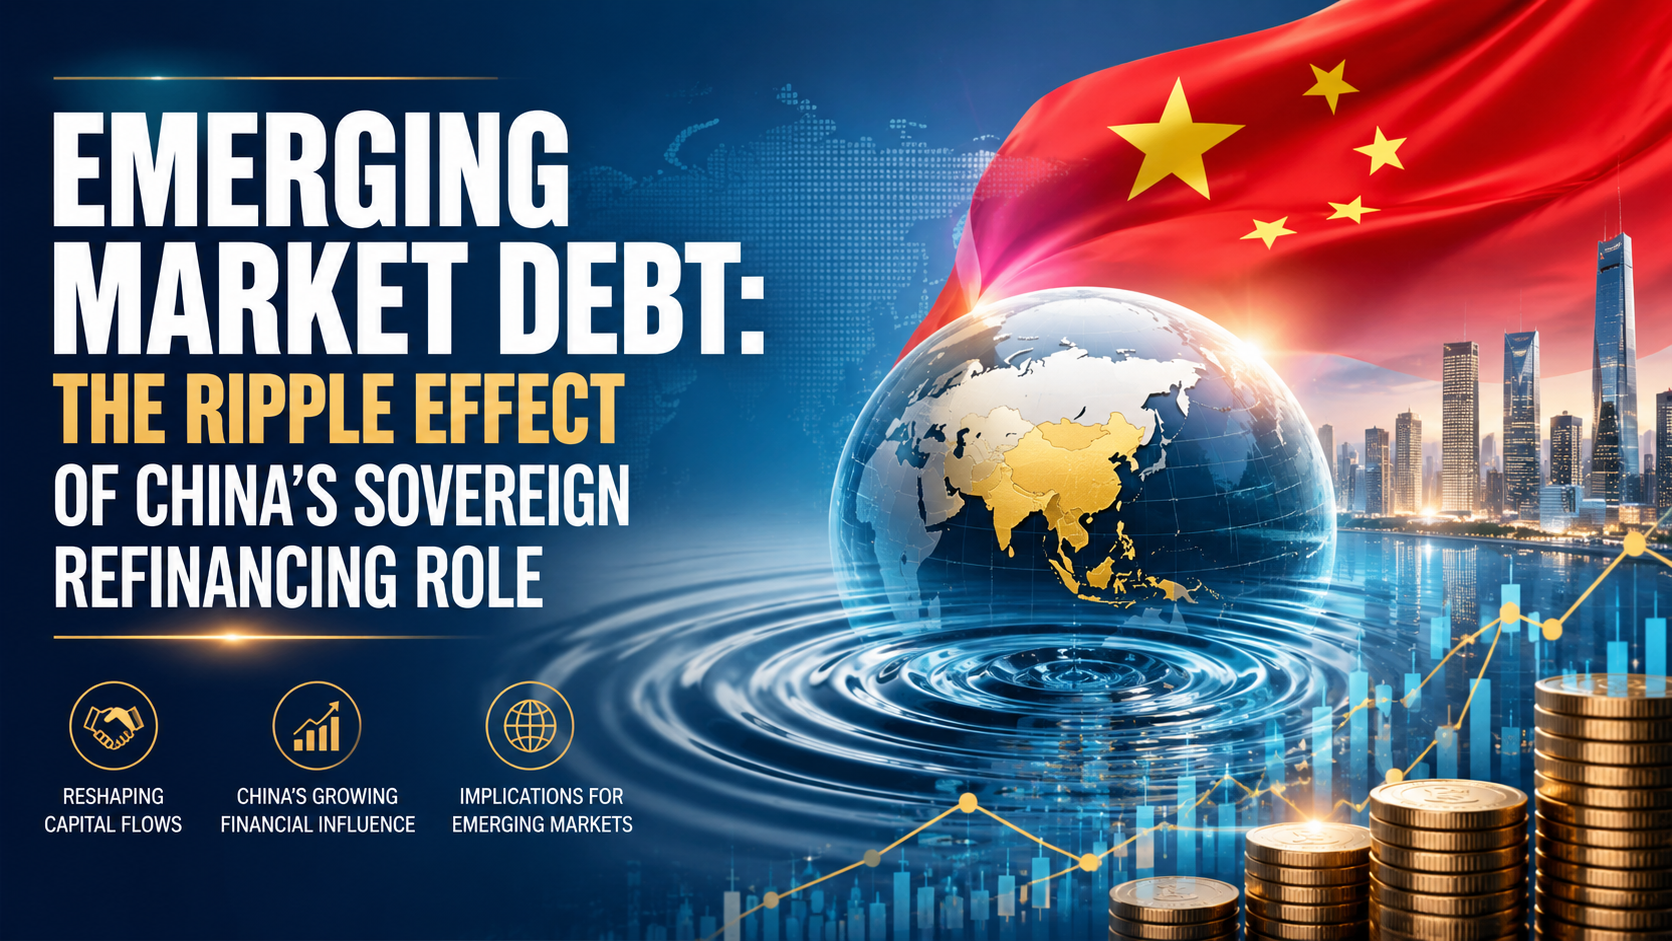
Emerging and developing economies face refinancing needs of more than $9 trillion in 2026, according to the Institute of International Finance’s Global Debt Monitor — the largest wall of maturing sovereign and corporate debt these markets have ever faced simultaneously. At the center of that system sits China, now the single largest issuer of emerging-market sovereign debt and, increasingly, the largest bilateral lender of last resort when smaller economies can’t refinance on their own. For institutional investors and foreign-policy-adjacent business strategists, understanding China’s dual role — dominant issuer and dominant creditor — is now a prerequisite for pricing emerging-market risk correctly.
Editorial note on sourcing: a specific figure describing a discrete “$1.3 billion” China sovereign refinancing transaction could not be independently verified against primary reporting at the time of writing. This article instead builds its analysis on verified, dated figures from the OECD, IIF, Moody’s, and peer-reviewed research, and any deal-level claim should be confirmed against primary sources (finance ministry statements, rating-agency releases) before publication or citation.
China’s Dual Role: Issuer and Creditor of Last Resort
China accounted for 45% of total EMDE sovereign bond issuance in 2024, up sharply from just 17% in the 2007–2014 period, according to the OECD’s Global Debt Report 2025. By 2025, China remained the top borrower among a concentrated group — China, India, Brazil, Egypt, and Argentina together represented 78% of EMDE central-government borrowing, per the OECD’s Global Debt Report 2026.
Domestically, Beijing has simultaneously executed one of the largest local-government debt refinancing programs in history: a 6 trillion yuan (roughly $839 billion) swap of “hidden” local-government debt into standardized bonds, approved in late 2024 and implemented through 2026, according to VOA News. By mid-2026, Chinese provinces had used nearly 94% of that swap allowance, according to Bloomberg.
Internationally, China has also re-entered dollar sovereign bond markets at scale — its 2026 international offering was reported as its largest ever, oversubscribed well beyond target, according to Business Standard/Reuters reporting on the prior comparable issuance. This dual positioning — massive domestic refinancing plus expanding international issuance — gives China outsized influence over EM bond-market liquidity and pricing benchmarks that smaller sovereigns then reference for their own issuance.
The $9 Trillion Wall: Why 2026 Is Different
The scale of what’s coming due matters more than any single deal. Key figures from the IIF’s Global Debt Monitor and OECD’s 2026 report:
- Gross EMDE central-government borrowing crossed $4 trillion in 2025, up from roughly $3 trillion in 2024.
- Around 36% of outstanding EMDE bond stock matures within three years.
- Low-income countries face the sharpest cliff: 52% of their outstanding bonds mature by 2028, with 29% due by the end of 2026 alone.
- Secondary-market yields on maturing debt now exceed 10% for non-investment-grade sovereigns, meaning refinancing at current rates locks in materially higher debt-service costs than the original issuance.
Refinancing Cost Comparison: Then vs. Now
| Issuer Tier | Original Issuance Yield (illustrative range) | 2026 Refinancing Yield | Refinancing Risk |
|---|---|---|---|
| Investment-grade EMDEs (e.g., select Gulf, Southeast Asia sovereigns) | 3–5% | 5–7% | Moderate — absorbable within fiscal space |
| Non-investment-grade EMDEs | 6–8% | 10%+ | High — debt-service costs rising faster than revenue growth |
| Low-income issuers (heavy China bilateral exposure) | Concessional/below-market | Market-rate or restructured terms | Severe — 29% of debt stock matures by end of 2026 |
Source: OECD Global Debt Report 2025/2026 (see citations above); ranges are illustrative of documented tier-level trends, not specific bond issues.
The Restructuring Precedent: What Happens When Refinancing Fails
China’s response to sovereign distress has evolved into a distinct pattern that investors increasingly price into risk premiums. Research published via the National Bureau of Economic Research documents a rising trend of “re-structurings” — repeated restructurings of the same debt with the same creditor — echoing the drawn-out resolution patterns of prior global debt crises. Angola, Ecuador, Seychelles, Sri Lanka, and Venezuela have each undergone two or more restructurings with Chinese state creditors.
Sri Lanka’s case is illustrative of the mechanics: China Development Bank extended a $500 million financing facility in 2020, and a subsequent equity-linked arrangement brought in $1.12 billion in cash that Colombo used to repay non-Chinese creditors, according to Oxford Academic’s International Affairs journal. These bilateral bridge arrangements illustrate how China’s rescue lending functions as a parallel track to traditional Paris Club-style restructuring — often faster to arrange, but less transparent to third-party bondholders pricing the same sovereign’s risk.
Regional Ripple Effects: Where Investors Should Watch Closely
Direct Exposure Zones
- Sub-Saharan Africa: Heaviest concentration of low-income issuers facing near-term maturity walls and prior China restructuring history (Angola, Zambia).
- South Asia: Sri Lanka’s precedent shapes how markets price Pakistan and Bangladesh refinancing risk.
- Latin America: Ecuador and Venezuela carry documented repeat-restructuring histories; Argentina remains among the top-five EMDE borrowers by volume.
Indirect / Second-Order Exposure
- Gulf and Southeast Asian investment-grade sovereigns face rising benchmark yields even without direct restructuring risk, simply because China’s issuance volume moves the EM bond-pricing benchmark broadly.
- Enterprise B2B lenders and trade-finance providers operating in these corridors should treat sovereign-refinancing stress as a leading indicator of counterparty and currency risk, not a lagging one.
An Investor Risk-Monitoring Framework
- Track maturity-wall concentration, not headline debt-to-GDP. A country with moderate debt-to-GDP but a heavy 2026–2028 maturity cliff carries more near-term risk than a higher-leverage country with a smoothed maturity profile.
- Distinguish China’s domestic refinancing (yuan-denominated, largely contained) from its role as an external EM creditor (dollar/foreign-currency exposure, higher spillover risk).
- Watch for repeat-restructuring signals. Countries with a prior China restructuring are statistically more likely to require another, per the NBER research above — treat this as a standing risk flag, not a one-time resolved event.
- Monitor secondary-market yield spreads on maturing debt versus issuance-year yields as the clearest real-time signal of refinancing stress building in a specific sovereign.
The Bottom Line
China’s simultaneous role as the largest domestic debt-refinancer in EM history and the most influential external creditor to distressed sovereigns makes it the single most important variable in the 2026 emerging-market debt outlook. The $9 trillion refinancing wall isn’t a uniform risk — it’s concentrated in low-income issuers with the heaviest prior China bilateral exposure, and that concentration is exactly where enterprise investors, trade-finance providers, and sovereign-risk analysts should be focusing due diligence through the remainder of 2026.
Discover more from The Economy
Subscribe to get the latest posts sent to your email.

Key Takeaways
- Major US banks generated $47 billion in profits in early 2026 while cutting roughly 15,000 positions tied to AI-driven restructuring — a genuine profit-and-disruption paradox playing out simultaneously.
- Academic research finds AI-adopting banks experience measurably lower default risk, credit risk, and systematic risk versus non-adopters — a causal, not merely correlational, risk-reduction effect.
- Generative AI could contribute $200-340 billion annually to global bank profits through productivity gains and automation, with Morgan Stanley citing a $740 billion 2026 AI capex wave as a direct tailwind for bank financing revenue.
- AI incidents carry a measurable market cost: a study of five US banks found an average short-term cumulative abnormal stock return loss of -21% following AI incidents, with negative spillover to the broader financial sector.
- Real-time credit exposure monitoring is emerging as AI’s most consequential risk-management application — recalculating counterparty exposure continuously as transactions execute, rather than discovering limit breaches the next morning.
A Genuine Paradox: Record Profits, Real Disruption
The defining tension in banking’s 2026 AI story is that efficiency gains and workforce disruption are happening at the same institutions, in the same reporting period, without contradiction. The 21,490 AI-related layoffs recorded in April 2026 and the $47 billion in profits generated by major banks while cutting 15,000 positions represent just the opening chapter of a restructuring that will reshape the industry over the coming decade — a transformation creating both risks and opportunities for investors simultaneously. JPMorgan Chase has emerged as the clearest example of how major financial institutions are restructuring entire organisations around AI capabilities rather than simply layering AI tools onto existing operations.
That reskilling gap is real and measurable at the industry level. The World Economic Forum reports that 77% of employers plan to reskill workers in response to AI disruption, yet only 57% report having created genuine reskilling pathways in practice — a gap between stated intention and operational execution that creates both human and financial-stability risk.
The Evidence: AI Adoption Causally Reduces Bank Risk
Beyond the headline profit and disruption figures sits a more academically rigorous finding that deserves more attention than it typically receives: AI adoption appears to make banks genuinely safer, not just more efficient. Research strongly supports this: AI-adopting banks experience lower default risk, measured by lower probability of default; lower credit risk, with smaller non-performing loan ratios and loan-loss provisions; and lower systematic risk, indicating that AI-adopting banks’ equity values are less exposed to economy-wide shocks and cyclical downturns. These effects remain robust after controlling for bank size, profitability, leverage, governance, and ESG performance, with consistent evidence that AI adoption causally reduces risk rather than simply reflecting already-safer institutions.
Two mechanisms explain this effect: enhanced risk management, where AI enables real-time credit monitoring, early detection of loan deterioration, and automated compliance screening, improving portfolio quality and lowering default probabilities. This is the strongest empirical grounding available for the “AI as risk-management upgrade” thesis, as distinct from the more commonly cited “AI as cost-cutting tool” narrative.
Real-Time Risk: The Practical Application
The operational shift this enables is significant. AI enables risk assessment at the speed of the business: as transactions execute, credit exposure to counterparties is recalculated continuously, and limit breaches are detected in real time rather than discovered the next morning. For risk managers, that shift from batch-processed, next-day exposure reporting to continuous real-time monitoring represents a genuine structural upgrade in how counterparty risk is managed — not merely a faster version of the same process.
The Capital and Profit Case
The scale of capital flowing into this transition is substantial, and banks sit at the centre of financing it. With an expected $740 billion in AI capex in 2026, banks stand to benefit from rising financing demand, resilient M&A activity, and long-term efficiency gains — AI is poised to be a net positive for banks, with disruption risks considered manageable even as investors worry about job losses and macro impacts. AI is driving major efficiency gains for banks, potentially boosting productivity by 20% to 50% over the next five to ten years.
The productivity dividend estimate at the global level is similarly large: generative AI could contribute between $200 billion and $340 billion a year to global bank profits through productivity advances and automation, with banks introducing knowledge agents powered by large language models in 2026 that can extract rich insights from loan applications, financial statements, and customer communications at scale.
Comparative Table: AI’s Dual Effect on Bank Risk Profile
| Dimension | Risk-Reducing Effect | Risk-Increasing Effect |
|---|---|---|
| Credit risk | Lower non-performing loan ratios, better early detection | New model/hallucination risk in credit decisioning |
| Operational risk | Real-time exposure monitoring, automated compliance | Cascading agentic-AI errors across chained workflows |
| Market/systematic risk | Lower exposure to economy-wide shocks (per LSE research) | AI-incident-driven stock price shocks (-21% average CAR) |
| Fraud risk | AI-powered fraud detection catches anomalies faster | AI-enabled deepfake fraud up over 2,000% in three years |
| Capital allocation | $740bn AI capex driving bank financing revenue | Chicago Fed-flagged tail risk from AI-adjacent loan exposure |
Why It Matters: The New Tail Risks Nobody Priced In
The efficiency and risk-reduction case is genuine, but it is only half the picture — AI introduces categorically new failure modes that traditional bank risk frameworks were not built to handle. Because AI agents chain tools and call other agents, a single error can propagate quickly through banking workflows, with resulting failures cascading into transaction and payment errors, data privacy breaches, and technical failures that become operational disruptions — a mispriced trade, a duplicated payment, or a misrouted customer instruction can multiply across systems before a human reviewer sees the first alert. Generative models still produce confident but incorrect outputs, and in agentic systems, those outputs become instructions: a model that hallucinates a policy, a customer entitlement, or a calculation rule can trigger actions the bank never approved.
The market has already begun pricing this risk directly. Analysis of five US banks and financial services firms found the average short-term cumulative abnormal stock return loss following an AI incident was -21.04%, with the negative impact spreading to the broader financial industry within a three-day window — a measurable, quantified market penalty for AI-related operational failures.
A Systemic-Level Concern
Regulators are increasingly framing this as a financial-stability issue, not just an institution-level risk. IMF analysis suggests that extreme cyber-incident losses could trigger funding strains, raise solvency concerns, and disrupt broader markets, with advanced AI models dramatically reducing the time and cost needed to identify and exploit vulnerabilities — raising the likelihood of simultaneously discovering and targeting weaknesses in widely used systems, meaning cyber risk is increasingly about correlated failures that could disrupt financial intermediation, payments, and confidence at the systemic level.
Separately, the Federal Reserve Bank of Chicago has explicitly flagged banks’ exposure to the AI investment boom itself as a distinct tail risk: commercial loans underwritten by banking institutions have been one of the mechanisms fuelling the capital expenditure increase across the AI value chain, creating a possible AI-bubble tail risk — the risk of losses due to extremely rare events — through banks’ direct lending exposure to AI-adjacent borrowers.
The Governance Gap: Adoption Outpacing Control Frameworks
Nearly 80% of large financial institutions now use some form of AI in core decision-making processes, according to the Bank for International Settlements, yet deploying AI at scale using control frameworks designed for a pre-AI world introduces structural vulnerabilities that can translate into earnings volatility, regulatory exposure, and reputational damage, at times within a single business cycle. For financial analysts, the maturity of a bank’s AI control environment — revealed through disclosures, regulatory interactions, and operational outcomes — is becoming as telling a signal as capital discipline or risk culture.
Profitability outcomes from AI adoption also remain more mixed than the headline productivity estimates suggest: only 40% of respondents report increased profitability from AI, while 43% report no change — a reminder that the $200-340 billion global profit-uplift estimate represents a potential ceiling, not a guaranteed outcome, and depends heavily on execution quality.
What to Do Next
- Distinguish AI-driven risk reduction from AI-driven risk creation when assessing a bank’s AI strategy — both are simultaneously real, and the net effect depends on control-framework maturity, not adoption speed alone.
- Treat a bank’s AI governance disclosures as a genuine credit-quality signal, following the CFA Institute’s framing that AI control-environment maturity is becoming as informative as traditional capital and risk-culture metrics.
- Watch for AI-incident-driven equity volatility as a distinct, quantifiable risk category — the documented -21% average abnormal return following AI incidents is a material, not theoretical, market risk.
- Monitor bank lending exposure to AI-value-chain borrowers as a systemic tail-risk indicator, per the Chicago Fed’s direct warning about commercial loan exposure to AI capital expenditure.
- Prioritise real-time exposure monitoring adoption as the highest-value, most empirically supported AI risk-management application, given its direct link to measurably lower default and credit risk in academic research.
FAQ
Does AI actually make banks safer, or does it just make them more efficient?
Rigorous academic research finds both are true simultaneously: AI-adopting banks experience causally lower default risk, credit risk, and systematic risk, driven primarily by enhanced real-time risk management and early deterioration detection — this is a genuine risk-reduction effect, not just an efficiency gain.
What is the biggest new risk that AI introduces to bank risk management?
Agentic AI systems that chain tools and call other agents can propagate a single error rapidly through banking workflows, with hallucinated policies or entitlements becoming executed instructions — and the market has already priced this risk, with AI incidents at banks associated with an average -21% short-term stock return loss.
How much could AI add to global bank profits?
Generative AI could contribute between $200 billion and $340 billion a year to global bank profits through productivity advances and automation, though only about 40% of institutions currently report actually realising increased profitability from their AI investments.
Discover more from The Economy
Subscribe to get the latest posts sent to your email.

The Medicaid Churn: Front-End Revenue Cycle Risks for Enterprise Hospitals

The 2026 Crypto Regulatory Shift: What It Means for Institutional Investors

AI-Powered Training: The Next Multi-Billion Dollar Ecosystem in Fitness

BRICS Summit 2026: Economic Implications of the India-China Diplomatic Thaw

Emerging Market Debt: The Ripple Effect of China’s Sovereign Refinancing Role

Dropping Oil & Surging Gold: Navigating Safe-Haven Investments in Q3

2026 AI Stock Frenzy: How to Position Your Portfolio

The AI Disruption in Financial Risk Management: Moving Beyond Record Banking Profits

The Rise of Green Aviation: Balancing High Fuel Prices with Sustainable Infrastructure

US-China Relations in Q3 2026: Trade Tariffs and Supply Chain Risks

Emerging Markets Rebound: Top Stock Strategies for the Gulf and South Asia

Tackling the 2026 Global Food Crisis: Policy Shifts and Market Speculation

Post-Quantum Encryption in Banking: The Next Frontier in Cybersecurity Investments

The Financial Cost of Sanctions: Afghanistan’s Economy 5 Years Under the Taliban

China Politburo July 2026: Stimulus Signals Explained

Russia Fuel Shortages 2026: Inside a Cracking War Economy

Top 15 Financial Stocks for Investment in PSX

State Farm’s $5B Dividend 2026: Who Qualifies & Payout Dates

Pakistan Passed Its Third IMF Review

SpaceX Stock Lockup Expiration Explained: Why $123B in Shares Could Hit the Market

Pakistan IMF Program 2026: Inside the Push Toward an Interest-Free Economy

Andy Burnham, UK Gilts and Mortgages: July 2026 Explainer

Russia Oil Revenue 2026: How Sanctions on Rosneft and Lukoil Are Draining the War Chest

Pakistan’s 2026 Monsoon Floods Threaten Fragile Economic Recovery as Inflation Nears 9%

Russia Oil Revenue 2026: The Iran War Windfall and What a Hormuz Deal Means for Moscow

Gold Price 2026: Why Bullion Has Fallen 25% From Its January Record High

Canada US Trade War 2026: Inside Carney’s Push to Cut Ties With Trump’s Tariffs

Russia’s Budget Deficit Blew Past Its Full-Year Target in Three Months
-

 Markets & Finance8 months ago
Top 15 Stocks for Investment in 2026 in PSX: Your Complete Guide to Pakistan’s Best Investment Opportunities
-

 Analysis6 months ago
Johor’s Investment Boom: The Hidden Costs Behind Malaysia’s Most Ambitious Economic Surge
-

 Analysis6 months ago
Top 10 Stocks for Investment in PSX for Quick Returns in 2026
-

 Analysis7 months ago
Brazil’s Rare Earth Race: US, EU, and China Compete for Critical Minerals as Tensions Rise
-

 Banks7 months ago
Best Investments in Pakistan 2026: Top 10 Low-Price Shares and Long-Term Picks for the PSX
-

 Investment8 months ago
Top 10 Mutual Fund Managers in Pakistan for Investment in 2026: A Comprehensive Guide for Optimal Returns
-

 Global Economy8 months ago
15 Most Lucrative Sectors for Investment in Pakistan: A 2025 Data-Driven Analysis
-

 Global Economy8 months ago
Pakistan’s Export Goldmine: 10 Game-Changing Markets Where Pakistani Businesses Are Winning Big in 2025