
Trade Policy
South-South Trade Expansion: Digital Integration and Emerging Market Growth


While headlines in 2026 have focused on U.S.-China tariff escalation and the WTO’s institutional paralysis, the more structurally significant trend in global commerce has been quietly compounding for three decades: South-South merchandise trade has surged from about $0.5 trillion in 1995 to $6.8 trillion in 2025. Today, 57% of developing-country exports go to other developing economies, up from just 38% in 1995. For emerging market investing strategies and businesses evaluating digital services export opportunities, this reorientation — accelerating specifically because traditional U.S.- and EU-centric trade corridors have become less reliable — is arguably the single most durable growth trend in the global economy right now.
Key Takeaways
- South-South merchandise exports reached $6.8 trillion in 2025, a more than 13-fold increase since 1995, driven overwhelmingly by Asia’s regional value chains in high- and medium-tech manufacturing.
- More than half of Africa’s exports now go to other developing markets, reflecting deepening South-South integration well beyond Asia’s established regional value chains.
- Digital services exports are growing far faster than the broader global trade average: developing-country service exports grew an estimated 9% in 2025, versus a global growth estimate of just 2.6%.
- ASEAN’s Digital Economy Framework Agreement (DEFA), scheduled for signature in 2026, is projected to help push the region’s digital economy toward $2 trillion by 2030.
- Latin American digital commerce is projected to expand 12% in 2026 even as regional GDP growth sits around just 2%, with Brazilian SaaS specifically forecast to grow at a 17% annual rate from 2024–2028.
Why South-South Trade Has Become a Structural Growth Engine
The mechanics behind this shift are straightforward but consequential: as global trade tariffs and geopolitical friction make traditional North-South trade routes less predictable, businesses in developing economies are building direct commercial relationships with each other rather than routing everything through advanced-economy intermediaries. UNCTAD’s January 2026 Global Trade Update frames this explicitly — with major trading partners including the United States, China, and Europe all losing growth momentum in 2026 (global growth projected at just 2.6%, and developing economies excluding China slowing to around 4.2%), stronger regional trade and diversification have become critical to building resilience rather than optional strategic nice-to-haves.
| Metric | 1995 | 2025 |
|---|---|---|
| South-South merchandise exports | ~$0.5 trillion | ~$6.8 trillion |
| Share of developing-country exports going to other developing economies | 38% | 57% |
| Primary growth driver | — | Asia’s regional value chains (East/Southeast Asia high/medium-tech manufacturing) |
Africa’s Digital Trade Architecture Is a Genuine Case Study
Africa’s experience illustrates how South-South trade and digital services export growth reinforce each other. The African Continental Free Trade Area (AfCFTA) Digital Trade Protocol, adopted in 2025 with nine annexes and undergoing ratification across African countries in 2026, showcases digital trade as a policy priority at every level of economic development. Digitally delivered services already represent Africa’s fastest-growing export segment, projected to generate $74 billion by 2040, with business process outsourcing (BPO) and IT services identified by a joint WTO-World Bank report as the critical drivers. In Ghana specifically, business, professional, and technical services — including BPO — accounted for 77% of digitally delivered services exports in 2022, a concrete illustration of how digital services can reshape a smaller economy’s entire export profile.
ASEAN: The Region Writing the Playbook for Digital Integration
Southeast Asia’s approach to digital services export integration offers the most advanced regional model currently in operation. The ASEAN Digital Economy Framework Agreement (DEFA), concluded after two years of negotiation in October 2025 and scheduled for signature in 2026, is designed to expedite regional regulatory alignment on e-commerce, electronic payment systems, AI, privacy, and cybersecurity — areas where policy has historically been patchy across the ten-member bloc.
| ASEAN Digital Integration Milestone | Status/Timeline |
|---|---|
| Digital Economy Framework Agreement (DEFA) | Negotiations concluded Oct 2025; signature scheduled 2026 |
| Upgraded ASEAN Trade in Goods Agreement (ATIGA) | Already ratified |
| ASEAN-Australia-New Zealand FTA Upgrade | Effective April 2025 |
| ASEAN Plan of Action for Energy Cooperation (APAEC) 2026-2030 | In progress |
| Projected regional digital economy value by 2030 | ~$2 trillion |
For businesses evaluating international business banking and market-entry strategy, the DEFA’s practical significance is that it converts ten separate, inconsistent national digital-trade regimes into something closer to a single, predictable regulatory environment — precisely the kind of friction reduction that accelerates cross-border digital commerce.
Latin America: The New Priority Corridor for Asian and Global Merchants
Perhaps the clearest evidence that South-South trade dynamics are actively reshaping corporate strategy — not just macro statistics — comes from Latin America’s emergence as a priority market for Asian merchants specifically seeking growth outside uncertain developed markets. Analysis of UNCTAD and Payments and Commerce Market Intelligence (PCMI) data shows:
| Metric | 2026 Figure |
|---|---|
| Projected Latin American digital commerce growth | +12% vs. 2025 |
| Projected Latin American regional GDP growth | ~2% |
| Brazilian SaaS annual growth rate (2024–2028) | 17% |
| Global developing-country service export growth (2025) | 9% (vs. 2.6% global average) |
The gap between Latin America’s modest 2% GDP growth and its far stronger 12% digital commerce growth is itself the story: digital trade is decoupling from traditional GDP-linked growth patterns, expanding specifically because mobile usage in the region is among the highest in the world and because Asian merchants are deliberately diversifying away from developed-market dependence. This pattern is also visible across Sub-Saharan Africa, where reduced reliance on U.S.- and EU-centric trade corridors is driving increased relevance for regional and emerging-market payment and commerce platforms.
Digital Trade’s Structural Constraint: The Closing (But Still Real) Digital Divide
The single biggest risk to continued South-South trade and digital services export momentum is uneven digital infrastructure access. While digitally deliverable services drive much of the sector’s growth, this growth remains limited in least developed countries (LDCs) specifically. UNCTAD data shows the global digital services trade restrictiveness index has actually risen — from 0.168 in 2014 to 0.182 in 2024 — indicating that new regulatory barriers are emerging even as overall digital trade volumes expand. Closing this digital divide, through infrastructure investment, workforce skills development, and supportive regulation, is explicitly identified by UNCTAD as essential if LDCs are to participate meaningfully in the fastest-growing segment of global trade rather than being left further behind.
A Framework for Businesses and Investors
- Treat South-South corridors as a distinct growth thesis, not a residual category. The scale ($6.8 trillion and growing) and the structural drivers (tariff-driven diversification away from traditional partners) mean this is no longer a niche allocation for emerging market investing strategies.
- Prioritize markets with active digital-integration frameworks. ASEAN’s DEFA and AfCFTA’s Digital Trade Protocol both signal jurisdictions actively reducing regulatory friction for cross-border digital commerce — a meaningful de-risking signal for market entry decisions.
- Watch the digital services trade restrictiveness index as a leading indicator. Its steady rise despite booming digital trade volumes suggests regulatory fragmentation risk is building even within the South-South growth story, not just in traditional North-South relationships.
- Evaluate international business banking partners specifically for South-South payment rail capability. As trade reorients away from traditional corridors, payment infrastructure built for USD/EUR-centric settlement increasingly lags behind actual trade flow patterns.
FAQ
How large has South-South trade become?
South-South merchandise exports reached approximately $6.8 trillion in 2025, up from about $0.5 trillion in 1995 — a more than 13-fold increase, with 57% of developing-country exports now going to other developing economies.
Which region is leading digital trade integration in the developing world?
ASEAN is generally viewed as the most advanced model, with its Digital Economy Framework Agreement (DEFA) scheduled for signature in 2026 and projected to help push the region’s digital economy toward $2 trillion by 2030.
Why is Latin America becoming a priority market for Asian companies?
Asian merchants are deliberately diversifying growth strategies beyond uncertain developed markets, and Latin America’s high mobile usage rates are driving digital commerce growth of roughly 12% in 2026, far outpacing the region’s modest 2% GDP growth.
What is the biggest obstacle to continued digital trade growth in developing countries? Uneven digital infrastructure access remains the primary constraint, particularly for least developed countries, compounded by a rising global digital services trade restrictiveness index that signals growing regulatory fragmentation even as trade volumes expand.
Discover more from The Economy
Subscribe to get the latest posts sent to your email.


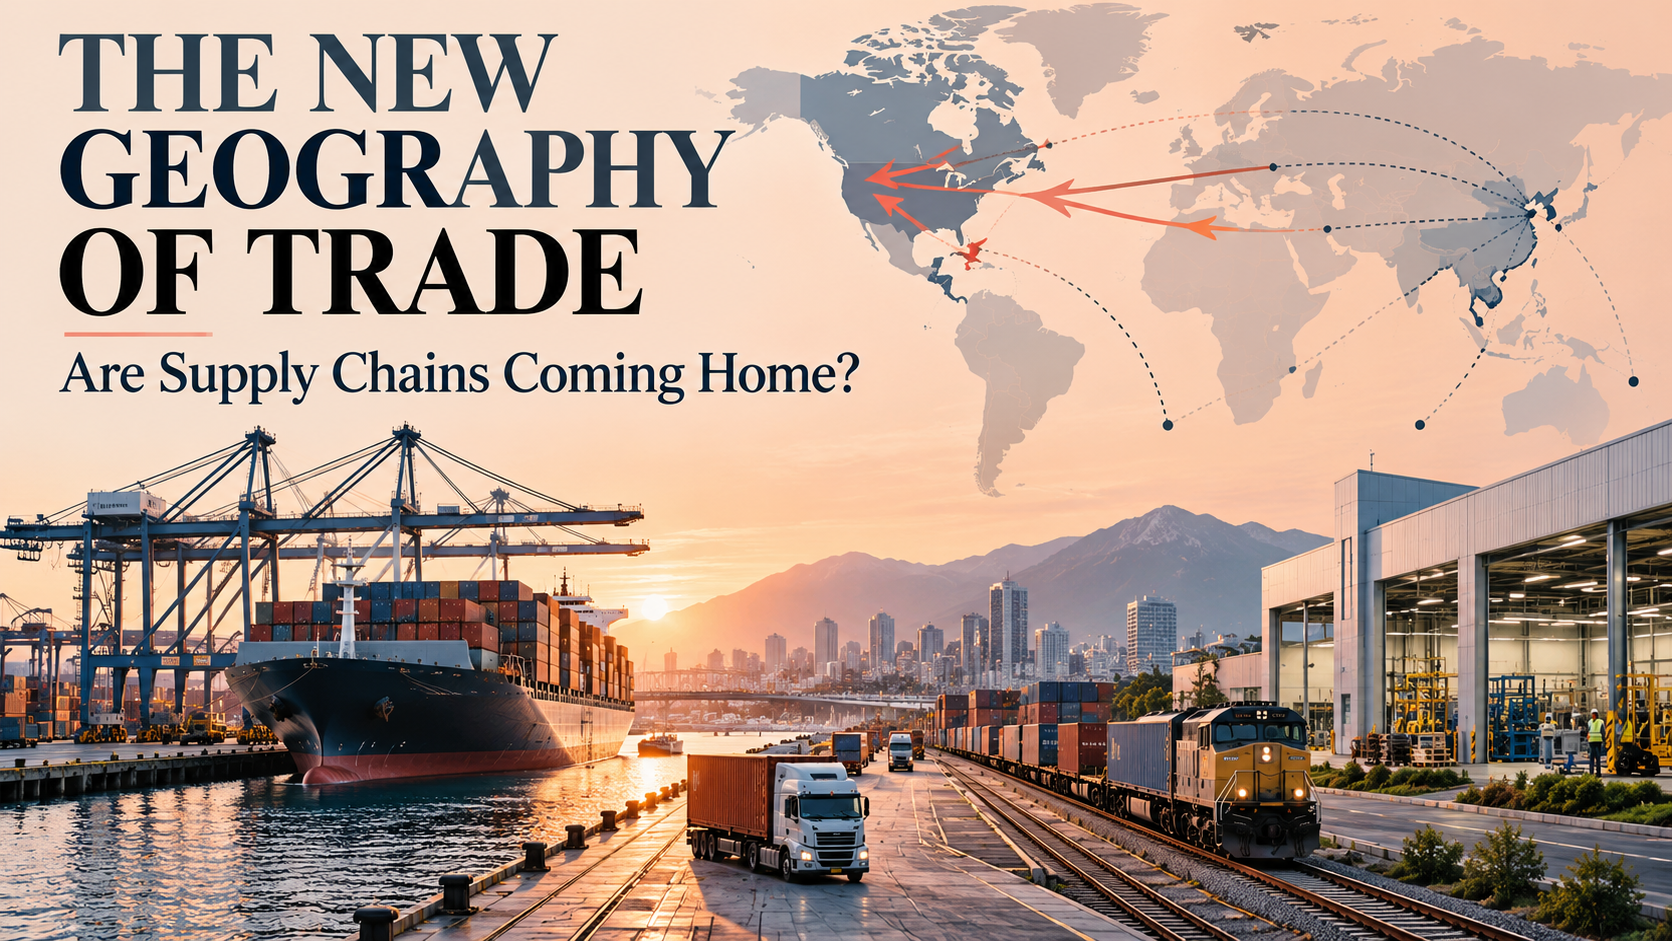
Global supply chains are changing, but the evidence does not support a simple retreat from international trade. Companies are balancing cost against disruption risgek, diversifying suppliers and reconsidering where strategically important production takes place. Some facilities are moving closer to customers; others are shifting to trusted partners or expanding in established Asian manufacturing clusters.
This is a redesign of globalization, not necessarily its end. The World Trade Organization’s October 2026 outlook expects merchandise trade volumes to grow by 3.9% this year and 4.1% in 2027, even after the Middle East conflict disrupted energy and transport routes. The sharper story is which products and economies are driving that growth, and which firms are bearing higher resilience costs.
Key takeaways
- Nearshoring moves production closer to customers; friend-shoring prioritizes strategically aligned partners; neither necessarily eliminates international trade.
- The WTO upgraded its 2026 merchandise-trade growth forecast as supply chains adapted and AI goods demand rose.
- More supplier diversity can reduce disruption exposure but increase inventories, compliance and operating costs.
- Investment is concentrating in advanced technology, energy and strategic manufacturing.
- Pakistan can benefit from supply diversification only through reliable delivery, skills, logistics and trade facilitation.
Why ‘reshoring’ is an incomplete description
A multinational may move one stage of production from a distant supplier while retaining components and equipment sourced from several countries. Measuring the final assembly address tells only part of the story. Modern manufacturing networks are built around intermediate inputs, specialized suppliers, intellectual property and reliable services.
A factory can be geographically close but commercially fragile if critical components still depend on a distant chokepoint. Conversely, a geographically dispersed supplier network can be resilient when sourcing is genuinely diversified and logistics are transparent. Resilience is therefore a property of the entire chain, not merely the location of the last factory.
Trade policy makes this more complex. Tariffs can favour domestic assembly, but firms may still need to import machinery or raw materials. Origin requirements can alter supplier choice. Export restrictions on strategically important technologies can reshape both markets and the timing of investment. These effects should be evaluated product by product rather than described as one global trend.
What the latest trade data actually say
The WTO’s October trade report revised 2026 merchandise trade growth to 3.9%, from 1.9% in its March baseline. It also lowered the 2026 forecast for commercial services trade growth to 3.3%, compared with an earlier 4.8%, with travel affected by the conflict and higher fuel costs. These are different trade categories; stronger goods growth should not be presented as evidence that air travel or every cross-border service is booming.
AI-enabling goods accounted for 47% of merchandise trade-value growth in the first half of 2026, the WTO reports. Technology’s outsized contribution explains part of why trade can appear surprisingly healthy while many importers and tourism businesses are struggling. It also highlights concentration: the countries supplying equipment and components capture gains unavailable to exporters outside those networks.
The WTO’s forecast is conditional. A further disruption in energy markets or a material reassessment of AI investment could change it. Both policymakers and businesses need contingency plans rather than a single straight-line prediction.
Four models of supply-chain redesign
| Strategy | Main objective | Benefit | Hidden cost |
|---|---|---|---|
| Nearshoring | Shorter delivery distance | Lower transit time | May sacrifice supplier specialization |
| Friend-shoring | Reduce geopolitical restrictions | Greater policy predictability | Narrower pool of eligible suppliers |
| Multi-sourcing | Maintain alternatives | Less exposure to one supplier | Higher qualification and management expense |
| Regional hub-and-spoke | Serve several markets from one network | Scale plus regional flexibility | Hub and transport chokepoints remain |
Original conceptual framework. Actual results depend on product, geography and regulation.
The choice depends on what failure costs. A clothing retailer may optimize replenishment speed; a medical-equipment producer may place higher weight on product certification and continuity; a semiconductor user may prioritize access to specialized fabrication. Applying the same sourcing formula to all three would be poor strategy.
A useful model is expected total cost: normal production and shipping costs plus the likely cost of interruption, inventory, financing and regulatory compliance. This is harder to estimate than a unit factory price, but it reflects the risk firms are actually trying to manage.
The investment map is changing faster than most export maps
Companies announce projects before factories become operational. A new plant may require years of permits, construction, utilities, workforce recruitment and supplier qualification. Analysts should therefore separate announced projects, committed spending and actual export shipments.
The UNCTAD World Investment Report 2026 found that global FDI rose to $1.6 trillion in 2025, but was concentrated. Strategic sectors represented 44% of announced greenfield project values, compared with 16% in 2020. This measure tracks the announced value of new projects, not proof that 44% of operating global factories have moved.
The report underscores an uncomfortable problem for smaller economies: courting a strategic investor can require large infrastructure commitments and incentives, while the future employment and technology spillovers remain uncertain. Governments should publish transparent project evaluations rather than compete blindly in subsidy auctions.
Asia is a network, not a single destination
Asian economies occupy different positions in the trade system. Some supply highly specialized chips and equipment. Others offer large-scale assembly, raw materials, logistics or business services. Supply-chain diversification may benefit a secondary production location without displacing the original supplier, because firms often need both sites.
There is also a misconception that supply-chain relocation always means lower-cost labour replacing higher-cost labour. Today, electricity reliability, supplier density, customs efficiency, quality control and geopolitical access can matter as much as hourly wages. Automation can further lower labour’s share of production costs while raising the importance of engineering and maintenance skills.
The WTO’s trade analysis provides a useful check on sweeping narratives: adaptive global supply chains have contributed to stronger-than-anticipated merchandise trade even during the year’s disruption. A more regional structure may coexist with rising worldwide flows of intermediate and capital goods.
Pakistan’s opportunity—and the execution test
Pakistan has reasons to pursue export diversification, but not to assume that geopolitical shifts automatically create orders. International buyers require consistent quality, contract enforcement, dependable energy, timely delivery, predictable taxation and credible documentation. A production location wins repeat business only when the entire operating system performs.
For apparel and textiles, faster customs processing, reliable raw-material access and improvements in compliance can matter greatly. For higher-value engineering exports, testing facilities, supplier certification and technical training are essential. For digital services, payment access, security and customer trust form a different kind of supply chain.
The IMF’s October 2026 Pakistan assessment calls for stronger competition, fewer trade barriers, improved public-sector governance and more cost-efficient energy. These reforms directly influence whether Pakistan can become a viable alternative supplier.
A realistic programme should begin with the sectors in which firms already have export relationships and can upgrade quality or delivery. Public policy then needs to remove obstacles that are common across many firms: unstable electricity, unnecessary permits, costly logistics and low access to export finance.
How executives should stress-test their sourcing strategy
First, map suppliers beyond the first tier. A company can have three direct vendors that all rely on the same factory upstream. Second, identify single points of failure in ports, energy, communications and financing. Third, quantify the working-capital cost of larger inventories. Fourth, model how tariffs and exchange rates change final delivered cost. Fifth, test alternative suppliers before an emergency rather than during one.
The objective is not to eliminate all exposure; that is usually impossible. It is to build enough visibility and flexibility that a temporary interruption does not trigger an expensive production shutdown. Companies should also avoid imposing excessive diversification costs on low-risk items when bottlenecks elsewhere would be more damaging.
Why resilience has a price—but also a payoff
Resilience spending should not be confused with inefficiency. Maintaining a qualified secondary supplier costs money even when the primary supplier operates normally. The economic benefit appears only when a disruption occurs and orders can continue. Governments and firms therefore need to weigh the cost of redundancy against losses from shutdowns, not insist that the lowest invoice price is always optimal.
The opposite mistake is equally serious. A blanket domestic-content rule can force firms to buy expensive inputs without meaningfully reducing exposure, especially where the local supplier still relies on imported components or fuel. The IMF’s October global outlook identifies trade tensions as a potential downside risk; it is not an argument for indiscriminate barriers. Policy should focus on the specific weakness it is designed to address.
Energy infrastructure offers a useful case study. The IEA’s October ASEAN review shows that the region relies on a diverse mix of domestic resources, cross-border supplies and imported fuels. Even a factory producing entirely for a nearby market is exposed if its electricity supply depends on a fragile gas-import route. Trade and energy security therefore need to be planned together.
There is also a development-finance dimension. The UN DESA discussion of the Middle East conflict’s effects highlights how shocks can squeeze financing and investment in lower-income economies. A supplier moving production to a new country does not automatically overcome those financing constraints. Ports, power, quality assurance and working capital need investment before export orders can scale.
Finally, track realized results. UNCTAD’s investment overview demonstrates how strategic investment has become concentrated; the question for recipients is how much translates into operating capacity and domestic supplier development. Governments should publish completed project milestones and the extent of local procurement, rather than count memoranda of understanding as finished factories.
Risks and uncertainties
Trade forecasts can be revised. Supply-chain projects may be delayed or cancelled, and political preferences can change after elections or negotiations. More local production may reduce certain transport risks but increase consumer costs. Friend-shoring can strengthen trust within blocs while fragmenting markets between them. Trade-flow data cannot, on their own, establish the motives behind a company’s sourcing decisions.
What deserves close monitoring is the share of intermediate goods traded, supplier concentration, customs performance, announced versus completed projects, logistics reliability and whether new locations develop an ecosystem of supporting firms. Those measures reveal more than the headline count of relocated factories.
Frequently asked questions
What is nearshoring?
Nearshoring is the movement of production or service activity closer to the customer or final market, often to shorten lead times and reduce transportation exposure.
What is friend-shoring?
It describes sourcing or investment preferences influenced by geopolitical alignment and the desire for dependable international relationships.
Is globalization ending in 2026?
No simple evidence supports that claim. WTO forecasts still show expanding goods trade, but its composition and geography are shifting.
Why is AI relevant to global trade?
AI infrastructure increases demand for semiconductors, servers, electrical equipment and related components, influencing international goods flows.
Do shorter supply chains always reduce costs?
No. A shorter route can reduce delay risk but may increase production prices, capital spending or supplier concentration.
How can Pakistan attract more supply-chain investment?
By improving energy reliability, customs speed, quality assurance, logistics, technical skills and the consistency of trade rules.
Conclusion
The new geography of trade is being defined less by the end of globalization than by the price businesses are willing to pay for reliability. The winners will not necessarily be those closest to customers or those offering the lowest wages. They will be countries and suppliers that combine credible delivery, competitive costs, diversified inputs and predictable policy. That is a demanding agenda—but a useful one for Asia and Pakistan.
Discover more from The Economy
Subscribe to get the latest posts sent to your email.
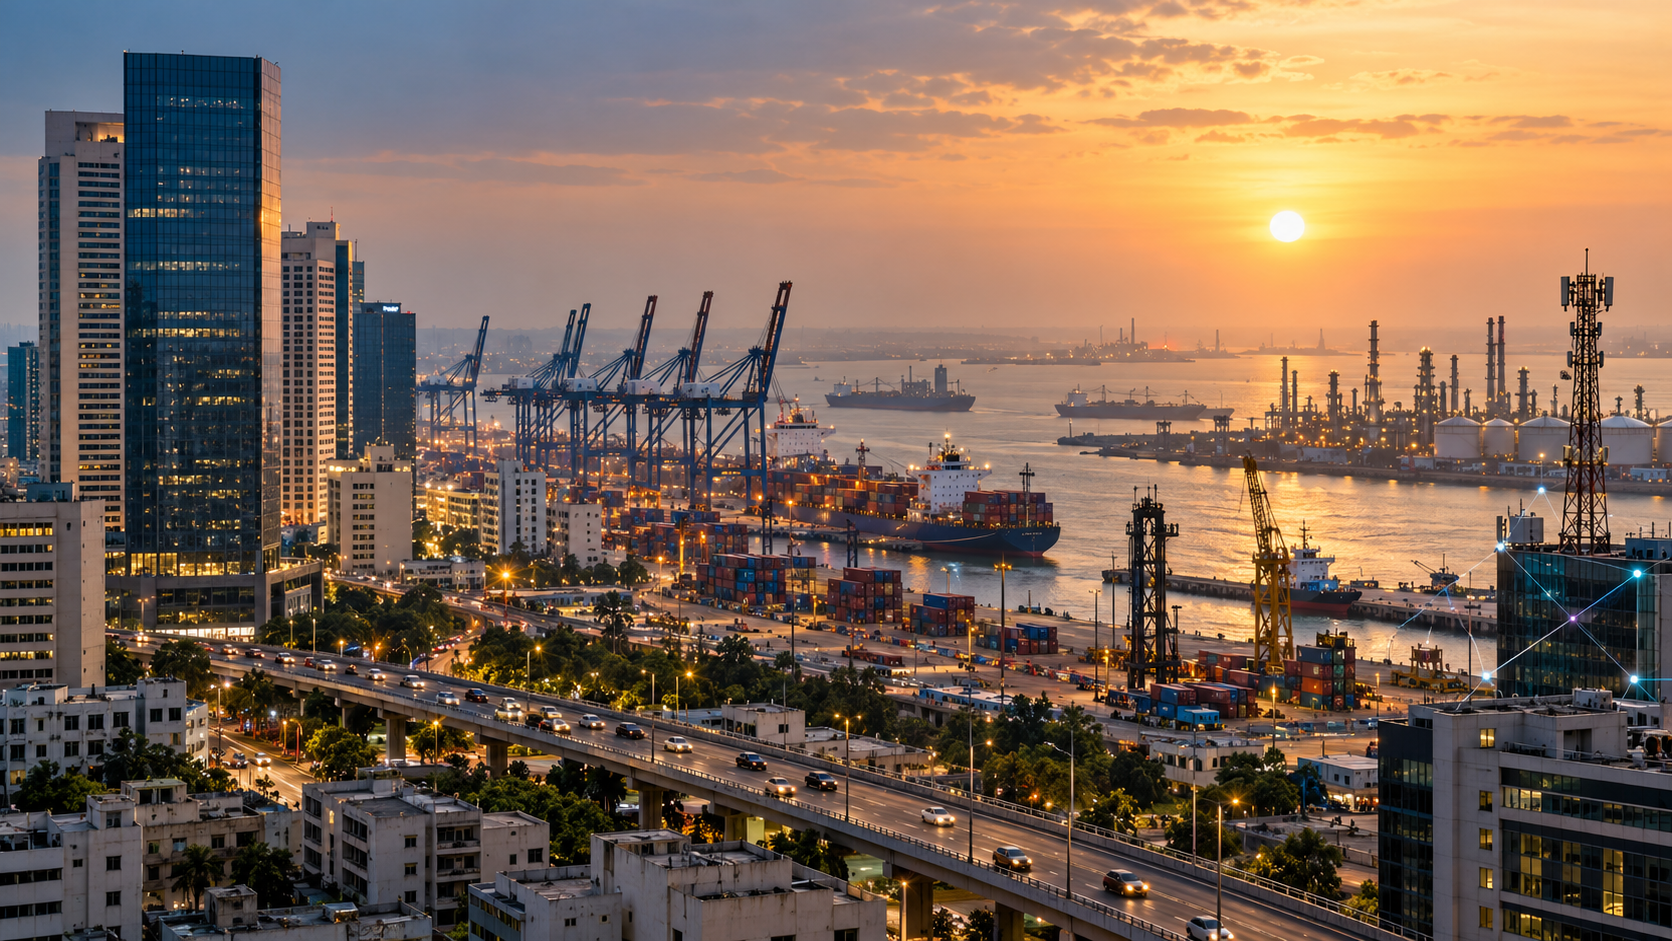
The WTO sees expanding goods trade but an uneven recovery in services. Pakistan needs to distinguish rising global transaction volumes from guaranteed demand for its own export mix. This feature explains the mechanisms, risks and practical decisions that matter through 2027, with particular attention to Pakistan’s different exposure to energy prices, external financing, global trade and AI investment.
At a glance
- World output is forecast to rise, but opportunities and costs are uneven across countries.
- Global inflation forecasts do not predict household prices in Pakistan.
- The AI capital expenditure cycle lifts trade in electronics but may not translate into productivity gains everywhere.
- Pakistan’s IMF staff-level agreement is a milestone, not final Board approval.
- Stronger exports, competitive energy, fiscal credibility and skills are essential to durable growth.
The verified starting point: what the numbers actually say
The IMF October 2026 World Economic Outlook projects global growth of 3.1% in calendar 2026 and 3.4% in calendar 2027, alongside global headline inflation of 4.7% and 4.1%, respectively. Its statistical cutoff is 1 October 2026. The WTO October 2026 trade outlook projects merchandise trade volume growth of 3.9% in 2026 and 4.1% in 2027, versus commercial-services trade volume growth of 3.3% and 6.4%. These are forecasts from different statistical systems, not interchangeable growth measures.
For Pakistan, the IMF Pakistan October 7 staff-level agreement estimated FY2026 growth of 3.6%, September headline inflation of approximately 10.3%, and gross reserves near $21.5 billion at end-September. The fourth EFF review and third RSF review had reached staff-level agreement only, pending IMF Executive Board approval as of the release. Pakistan’s fiscal years run July–June; IMF global growth figures refer to calendar years.
| Indicator | 2026 | 2027 | Important distinction |
|---|---|---|---|
| IMF world GDP growth | 3.1% | 3.4% | Calendar-year projection |
| IMF world headline inflation | 4.7% | 4.1% | Global estimate, not Pakistan CPI |
| WTO goods trade volume growth | 3.9% | 4.1% | Real volume, not nominal trade value |
| WTO commercial services volume growth | 3.3% | 6.4% | Conditional rebound, not guaranteed |
The World Bank June 2026 Global Economic Prospects provides an earlier comparison framework, but its publication date and methodology differ from the October IMF and WTO releases. A thoughtful analysis should compare like with like and should never treat projections as realized outcomes. For a Pakistan-focused story, the crucial question is how global conditions enter domestic economic life.
Why this story matters now
The WTO October 2026 executive summary says AI-enabling goods accounted for 47% of year-on-year growth in the value of world merchandise trade during the first half of 2026. That does not mean 47% of all merchandise trade was AI-related. It identifies a contribution to growth, and in nominal value terms. The same source notes that AI-enabling goods trade rose 67% year-on-year in that period. These figures show how a narrow technology cycle can make global trade appear stronger even as other sectors struggle.
Meanwhile the Reuters October 2026 IMF annual meetings reports persistent concern about global financial risks, geopolitical disruptions and the uneven sharing of AI gains. The Reuters October 2026 Asian growth describes a region where technology investment supports some exporters while energy costs and higher yields challenge others. Pakistan is therefore exposed simultaneously to a potential technology opportunity and to more conventional fuel, financing and trade vulnerabilities.
Why the WTO raised its goods forecast
For why the wto raised its goods forecast, Trade resilience is not evenly shared. Diversion can reward suppliers with dependable shipping, certifications and capacity, while uncompetitive producers may see no benefit at all. The relevance of a global rebound depends on what a country makes and whether buyers can switch suppliers.
This matters for economic decision-making because firms and households cannot adjust instantaneously when conditions shift. Prices, contracts, worker skills and financial obligations move on different schedules. Analysts should identify the timetable, who bears the immediate cost, and who may capture the longer-term benefit.
A credible implementation plan requires named institutions, measurable indicators and regular public reporting. The point is not to promise an effortless transition; it is to make policy options concrete enough to compare their benefits and trade-offs.
Pakistan-specific decision test. For why the wto raised its goods forecast, ask four questions: (1) Which import cost, export opportunity, credit channel or productivity constraint is affected? (2) Which groups face the first-round effects? (3) What could policymakers or firms change within six months? (4) Which published indicator would demonstrate improvement rather than merely announce activity?
What to monitor: (i) official monthly or quarterly data; (ii) movements in export receipts and import bills; (iii) price changes versus changes in physical volumes; (iv) borrowing and working-capital costs; and (v) job quality and household purchasing power. A single monthly reading can be noisy. Comparing several releases helps distinguish a trend from a short-lived disturbance.
Services are a different story
For services are a different story, Pakistan must distinguish nominal export revenue, which can rise because of price changes, from real production volume and domestic value added. A stronger textile invoice is less meaningful if expensive imported energy and materials absorb the gain.
This matters for economic decision-making because firms and households cannot adjust instantaneously when conditions shift. Prices, contracts, worker skills and financial obligations move on different schedules. Analysts should identify the timetable, who bears the immediate cost, and who may capture the longer-term benefit.
A credible implementation plan requires named institutions, measurable indicators and regular public reporting. The point is not to promise an effortless transition; it is to make policy options concrete enough to compare their benefits and trade-offs.
Pakistan-specific decision test. For services are a different story, ask four questions: (1) Which import cost, export opportunity, credit channel or productivity constraint is affected? (2) Which groups face the first-round effects? (3) What could policymakers or firms change within six months? (4) Which published indicator would demonstrate improvement rather than merely announce activity?
What to monitor: (i) official monthly or quarterly data; (ii) movements in export receipts and import bills; (iii) price changes versus changes in physical volumes; (iv) borrowing and working-capital costs; and (v) job quality and household purchasing power. A single monthly reading can be noisy. Comparing several releases helps distinguish a trend from a short-lived disturbance.
Trade diversion versus real competitiveness
For trade diversion versus real competitiveness, Frequent data on delivery times, rejected shipments and repeat orders can help policymakers determine whether export incentives translate into durable commercial relationships rather than short-lived volume spikes.
This matters for economic decision-making because firms and households cannot adjust instantaneously when conditions shift. Prices, contracts, worker skills and financial obligations move on different schedules. Analysts should identify the timetable, who bears the immediate cost, and who may capture the longer-term benefit.
A credible implementation plan requires named institutions, measurable indicators and regular public reporting. The point is not to promise an effortless transition; it is to make policy options concrete enough to compare their benefits and trade-offs.
Pakistan-specific decision test. For trade diversion versus real competitiveness, ask four questions: (1) Which import cost, export opportunity, credit channel or productivity constraint is affected? (2) Which groups face the first-round effects? (3) What could policymakers or firms change within six months? (4) Which published indicator would demonstrate improvement rather than merely announce activity?
What to monitor: (i) official monthly or quarterly data; (ii) movements in export receipts and import bills; (iii) price changes versus changes in physical volumes; (iv) borrowing and working-capital costs; and (v) job quality and household purchasing power. A single monthly reading can be noisy. Comparing several releases helps distinguish a trend from a short-lived disturbance.
Tariffs and the limits of headline access
For tariffs and the limits of headline access, Trade resilience is not evenly shared. Diversion can reward suppliers with dependable shipping, certifications and capacity, while uncompetitive producers may see no benefit at all. The relevance of a global rebound depends on what a country makes and whether buyers can switch suppliers.
This matters for economic decision-making because firms and households cannot adjust instantaneously when conditions shift. Prices, contracts, worker skills and financial obligations move on different schedules. Analysts should identify the timetable, who bears the immediate cost, and who may capture the longer-term benefit.
A credible implementation plan requires named institutions, measurable indicators and regular public reporting. The point is not to promise an effortless transition; it is to make policy options concrete enough to compare their benefits and trade-offs.
Pakistan-specific decision test. For tariffs and the limits of headline access, ask four questions: (1) Which import cost, export opportunity, credit channel or productivity constraint is affected? (2) Which groups face the first-round effects? (3) What could policymakers or firms change within six months? (4) Which published indicator would demonstrate improvement rather than merely announce activity?
What to monitor: (i) official monthly or quarterly data; (ii) movements in export receipts and import bills; (iii) price changes versus changes in physical volumes; (iv) borrowing and working-capital costs; and (v) job quality and household purchasing power. A single monthly reading can be noisy. Comparing several releases helps distinguish a trend from a short-lived disturbance.
Trade reform priorities through 2027
For trade reform priorities through 2027, Pakistan must distinguish nominal export revenue, which can rise because of price changes, from real production volume and domestic value added. A stronger textile invoice is less meaningful if expensive imported energy and materials absorb the gain.
This matters for economic decision-making because firms and households cannot adjust instantaneously when conditions shift. Prices, contracts, worker skills and financial obligations move on different schedules. Analysts should identify the timetable, who bears the immediate cost, and who may capture the longer-term benefit.
A credible implementation plan requires named institutions, measurable indicators and regular public reporting. The point is not to promise an effortless transition; it is to make policy options concrete enough to compare their benefits and trade-offs.
Pakistan-specific decision test. For trade reform priorities through 2027, ask four questions: (1) Which import cost, export opportunity, credit channel or productivity constraint is affected? (2) Which groups face the first-round effects? (3) What could policymakers or firms change within six months? (4) Which published indicator would demonstrate improvement rather than merely announce activity?
What to monitor: (i) official monthly or quarterly data; (ii) movements in export receipts and import bills; (iii) price changes versus changes in physical volumes; (iv) borrowing and working-capital costs; and (v) job quality and household purchasing power. A single monthly reading can be noisy. Comparing several releases helps distinguish a trend from a short-lived disturbance.
Policy options: three alternative paths, not numerical forecasts
| Scenario | Assumptions | Implications for Pakistan | Early warning or confirmation |
|---|---|---|---|
| More favorable | Energy costs stabilize; export markets remain open; AI use generates measurable efficiency | Space for investment, steadier purchasing power and stronger services exports | Export orders, real income and private investment improve together |
| Central case | Global growth follows the broad institutional outlook; commodity and funding pressures fluctuate | Gradual recovery with uneven gains across sectors | Stable external balances without a broad productivity surge |
| Adverse | Energy disruptions persist; financing costs rise; AI investment is repriced | Imports become more costly, credit tighter and fiscal choices harder | Reserves, inflation expectations and financing costs weaken at once |
These are qualitative editorial scenarios, not probabilities assigned by an econometric model. Their value lies in clarifying which evidence would require an updated judgment. The IMF October 2026 World Economic Outlook explicitly emphasizes downside risks involving conflict, trade tension, debt and reassessment of AI expectations.
A practical action agenda
For policymakers, the first responsibility is to protect hard-won macroeconomic stability while removing barriers to productivity. Regulatory predictability, tax administration, targeted social protection and transparent energy decisions are more useful than shifting incentives that are impossible for businesses to plan around. The IMF Pakistan 2026 country report identifies revenue mobilization, reform of state enterprises, energy-sector viability and improvements in human capital as linked policy priorities.
For exporters, resilience means identifying where demand is growing, investing in reliable delivery and obtaining credible certifications. Export strategies should track volumes, domestic value added and customer retention; gross receipts alone do not disclose profitability. For small businesses, the practical priority is to map exposure to fuel, electricity, imports and foreign-exchange requirements and to stress-test cash flows before making expansion commitments.
For households, risk management begins with an affordable budget, attention to debt servicing and a realistic distinction between nominal wage gains and purchasing power. For workers, portable skills and credible training can expand options across changing industries. None of this makes external shocks harmless; it simply offers concrete ways to be less exposed.
How this analysis differs from generic global coverage
Major international reporting is indispensable for establishing what happened. The Reuters October 2026 WTO briefing emphasizes the boost from AI to merchandise trade and the pressure of geopolitical disruption. Institutional releases provide detailed projections. This article goes a step further by asking how those macroeconomic signals might translate into local import costs, export competitiveness, employment, household budgets and reform choices. It is an interpretation of attributed evidence, not a claim of exclusive interviews or original field reporting.
The difference is particularly relevant for Pakistan because a global technology boom may coincide with higher costs for countries that import fuel but do not manufacture the equipment in highest demand. No serious strategy should assume that a worldwide headline rate automatically delivers the same benefits locally.
Frequently asked questions
What is the IMF’s global growth forecast for 2027?
The IMF’s October 2026 World Economic Outlook projects 3.4% global GDP growth in 2027, following 3.1% in 2026. These are calendar-year forecasts and may be revised as new data becomes available. See the IMF October 2026 World Economic Outlook.
Is global inflation expected to fall in 2027?
Yes, the October IMF forecast projects global headline inflation easing from 4.7% in 2026 to 4.1% in 2027. That describes the world aggregate and does not imply that prices in Pakistan will fall in absolute terms.
Is Pakistan’s latest IMF financing already approved?
The 7 October 2026 IMF release announced staff-level agreement for the fourth EFF and third RSF reviews, subject to Executive Board approval. The release should not be described as a completed Board decision. See the IMF Pakistan October 7 staff-level agreement.
Will AI investment create jobs in Pakistan?
It could create demand for implementation, software services and specialist support, while also changing tasks in existing occupations. The result depends on skills, investment, electricity reliability and competitive access to customers. No credible source guarantees a particular employment gain.
Does the WTO predict rapid growth in all kinds of trade?
No. Its October outlook differentiates merchandise volume growth from commercial-services volume growth and notes uneven performance by sector and region. Read the WTO October 2026 executive summary.
What should Pakistani companies monitor through 2027?
Export order books, input costs, electricity reliability, financing terms, exchange-rate conditions and customer demand are more operationally useful than a single global growth figure. Businesses should compare these against their own cash flows and margins.
Conclusion: the decisive issue is transmission, not the headline
The WTO sees expanding goods trade but an uneven recovery in services. Pakistan needs to distinguish rising global transaction volumes from guaranteed demand for its own export mix. The balance of risks is mixed: advanced technology can expand world production and trade, but it does not neutralize an energy shock or a financing squeeze. For Pakistan, policy credibility, internationally competitive exports and productivity-enhancing investment will determine how much of a fragile global expansion becomes better living standards at home.
Discover more from The Economy
Subscribe to get the latest posts sent to your email.
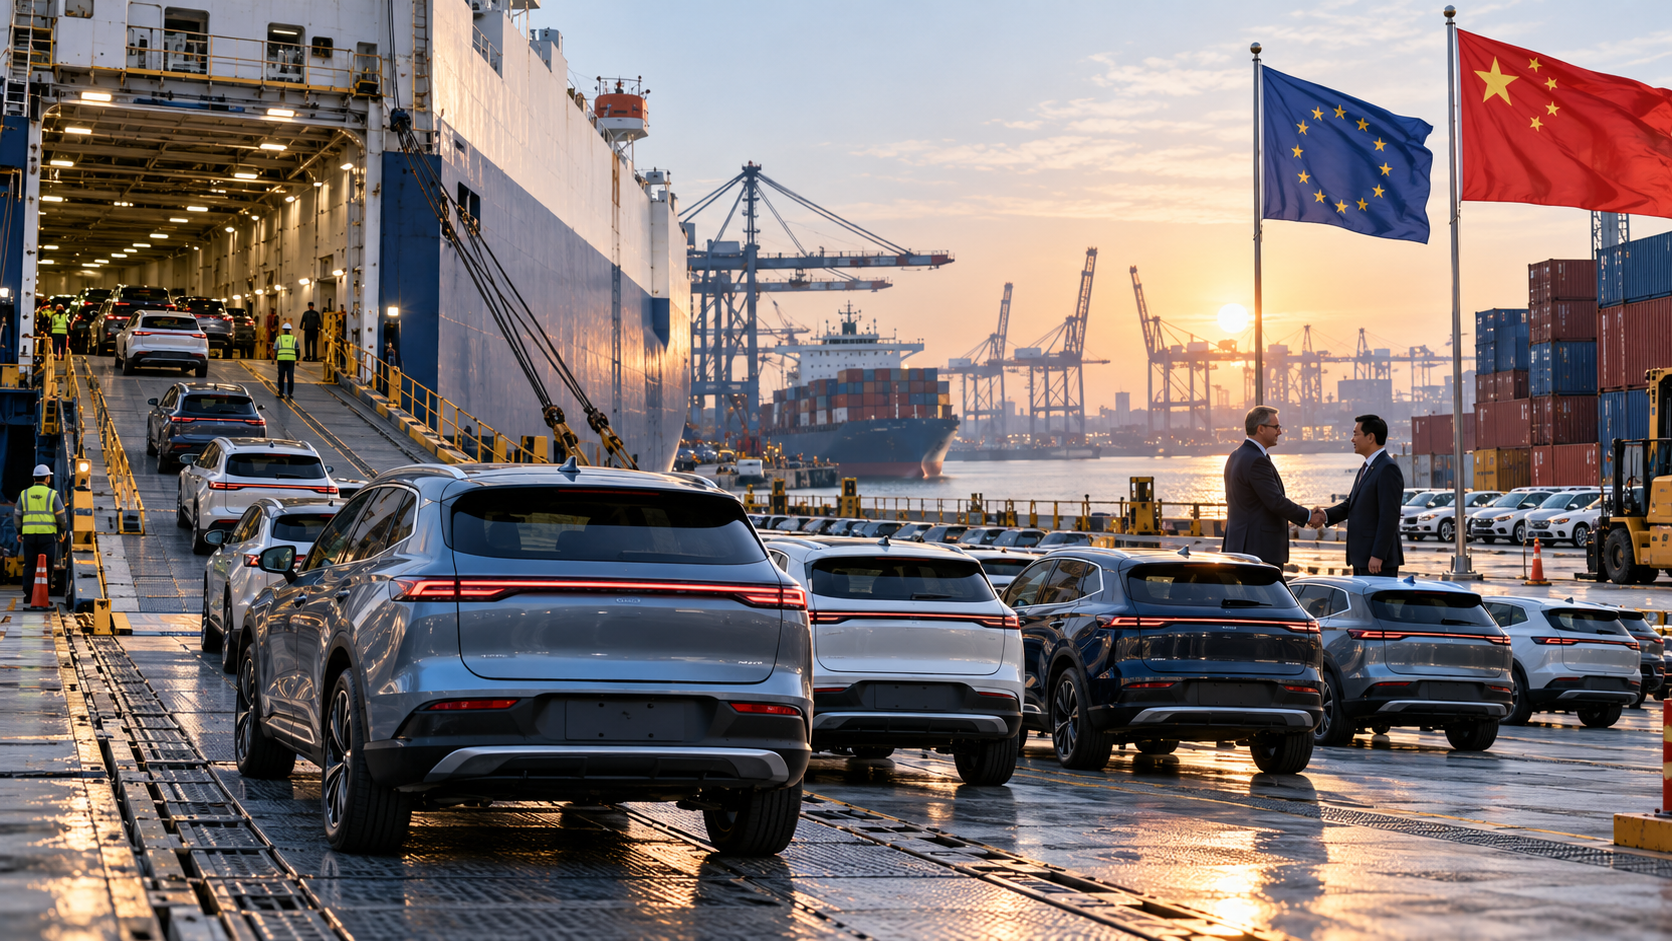
The European Union and China have reached a trade understanding that would sharply limit Chinese hybrid-car imports, reduce selected Chinese tariffs on European goods and ease critical-mineral supply disruptions. But beneath the diplomatic breakthrough lies a much larger conflict over industrial competitiveness, trade imbalances and the future of European manufacturing.
BRUSSELS/BEIJING, October 12, 2026 — China and the European Union have stepped back from a potentially damaging trade confrontation, reaching an agreement that could reshape the European automobile market while opening a new chapter in economic relations between two of the world’s largest trading powers.
The breakthrough, announced on October 9 following negotiations in Beijing, would limit China’s exports of hybrid vehicles to the European Union, improve access to the Chinese market for selected European goods and facilitate licensing for critical rare-earth materials.
The most consequential measure is a planned import quota initially set at approximately 350,000 Chinese-made hybrid vehicles annually, with the ceiling scheduled to rise by 6% each year.
The agreement offers temporary relief after months of escalating friction over Chinese industrial subsidies, European import restrictions and increasingly aggressive competition between Chinese and European manufacturers.
But calling it the end of the trade war would be premature.
The wider dispute remains unresolved, and the agreement’s long-term significance will depend on implementation, regulatory enforcement and whether China and the EU can make progress toward reducing their substantial trade imbalance.
According to Reuters’ October 12 assessment, the arrangement reduces the threat of immediate tariff escalation but replaces it with new risks surrounding import quotas, distribution rights and local manufacturing investment.
The result is not free trade in the traditional sense. It is a negotiated attempt to manage commercial competition before it becomes a broader economic crisis.
Key Takeaways: What the EU-China Trade Deal Means
- Chinese hybrid-car imports face new limits. The EU plans an initial annual ceiling of 350,000 vehicles, rising by 6% annually, compared with a projection of roughly 800,000 shipments in 2026.
- China has accepted a framework for limiting exports. Beijing emphasizes that its producers must receive nondiscriminatory treatment and retain opportunities for growth.
- European exporters receive concessions. China has agreed to lower tariffs on selected products, including automotive components, olive oil and footwear.
- Rare-earth supply chains are part of the understanding. Both sides agreed to facilitate licensing procedures for materials essential to manufacturing.
- The €359.8 billion trade deficit remains a central issue. Europe’s goods imports from China substantially exceed its exports.
- The arrangement is not a complete trade settlement. Further negotiations are scheduled, including another ministerial meeting in March 2027.
What Did China and the EU Actually Agree To?
The agreement followed negotiations on October 8 and 9 between European Trade Commissioner Maroš Šefčovič and Chinese Commerce Minister Wang Wentao, alongside discussions with other senior Chinese officials.
The European Commission’s official account of the consultations describes the talks as productive and confirms that both sides reached a series of understandings intended to stabilize their relationship within the framework of World Trade Organization rules.
The package contains three major components.
1. Restrictions on Chinese hybrid-vehicle exports
The EU has outlined a four-year safeguard arrangement initially limiting imports of Chinese-built hybrid vehicles to approximately 350,000 annually.
The quota is expected to increase by 6% each year.
The Guardian’s October 12 report says the restrictions are expected to begin in December 2026, while the first full-year arrangements cover 2027. The final legal instruments and some implementation details still require clarification.
The policy covers hybrid vehicles, including plug-in hybrids, which became an increasingly important Chinese export category after the EU imposed additional tariffs on battery-electric vehicles in 2024.
EU projections suggest Chinese hybrid shipments could reach around 800,000 vehicles in 2026 without restrictions.
An initial annual quota of 350,000 represents approximately 56% fewer vehicles than that projected baseline.
Crucially, this is a comparison with a forecast, not evidence that actual Chinese exports have already fallen by 56%.
2. Lower Chinese tariffs on selected European products
In return for the automobile arrangements, Beijing agreed to improve market access for several European exports.
According to the Associated Press, the concessions cover products with existing export values approaching €4 billion.
The affected categories include automobile parts, olive oil and footwear, while subsequent reporting also identified ice cream among the products benefiting from lower duties.
The €4 billion figure describes the approximate value of covered trade. It is not the amount of tariffs being eliminated or a guaranteed increase in future European exports.
That distinction is important when assessing the deal’s economic benefits.
Lower duties may improve the competitiveness of affected European products, but actual sales depend on Chinese demand, domestic competitors, exchange rates and other barriers to market access.
3. Greater predictability for rare-earth export licensing
The third component concerns strategically important minerals and industrial materials.
China and the EU have agreed to facilitate Chinese export licensing for rare earths and permanent magnets, according to the Associated Press’ reporting on the negotiations.
These materials support numerous industries, including electric vehicles, wind turbines, industrial equipment and advanced electronics.
The agreement does not establish that China has removed all export controls.
Instead, it represents a commitment to improving licensing processes and making supplies more predictable.
For European companies, reducing administrative delays and uncertainty could be as commercially important as changes in tariffs.
Why Did China Agree to Restrict Its Automobile Exports?
At first glance, China’s willingness to accept limits on one of its fastest-growing export categories appears surprising.
Chinese automakers have invested heavily in electric and hybrid technology, and international expansion has become increasingly important as domestic competition intensifies.
Nevertheless, Beijing faced a difficult choice.
Rejecting the EU’s demands could have encouraged Brussels to introduce more aggressive restrictions, potentially extending the confrontation beyond automobiles.
Accepting a negotiated arrangement allows China to preserve access to an important overseas market while reducing the immediate threat of additional trade retaliation.
China’s public explanation also differs from the European interpretation.
On October 12, the Chinese Commerce Ministry said its agreement with Brussels would ensure that China’s quota for hybrid vehicles would not be lower than quotas allocated to other import sources.
The ministry further emphasized the importance of nondiscriminatory treatment and continued export growth.
As Reuters reported on October 12, Beijing framed the understanding as a way to protect Chinese enterprises and create a more predictable trading environment.
This reveals the underlying compromise.
Europe wants to restrain the speed of Chinese import growth. China wants to preserve market access and prevent a broader campaign of punitive trade measures.
Both sides can therefore claim that the deal protects their core interests, even though neither obtained everything it wanted.
The €360 Billion Problem Behind Europe’s Trade Strategy
The EU-China trade dispute cannot be understood through automobiles alone.
The imbalance between European exports and Chinese imports has become one of the defining economic challenges facing Brussels.
According to Eurostat’s official April 2026 report, the EU imported €559.4 billion in goods from China during 2025 while exporting €199.6 billion.
That produced a goods trade deficit of €359.8 billion.
European exports to China declined by 6.5% compared with 2024, while imports increased by 6.4%.
The imbalance is particularly significant in manufacturing.
EU-China trade: The economic numbers
| Indicator | 2025 figure |
|---|---|
| EU imports from China | €559.4 billion |
| EU exports to China | €199.6 billion |
| EU goods trade deficit | €359.8 billion |
| Year-on-year change in EU exports | -6.5% |
| Year-on-year change in EU imports | +6.4% |
Source: Eurostat, Trade in Goods with China in 2025.
China supplied 22.3% of the EU’s imports from outside the bloc in 2025, illustrating the scale of European dependence on Chinese manufactured products.
More recent official data shows the imbalance continuing.
In the second quarter of 2026, the EU imported €153.6 billion in goods from China, according to Eurostat’s August 26 report.
The underlying problem is structural.
Chinese manufacturers have developed enormous production capacity across automobiles, batteries, machinery, electronics and other industrial sectors.
European policymakers argue that China’s industrial subsidies, scale advantages and market-access restrictions make fair competition increasingly difficult.
China disputes the suggestion that its manufacturing success should automatically be attributed to unfair trade practices.
Chinese officials also argue that European restrictions on technology exports and investment contribute to the imbalance.
The disagreement therefore concerns more than prices or market shares. It reflects competing interpretations of industrial competitiveness and the rules governing international trade.
How the EU’s 2024 Electric Vehicle Tariffs Changed China’s Strategy
The latest agreement is closely connected to the EU’s earlier decision to impose additional duties on Chinese battery-electric vehicles.
In October 2024, the European Commission concluded an anti-subsidy investigation and introduced definitive countervailing duties on imports of Chinese-made battery-electric vehicles.
The measures were designed to address what the Commission described as unfair subsidization threatening European manufacturers.
The policy targeted battery-electric vehicles rather than all electrified vehicles.
That difference created an important commercial incentive.
Chinese manufacturers could expand exports of plug-in hybrid vehicles without facing the same additional duties that applied to fully battery-electric models.
The strategy produced rapid growth.
According to Reuters’ October 12 investigation, China’s hybrid-vehicle exports to the EU reached approximately $7.5 billion in the first half of 2026.
That was three times the $2.5 billion recorded during the same period of 2025.
The surge demonstrated the adaptability of Chinese manufacturers, but it also intensified European concerns that tariffs on one vehicle category were simply shifting competition into another.
The new quota is Brussels’ response.
It changes the central risk facing exporters from the cost of paying additional duties to the possibility of being unable to ship vehicles beyond an annual volume limit.
What is the difference between an import tariff and a quota?
An import tariff raises the cost of an imported product by imposing a duty.
An import quota restricts how much of a product can enter a market.
Under the new hybrid safeguard framework, vehicles exceeding the permitted volume are expected to be prevented from clearing customs rather than simply charged a higher duty, according to the Guardian’s reporting.
For manufacturers, the distinction can be substantial.
A company facing tariffs may choose to absorb part of the cost or raise prices.
A company facing a binding quota may be unable to supply additional vehicles at all.
That can change product planning, dealership arrangements, pricing strategy and decisions about where factories should be built.
Who Wins and Loses From the EU-China Trade Agreement?
The agreement creates different incentives for European manufacturers, Chinese carmakers, consumers and exporters.
European automakers gain temporary protection
Major manufacturers such as Volkswagen, Stellantis and Renault compete in a market undergoing rapid technological and commercial change.
Chinese brands have increased pressure through competitively priced electrified vehicles, improving technology and expanding product ranges.
By slowing the growth of Chinese hybrid imports, the EU may give established manufacturers more time to improve productivity and introduce competitive models.
European industry representatives have welcomed the opportunity for a more orderly adjustment.
However, import restrictions alone cannot resolve underlying problems such as high manufacturing costs, energy prices, investment requirements and the pace of technological innovation.
Without improvements in competitiveness, the protection could offer only temporary relief.
Chinese automakers face new strategic choices
The effect on Chinese manufacturers is more complicated.
Reuters identified SAIC, BYD and Chery as major beneficiaries of the earlier growth in hybrid exports.
Together, those companies accounted for more than 90% of Chinese hybrid sales volume in the EU, according to Jefferies data cited by Reuters.
The new rules may encourage manufacturers to prioritize higher-value vehicles or expand local production in Europe.
Larger companies with established European operations and sufficient investment capital could adapt more easily.
Smaller manufacturers entering the region may face a more difficult challenge.
In a separate Reuters Breakingviews analysis, Katrina Hamlin argued that the arrangement may reflect Beijing’s confidence that its leading manufacturers can increase their European production.
Chinese-built vehicles imported into the EU would be subject to the relevant restrictions, while Chinese-owned factories manufacturing vehicles inside the bloc would generally not be importing completed vehicles from China.
This could encourage a gradual shift from exporting finished cars to investing directly in European manufacturing facilities.
European consumers face a mixed outcome
Import restrictions can support domestic industries, but they can also affect the choices available to consumers.
A smaller supply of competitively priced imported vehicles could reduce price competition in certain market segments.
That may benefit existing manufacturers while limiting affordable options for some buyers.
However, the overall effect on vehicle prices will depend on domestic production, competing imports, demand and manufacturer pricing decisions.
There is not yet sufficient evidence to conclude that the agreement has caused a measurable rise in European vehicle prices.
The consumer impact will become clearer as the quota system begins operating.
European exporters gain market-access opportunities
Companies selling automobile components, footwear, olive oil and other affected products into China could benefit from lower import duties.
These concessions matter because European businesses have repeatedly raised concerns about their ability to compete in the Chinese market.
Nevertheless, the benefits will depend on whether tariff reductions are implemented as announced and whether other barriers continue to constrain sales.
A tariff concession creates an opportunity. It does not guarantee additional demand.
Why Rare Earths Matter as Much as Cars
The automobile agreement has attracted the most attention, but rare-earth licensing is strategically significant.
Rare-earth elements and associated materials are used in permanent magnets, which are essential components in many electric motors and industrial systems.
For an automobile manufacturer, a disruption in a critical component can affect production even when most other inputs remain available.
European policymakers have therefore become increasingly concerned about concentrated global supply chains.
The European Commission’s trade policy framework for China emphasizes the importance of a level playing field, supply-chain resilience and addressing asymmetries in the bilateral economic relationship.
The October agreement offers some reassurance by seeking to make Chinese licensing procedures more predictable.
But European dependence cannot be eliminated through a licensing understanding alone.
Long-term resilience would require investment in alternative suppliers, processing capacity, recycling and strategic inventories.
The risk for Brussels is that a diplomatic disagreement over vehicles could eventually affect entirely different industries through restrictions on essential inputs.
This is why the EU-China relationship cannot easily be reduced to a conventional trade dispute.
Automobiles, critical minerals, industrial policy and advanced technology are increasingly interconnected.
Why France and Germany Are Taking a Tougher Position
European unity has historically been complicated by differences in national economic interests.
Germany has deep commercial relationships with China, particularly through its automobile industry.
France has generally supported stronger European industrial protections in sectors facing intense international competition.
The gap between the two positions has narrowed as concerns over industrial competitiveness have grown.
According to Reuters Breakingviews’ October 9 analysis, France and Germany jointly pushed for stronger EU trade-defense measures, improved supply-chain diversification and mechanisms to respond more rapidly to economic retaliation.
Their approach reflects growing concern that Europe could lose strategically important manufacturing capacity if it remains unable to compete effectively with large-scale foreign producers.
Yet protectionist measures create their own trade-offs.
European carmakers often rely on Chinese production, components and demand.
Some European governments also welcome investment from Chinese automobile and battery manufacturers because new factories can generate employment and support regional development.
Consequently, EU policymakers must balance industrial protection with the risk of discouraging investment or provoking retaliation.
That balance will influence how the new agreement is implemented.
How the Agreement Could Reshape Europe’s Automotive Market
One of the most important consequences may be the acceleration of Chinese investment inside Europe.
When exporting complete vehicles becomes more difficult, building or assembling cars near customers becomes more attractive.
Chinese manufacturers have already begun pursuing that strategy.
According to Reuters’ analysis of the agreement, companies including BYD, Chery, SAIC and Geely have explored or established manufacturing and assembly arrangements in European countries.
Such investments could create European employment and strengthen regional supply chains.
They may also increase competition for established manufacturers operating within the same market.
The economic implications are therefore more complex than a straightforward European victory over Chinese exporters.
Europe may reduce imports of finished Chinese-built vehicles while encouraging additional Chinese-owned manufacturing facilities inside the EU.
Over time, the distinction between a Chinese car company and a European-produced vehicle could become increasingly important.
The key regulatory questions will concern local value creation, investment commitments, competition standards and whether manufacturing is genuinely established within the European market.
Will the Agreement Lower Inflation or Change Global Trade?
The immediate macroeconomic effects are likely to be concentrated in industries directly affected by the concessions.
Import quotas could limit competition in certain European vehicle categories.
Lower Chinese tariffs could support selected European exporters.
More predictable rare-earth licensing could reduce some supply-chain uncertainty.
However, the agreement does not automatically imply a significant reduction in inflation across Europe or China.
Its effect on overall consumer prices will depend on numerous factors, including energy costs, exchange rates, domestic demand, monetary policy and the responses of manufacturers.
The broader international implications may be more important.
The agreement could demonstrate that large economies are capable of negotiating sector-specific solutions even when they remain divided over subsidies, technology restrictions and industrial policy.
Alternatively, it could normalize a more managed form of trade in which quotas, safeguards and negotiated market-access arrangements become increasingly common.
For economies connected to global automotive and electronics supply chains, that development could influence future investment and trade decisions.
Is the EU-China Trade War Really Over?
No. The immediate confrontation has eased, but the underlying disagreements remain.
Several important questions have not yet been fully resolved.
First, the final details of quota administration still matter. Authorities and manufacturers need clarity on how import rights will be allocated, how different vehicle categories will be treated and how compliance will be enforced.
Second, Brussels and Beijing have different priorities.
Europe wants a sustainable reduction in trade imbalances and stronger protection against allegedly unfair competition.
China wants continued access to European consumers and greater certainty that European restrictions will not discriminate against Chinese manufacturers.
Third, existing trade-defense measures on battery-electric vehicles remain distinct from the new hybrid arrangements.
Fourth, future disagreements over semiconductors, industrial subsidies, market access, critical minerals and other strategic goods could trigger renewed tensions.
Finally, domestic political pressures may make the compromise difficult to sustain.
European governments face pressure to protect manufacturing employment, while Chinese authorities are seeking to support industrial growth and exports.
These forces will not disappear because negotiators reached an understanding in Beijing.
What Happens Next? Three Scenarios for 2027
Scenario 1: Managed competition becomes the new normal
The EU implements the quota framework, China delivers the promised market-access concessions, and rare-earth licensing becomes more predictable.
Both sides continue negotiating additional sector-specific arrangements while avoiding major retaliation.
This would produce a relationship characterized by managed competition rather than unrestricted trade.
Scenario 2: The agreement generates new investment
Chinese automobile manufacturers expand manufacturing in European countries to maintain market access.
European suppliers and workers benefit from some of the resulting investment, while domestic automakers face stronger competition from locally produced vehicles owned by Chinese groups.
Under this scenario, the trade restrictions could accelerate a restructuring of Europe’s automobile industry rather than simply reduce Chinese commercial influence.
Scenario 3: Implementation disputes revive the confrontation
Disagreements emerge over the quota’s legal design, its allocation among manufacturers, market-access concessions or export licensing for critical minerals.
The EU considers stronger trade-defense measures, while China responds with restrictions affecting European commercial interests.
This would undermine the temporary stabilization and increase uncertainty for manufacturers, suppliers and investors.
These are possible outcomes, not predictions with assigned probabilities.
The durability of the October understanding will become clearer as implementation rules are finalized and further negotiations take place.
Timeline: How the EU-China Trade Dispute Reached a Breakthrough
| Date | Major development |
|---|---|
| October 2024 | EU imposes definitive countervailing duties on Chinese-made battery-electric vehicles |
| 2025 | EU goods trade deficit with China reaches €359.8 billion |
| First half of 2026 | Chinese hybrid exports to the EU triple in value to approximately $7.5 billion |
| October 8–9, 2026 | Senior EU and Chinese officials negotiate in Beijing |
| October 9, 2026 | Both sides announce an initial trade understanding |
| October 12, 2026 | China describes nondiscrimination and export-growth provisions; further quota details emerge |
| December 2026 | Expected initial introduction of the EU’s new hybrid restrictions |
| March 2027 | Next ministerial EU-China Trade and Investment Consultations planned |
Sources: European Commission, Eurostat, Reuters and The Guardian.
Frequently Asked Questions
What is the EU-China trade deal of October 2026?
It is a negotiated trade understanding involving restrictions on Chinese hybrid-car exports to the EU, reduced Chinese tariffs on selected European products and cooperation on rare-earth export licensing. It aims to stabilize economic relations and prevent further escalation.
How many Chinese hybrid cars can enter the EU under the new deal?
The announced framework envisages an initial annual quota of approximately 350,000 vehicles, increasing by 6% annually. The final implementation rules remain important.
Has China agreed to end its trade dispute with Europe?
No. The October understanding reduces immediate tensions but does not resolve the wider disputes over industrial subsidies, trade imbalances, electric-vehicle duties and technology restrictions.
Will Chinese electric vehicles become more expensive in Europe?
The new agreement primarily concerns import volumes for hybrid vehicles. Its price effects are uncertain. Separately, EU countervailing duties on Chinese-made battery-electric vehicles remain a distinct policy issue.
Which Chinese automakers could be affected?
Major companies with European hybrid sales, including BYD, SAIC and Chery, are exposed to the new import framework. Manufacturers with European production arrangements may be better positioned to adjust over time.
What did European exporters receive in return?
China agreed to lower tariffs on selected European products, including automotive components and certain consumer goods. The affected export categories have an existing trade value approaching €4 billion, according to EU officials cited by the Associated Press.
Why is the EU concerned about its trade deficit with China?
The EU imports significantly more merchandise from China than it exports to the Chinese market. Policymakers argue that the imbalance creates pressure on European manufacturing and reflects wider differences in industrial support and market access.
When will China and the EU hold their next trade talks?
The European Commission has confirmed plans for another ministerial meeting in March 2027, with additional discussions expected before then.
Final Analysis: A Trade War Paused, Not a Competition Resolved
The October 2026 EU-China agreement is significant because it shows that Beijing and Brussels remain willing to compromise when the economic consequences of confrontation become difficult to ignore.
Europe secured a framework for restraining rapidly growing Chinese hybrid-car imports.
China preserved access to a major international market and obtained commitments intended to protect its manufacturers from discriminatory treatment.
Selected European exporters gained tariff concessions, while both sides recognized the importance of more reliable critical-mineral supply chains.
But the most important problems remain largely unchanged.
Europe faces intense pressure to improve its industrial competitiveness. China continues to rely on advanced manufacturing and overseas markets as important sources of economic growth. Both sides remain deeply connected through trade, investment and production networks.
The new agreement may reduce immediate risks, but it also illustrates the emerging reality of global commerce: economic interdependence no longer guarantees unrestricted market access.
The decisive test will be whether Brussels and Beijing can turn this limited diplomatic breakthrough into a stable, transparent and commercially workable relationship.
For now, the EU-China trade war is on pause. The contest over the future of global manufacturing is not.
Discover more from The Economy
Subscribe to get the latest posts sent to your email.

Neocloud Economics in 2026: GPU Debt, Utilization and Power

What Is a Neocloud? How AI GPU Clouds Work and Compare

Lula Re-elected in 2026: What Changes for the Dollar, Brazilian Stocks, and Interest Rates?

Lula Wins Brazil’s 2026 Election: Five Economic Tests for 2027

SSI November 2026 Payment: Why Benefits Arrive October 30

Russia Sanctions Waiver: What Asian Oil Buyers Gain

Asia Markets Weekly: How Oil, US Yields and the Fed Reach Tokyo, Kuala Lumpur and Karachi

Gold Near $4,000: Buy, Hold or Wait? A Pakistan Tola Price Guide

US 10-Year Treasury Yield Near 5%: The Hidden Cost for Pakistani Investors

Fed Meeting on October 28: Hike or Hold—and Why Pakistan Investors Should Care

Can Pakistan Turn US–Iran Mediation Into an Economic Dividend?

Oil Above $100: How Higher Crude Prices Reach Pakistan’s Rupee, Petrol and Imports

SBP Interest Rate at 11.5%: What Will Decide Pakistan’s Next Policy Move?

The Global South: Debt, Climate Finance and Investment in 2026

Crude Oil & Petroleum Market Analysis: OPEC+ Decisions and Price Forecasts

Top US Convenience Store Chains: Store Counts, EV Charging, and Sales Trends

Algorithmic Dogfights: Why the U.S. and China Must Establish Rules of Engagement for Autonomous Air Power

Who Is Shivon Zilis? The Neuralink Executive at the Center of the Musk–OpenAI Trial

Social Security Extra $90 Deposit: Who Qualifies for the October 2026 Medicare Rebate?

Corporate America Faces a New Debt Test as US Borrowing Costs Surge

Global Economic Outlook 2026: 7 Forces Reshaping Markets, Trade and Business

Gold Price Outlook 2026: The Forces Behind the Forecasts—and What Could Reverse Them

Gold Falls 3.7% as Yields Surge: Is Gold Still a Safe Haven in 2026?

Stock Market Today: Dow, S&P 500, and Nasdaq Retreat as Treasury Yields

Anthropic Bans Sustained Abuse of Claude AI Under New Usage Policy Effective November 12, 2026

MAS Allocates S$1.45 Billion to Five Asset Managers in Third EQDP Batch: Total Deployment Reaches S$5.4 Billion

Geopolitics and Your Portfolio: How International Affairs Move Global Markets

US 10-Year Yield Hits 5.24%: What the Historic Bond Market Sell off Means for Mortgages and Investors
-

 Markets & Finance10 months ago
Top 15 Stocks for Investment in 2026 in PSX: Your Complete Guide to Pakistan’s Best Investment Opportunities
-

 Analysis8 months ago
Johor’s Investment Boom: The Hidden Costs Behind Malaysia’s Most Ambitious Economic Surge
-

 Analysis8 months ago
Top 10 Stocks for Investment in PSX for Quick Returns in 2026
-

 Banks9 months ago
Best Investments in Pakistan 2026: Top 10 Low-Price Shares and Long-Term Picks for the PSX
-

 Analysis9 months ago
Brazil’s Rare Earth Race: US, EU, and China Compete for Critical Minerals as Tensions Rise
-

 Investment10 months ago
Top 10 Mutual Fund Managers in Pakistan for Investment in 2026: A Comprehensive Guide for Optimal Returns
-

 Global Economy10 months ago
15 Most Lucrative Sectors for Investment in Pakistan: A 2025 Data-Driven Analysis
-

 Global Economy10 months ago
Pakistan’s Export Goldmine: 10 Game-Changing Markets Where Pakistani Businesses Are Winning Big in 2025