
Analysis
Trump’s “Golden Age” Gamble: What the 2026 State of the Union Really Tells Us About the U.S. Economy
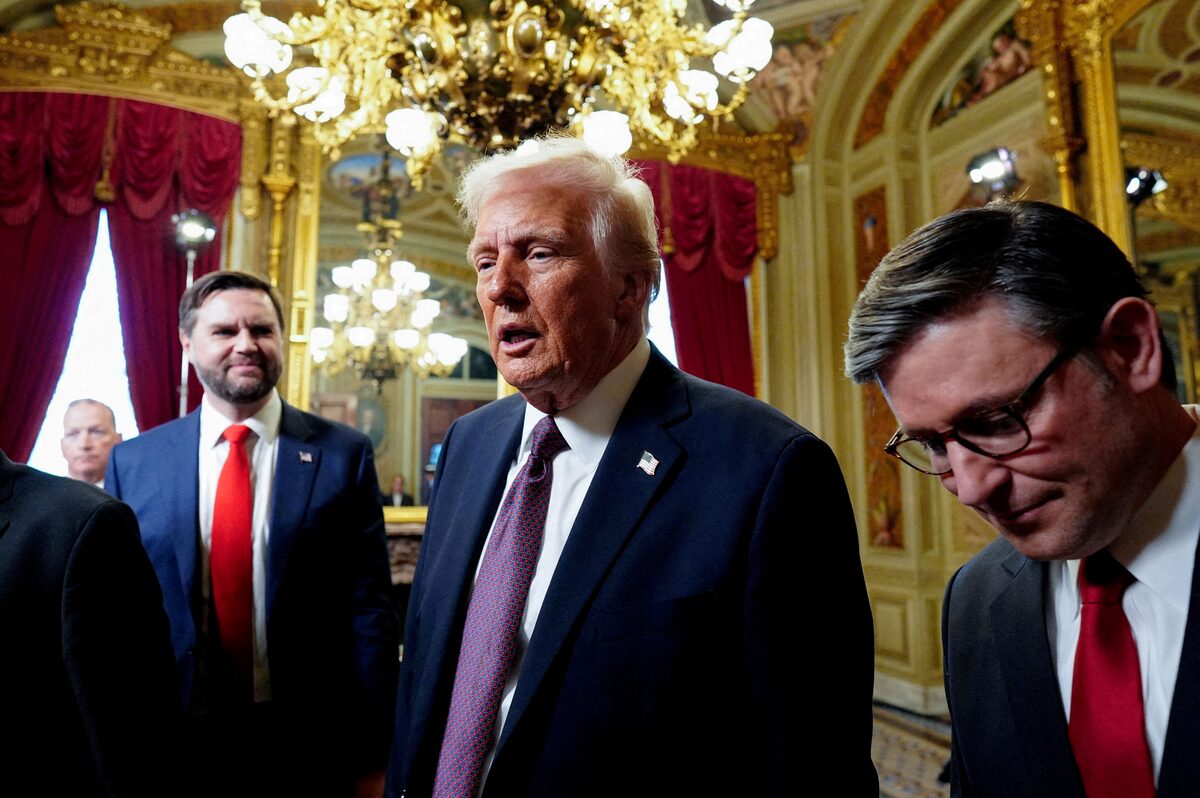
There is a particular ritual to the State of the Union address—the motorcade, the joint session, the standing ovations choreographed to the split-second. But when Donald Trump strode into the House chamber on Tuesday evening to a thunderous Republican cheer of “USA, USA,” the moment carried unusual freight. Empty seats stretched across the Democratic side of the aisle, where lawmakers had chosen anti-Trump rallies over a front-row seat to history. What followed was the longest State of the Union address ever delivered—a speech that will be remembered less for its pageantry than for the tension between its triumphalist claims and the stubborn arithmetic of American household finances.
For Trump, the stakes could not be higher. His approval ratings have slumped into the low-to-mid forties across major polling aggregators, and the November midterm elections loom as a referendum not just on his party but on his personal brand of economic stewardship. Advisers have reportedly urged him to reframe his presidency around pocketbook issues. Tuesday’s address was his most sustained attempt yet to do exactly that.
“Our nation is back—bigger, better, richer and stronger than ever before,” the president declared, invoking what he called a new “golden age” of American prosperity.
But does the data support that narrative? The answer, as with most things in economics, is complicated.
Trump’s Economic Record: The Case for the Defense
To be fair to the administration, several macroeconomic indicators do offer genuine talking points. According to the Bureau of Labor Statistics, headline CPI inflation stood at 2.4 percent in January 2026—down sharply from the 9.1 percent peak reached in June 2022 under the Biden administration. Core inflation, which strips out volatile food and energy prices, had eased to around 3.2 percent year-on-year, a meaningful deceleration that economists broadly attribute to a combination of Federal Reserve tightening and normalizing supply chains—though Trump has been quick to claim credit.
The stock market has, by any measure, performed. The S&P 500 has notched several record closes in the past quarter, buoyed by the administration’s sweeping Tax Cuts and Economic Expansion Act, signed in late 2025, which slashed the corporate rate to 18 percent and expanded the standard deduction for middle-income households. Analysts at Goldman Sachs noted in a January 2026 research note that equity valuations reflect genuine earnings growth, not merely monetary stimulus—a distinction that matters for the administration’s credibility on Wall Street.
On energy, Trump’s “drill, baby, drill” posture has delivered measurable results at the pump. The national average for regular gasoline stood at approximately $2.95 per gallon as of mid-February, according to AAA—a figure that resonates viscerally for working-class families who remember $4-plus pump prices. Egg prices, the unlikely symbolic battleground of the post-pandemic inflation era, have fallen roughly 34 percent year-on-year, though they remain elevated against 2021 baselines.
The labor market, while cooling from its pandemic-era fever, added a revised 181,000 jobs on average per month across 2025, per BLS revisions released in January 2026. Unemployment sits at 4.1 percent—historically low, even if wage growth has moderated.
The Reality Check: Where Trump’s “Golden Age” Narrative Strains Credibility
Here is where the speech’s triumphalism collides with lived experience—and why opinion polls consistently show voters unconvinced. An AP-NORC survey conducted in early February found that fewer than four in ten Americans approved of Trump’s handling of the economy, with “cost of living” ranking as the top concern among respondents for the fifteenth consecutive month.
The disconnect is not irrational. While headline inflation has fallen, the price level—the cumulative cost of groceries, rent, insurance, and utilities—remains roughly 20 to 25 percent higher than it was in January 2021, according to BLS historical CPI data. Disinflation is not deflation. Prices have stopped rising as fast; they have not fallen back to where most Americans remember them. When Trump declared that “inflation is plummeting,” he was technically describing the rate of change. What households experience is the stock—the total damage already done to purchasing power.
Housing affordability presents a particularly stubborn challenge. The median home price in the United States remains near historic highs, and while mortgage rates have eased slightly from their 2023 peaks, a 30-year fixed rate hovering around 6.5 to 6.8 percent still prices out millions of first-time buyers. The National Association of Realtors’ Housing Affordability Index remains near its lowest reading in four decades.
Tariffs—perhaps the administration’s most consequential and contested policy lever—have injected fresh uncertainty into both domestic prices and global supply chains. Trump’s sweeping tariff regime, which has applied levies of up to 25 percent on imports from Canada and Mexico and targeted Chinese goods with duties exceeding 60 percent in some categories, has drawn withering criticism from economists across the ideological spectrum. A February 2026 analysis by the Tax Foundation estimated that the tariff package functions as an effective tax increase of roughly $1,200 per household annually—a regressive burden falling hardest on lower-income families who spend a higher share of income on goods. The Peterson Institute for International Economics has flagged spillover effects for global trade, with the WTO projecting a measurable contraction in merchandise trade volumes for 2026.
The Midterm Calculus: Can a SOTU Reset the Political Equation?
Political strategists on both sides of the aisle were watching Tuesday’s address as much for its electoral arithmetic as its policy content. The conventional wisdom in Washington holds that midterm elections are fundamentally referendums on the incumbent president, with economic sentiment serving as the dominant variable. On that metric, the administration faces an uphill climb.
A NPR/PBS NewsHour/Marist poll released days before the address found that 54 percent of Americans believe the country is heading in the wrong direction—a figure that, historical precedent suggests, correlates strongly with midterm losses for the president’s party. Republicans control both chambers but by margins narrow enough that a modest swing could flip the House.
Trump’s approach on Tuesday was, by his standards, disciplined. For the better part of the opening hour, he adhered closely to a prepared script—a decision that aides had lobbied for precisely because undisciplined digressions have historically dominated post-speech news cycles and drowned out intended economic messaging. The strategy partially worked: the first wave of coverage acknowledged the tone shift. But the combative interruption—exchanged insults with Democratic lawmakers during the immigration segment—provided opposition research material that will almost certainly feature in campaign advertising.
The question, for Republicans running in competitive districts, is whether a presidential speech can move numbers that structural economic forces have resisted for months. Political scientists are skeptical. “State of the Union addresses rarely produce durable polling shifts,” noted Kathleen Hall Jamieson of the Annenberg Public Policy Center in a post-speech analysis. “Voters update their economic assessments based on what they experience at the grocery store, not what they hear from a podium.”
Global Implications: How America’s Economic Narrative Lands Abroad
Beyond domestic politics, Trump’s economic framing carries significant international consequences. The “golden age” rhetoric—and the nationalist economic policies underlying it—has complicated U.S. relationships with trading partners from Brussels to Beijing. European officials have privately expressed concern that a second Trump term marked by tariff escalation and dollar weaponization risks fragmenting the rules-based trading system that underwrote seven decades of Western prosperity.
The International Monetary Fund’s January 2026 World Economic Outlook revised down global growth projections partly on the basis of U.S. trade policy uncertainty, citing heightened risk premiums and supply chain fragmentation. For emerging markets that depend on access to U.S. consumers and dollar-denominated financing, the “America First” posture is less a golden age than a structural headwind.
Within the United States, the tariff-driven industrial revival has produced genuine wins in specific sectors—semiconductor fabrication investment has accelerated, and steel production has ticked upward—but the broader manufacturing renaissance Trump promised remains uneven. Many of the announced factory investments are long-gestation projects that will not produce jobs or output within the current electoral cycle.
The Verdict: A Presidency in Search of Its Own Story
Trump’s 2026 State of the Union was, at its core, an attempt to construct a coherent economic narrative from a genuinely mixed record. Some indicators are legitimately positive. Others reveal persistent structural strains that policy alone cannot quickly resolve. The administration’s instinct to claim credit for the former while minimizing the latter is universal in politics—but in an era of data-literate voters and relentless fact-checking, that gap between rhetoric and reality is harder to sustain.
The midterms will ultimately turn on whether Americans, sorting through that complexity in voting booths across the country, decide that the trajectory of the economy matters more than its current altitude—or vice versa. History suggests the latter usually wins.
What is certain is that Tuesday’s address did not settle the argument. It simply opened the next chapter of it.
Discover more from The Economy
Subscribe to get the latest posts sent to your email.


Oil Markets
China’s Oil Shock Absorber: How Beijing Kept Crude Prices Half of What Analysts Predicted

Analysts predicted oil above $200 during the Hormuz crisis. China’s intervention kept prices roughly half that. Fortune and Bloomberg explain how Beijing did it — and why the strategy has limits that markets have not fully priced in.
The $200 Oil That Never Arrived
When Iranian forces declared the Strait of Hormuz closed in early March 2026, the analytical consensus in energy markets shifted rapidly toward a catastrophic scenario. The Strait carries 27% of globally traded crude oil and petroleum products (Congressional Research Service, 2026). Iran had demonstrated both the capability and willingness to enforce that closure through attacks on shipping. A sustained blockade, analysts projected, could push Brent crude to $150, $175, or even above $200 per barrel — levels not seen since the 1970s oil shocks in real terms.
Brent reached approximately $113 at its peak in April. That is a severe price spike by any historical standard — a 100%-plus rise from January levels of around $56. But it is emphatically not $200. And the primary reason it is not $200, according to reporting from Fortune and Bloomberg, is China (Fortune, June 2026).
How Beijing managed to suppress oil prices to roughly half of what the most bearish forecasters projected — and why analysts warn that capability has limits — is one of the most consequential and under-analysed stories in global energy markets this year.
Key Takeaways
- Analyst consensus during the Hormuz closure was for Brent crude to potentially breach $200/barrel
- China’s strategic reserve releases, demand management, and alternative supply sourcing kept prices around $100–113 at their peak
- China receives approximately one-third of its total oil imports via the Strait of Hormuz
- Beijing is reportedly running out of its ability to continue suppressing oil price volatility through reserves alone
- The longer-term consequence may be a permanent reshaping of Asian energy supply chains away from Gulf dependence
China’s Structural Exposure and Its Response
China is not merely a passive participant in global oil markets. It is, by a significant margin, the world’s largest crude oil importer, and the Strait of Hormuz occupies a central role in its energy security architecture. Approximately one-third of China’s total oil imports — representing about 3–4 million barrels per day — transits the Strait of Hormuz (Wikipedia / 2026 Hormuz Crisis). The disruption of that supply was not an abstract geopolitical concern for Beijing; it was a direct threat to industrial production, electricity generation, and economic stability.
China’s response operated on multiple fronts simultaneously. The most immediate was the release of strategic petroleum reserves — a buffer that Beijing has been systematically expanding since the early 2000s precisely in anticipation of supply disruptions. China’s strategic reserve capacity, estimated at approximately one billion barrels by the time of the conflict, provided a multi-month cushion that allowed Chinese refineries to maintain throughput without paying spot prices at the elevated levels that would otherwise have cleared the market (Wikipedia / Hormuz Crisis).
Simultaneously, Beijing accelerated the diversification of its spot purchasing toward West African, Russian, and Central Asian supply — suppliers not exposed to the Strait bottleneck. Russia, whose pipeline export routes run overland through Central Asia and whose Pacific coast ports access Chinese markets without Middle East transit, saw a significant increase in contracted volumes. The rapid rerouting of demand is a function of commercial relationships that China’s National Petroleum Corporation and Sinopec have been cultivating for precisely this scenario for over a decade.
Demand Management: The Hidden Tool
Less visible but equally important was demand-side management. China’s centralised economic planning apparatus has tools that market economies simply do not possess. When spot crude prices spiked, Chinese industrial regulators directed state-owned enterprises in energy-intensive sectors — aluminum smelting, steel production, cement manufacturing — to reduce output or shift to pre-accumulated inventory rather than purchase at market prices.
This is not a price mechanism adjustment; it is a direct administrative intervention in the quantity of oil demanded. By reducing industrial throughput in sectors where the marginal cost of a production pause is relatively low, Beijing effectively shifted the demand curve downward during the period of peak supply disruption — suppressing the equilibrium price without directly intervening in international markets.
The geopolitical complexity of this strategy should not be overlooked. China’s demand management created cover for an implicit diplomatic position: Beijing was neither supporting the U.S.-led international effort to reopen the Strait nor openly backing Tehran’s closure. It was simply managing its own economic exposure — a position that Xi Jinping could maintain with public statements calling the Strait’s openness “in the common interest of regional countries and the international community” while privately doing whatever was necessary to insulate the Chinese economy from the worst consequences (Wikipedia / Hormuz Crisis).
Why the Strategy Has Limits
Fortune’s analysis is clear: China’s oil shock absorption cannot continue indefinitely, and cannot protect global markets much longer at current intensity (Fortune, June 2026).
The strategic petroleum reserve, however large, is a finite buffer. It is designed to cover weeks or a few months of disruption — not a sustained multi-year reorientation of global supply chains. Every barrel released from reserve must eventually be replaced, and replacement purchases at a time of market tightness push prices back up. If the Hormuz situation were to deteriorate again after a partial reopening, China’s reserve cushion would be materially depleted compared to its pre-crisis level.
The administrative demand management approach also carries economic costs that compound over time. Cutting aluminum or steel output during a supply shock is tolerable for weeks. Sustained output reductions damage trade relationships, create delivery failures on international contracts, and impose real economic costs on the downstream industries that depend on those materials. At some point, the cost of demand suppression exceeds the cost of simply paying higher oil prices.
The most durable consequence of the crisis is not what China did in the short term — it is what it is now doing structurally. Long-term supply agreements with non-Gulf producers, accelerated domestic refinery investment, expanded strategic reserve capacity, and intensified electric vehicle and renewable energy adoption are all being fast-tracked as direct lessons of the 2026 disruption. Those investments will reduce China’s Hormuz dependency over a five-to-ten-year horizon — permanently altering the geopolitical leverage that control of the Strait confers.
What This Means for Global Oil Prices
The two-sided implication for global energy markets is stark. In the near term, as the Hormuz deal is implemented and Chinese reserve releases wind down, the physical oil market will need to find a new equilibrium without Beijing’s suppressive effect. The natural clearing price — in the absence of further disruption — is likely in the $75–90 Brent range, reflecting OPEC-plus production discipline, recovering non-Gulf supply, and the partial demand destruction caused by the price spike.
In the medium term, China’s structural shift away from Gulf dependency represents a secular demand reduction for Hormuz-routed barrels. That reduction, distributed across a five-to-ten year transition, is manageable for Gulf producers who can reroute via pipeline (Saudi Arabia, UAE) but is structurally damaging for those who cannot (Iraq, Kuwait, Qatar).
For energy investors, the China oil story of 2026 offers a counterintuitive insight: the country that was most exposed to the supply disruption also proved to be the most effective damper on the price shock. That capability will not disappear — but it will not be unlimited either. The next disruption will test reserves and administrative levers that are now partially depleted, and the price response, when it comes, may be harder to contain.
Discover more from The Economy
Subscribe to get the latest posts sent to your email.
Analysis
U.S. Inflation at a Three-Year High: How the Iran War Turned an Economic Recovery Into a Stagflation Risk
U.S. inflation hit 4.2% in May 2026 — its highest since April 2023 — driven by an oil price surge linked to the U.S.-Iran conflict and the Strait of Hormuz closure. Here’s what it means for households, the Fed, and economic growth.
Key Takeaways
- U.S. CPI rose 4.2% year-on-year in May 2026, the highest reading since April 2023
- Core CPI (ex-food and energy) is more contained at 2.9%, limiting but not eliminating the Fed’s concern
- WTI crude rose from ~$57/barrel in January to a peak of $113 in April — nearly doubling in three months
- The Federal Reserve has revised its 2026 PCE inflation forecast up sharply, from 2.7% to 3.6%
- The risk of second-round inflationary effects — where energy costs embed into the broader price level — is Citigroup’s primary concern
From Recovery to Renewed Pressure
Entering 2026, the U.S. economic outlook appeared broadly constructive. Inflation had trended down from post-pandemic peaks; the Federal Reserve had delivered three successive quarter-point rate cuts in the final months of 2025; the labour market, while cooling, remained healthy; and consumer spending was proving more resilient than many forecasters expected.
Then, in late February 2026, the United States and Israel launched military operations against Iran, and the macroeconomic calculus changed almost overnight.
The Consumer Price Index rose 4.2% year-on-year in May 2026 — the highest annual reading since April 2023, and a dramatic reversal of the disinflationary trajectory that had defined 2024 and most of 2025 (CBS News, June 2026). The Federal Reserve revised its headline PCE inflation forecast for 2026 up from 2.7% to 3.6% at the June FOMC meeting — a 90-basis-point upward revision in a single quarter, the most aggressive single-meeting inflation reassessment in years (Fox Business, June 17, 2026).
The Oil Price Channel: From $57 to $113
The transmission mechanism is straightforward. Iran’s declaration that the Strait of Hormuz was “closed” on March 4, 2026 — through which approximately 27% of globally traded crude flows — created an immediate and severe supply shock. West Texas Intermediate crude futures rose from approximately $57 per barrel at the start of the year to a peak of $113 in April (U.S. Bank Asset Management, June 2026).
At the pump, the consequences were immediate. U.S. gasoline prices track crude oil prices closely, with a lag of several weeks. By the time WTI peaked in April, American consumers were paying materially more to fill their tanks, heat their homes, and power their businesses. Energy is both a direct component of the CPI and an indirect input cost for virtually every sector of the economy — transportation, manufacturing, agriculture, and retail alike.
The energy shock was the primary driver behind the May CPI reading. Core inflation — which strips out volatile food and energy prices and is the Fed’s preferred gauge of underlying price dynamics — came in at a more contained 2.9% (NPR, June 17, 2026). That 130-basis-point gap between headline and core is the central interpretive challenge facing policymakers: it suggests the inflation is mostly a supply shock rather than a demand-driven phenomenon — but that is cold comfort when households are paying 4.2% more for their consumption basket than they were a year ago.
The Second-Round Effect: The Slow Spread
The more dangerous scenario, from a monetary policy perspective, is not the initial energy price spike — it is what economists call second-round effects. These occur when energy cost increases flow into the prices of non-energy goods and services through transportation costs, higher manufacturing input costs, and wage demands that workers make in response to a higher cost of living.
Citigroup flagged this risk in a late-May research note, warning that the prolonged run-up in crude prices was already beginning to spill into broader inflation pressures, with second-round effects becoming visible in sectors where energy costs are a significant input — logistics, food processing, and industrial manufacturing in particular (CNBC, May 28, 2026). Once second-round effects are embedded in the wage-price dynamic, the supply-shock origin becomes irrelevant: the inflation is self-sustaining regardless of what happens to oil.
This mechanism is why the Federal Reserve — which under normal doctrine would look through a supply-driven energy shock — has moved to a hawkish posture despite the conflict being the source of price pressure. Nine of 18 FOMC members now project a rate hike before year-end 2026 (Fox Business). The committee has explicitly raised its inflation outlook and removed its easing-biased forward guidance. That is not the behaviour of a central bank confident it can look through an energy spike.
Labour Market Complexity
What makes this inflation episode particularly difficult to manage is the backdrop of a surprisingly resilient labour market. U.S. employers added an average of 188,000 jobs per month over the three months to May, and the unemployment rate has held steady at 4.3% for a full year — a remarkably stable number given the geopolitical disruption (CNBC, June 17, 2026).
In a conventional supply-shock inflation scenario, one would expect the real income compression caused by higher energy prices to dampen consumer spending and slow growth — effectively doing the Fed’s tightening work for it. That has not clearly happened yet. Consumer spending has remained resilient, supported by a tight labour market, lower income and corporate taxes enacted earlier in the Trump administration, and fiscal tailwinds from government spending programmes.
The combination of elevated inflation and a still-strong labour market is, in monetary policy terms, the worst of all worlds for a central bank trying to justify patience. It removes the “growth is already slowing” argument that would otherwise support a hold-and-wait posture. The hawks within the FOMC have a clean case: prices are too high, jobs are plenty, and there is no compelling reason to leave rates where they are.
How American Households Are Feeling It
Behind the statistics is a lived economic reality for American households. Inflation has now been running above the Fed’s 2% target for five consecutive years (Fox Business). The compounding effect of sustained above-target inflation on real purchasing power is substantial: a household that was earning $75,000 in 2021 needs approximately $89,000 in 2026 to maintain the same standard of living, even before accounting for the latest energy-driven spike.
The political consequences are significant. Inflation is historically the most potent economic grievance among voters. An inflation reading of 4.2% — after a period when the public narrative had shifted to “inflation is under control” — represents a reputational setback for the administration and a genuine hardship for lower- and middle-income households, who spend a disproportionate share of their income on energy and food.
SNAP benefit restrictions — under active congressional consideration — would compound the impact on the most vulnerable households. Food companies and grocery chains are watching the policy debate closely, as changes to SNAP purchasing rules could meaningfully alter demand patterns for staple goods (CNBC, June 20, 2026).
The Path Forward
The good news — and it is significant — is that the primary driver of the inflation surge is now partially reversing. Brent crude has retreated from its April peak of approximately $113 to approximately $78 by mid-June, as the U.S.-Iran peace framework reduces near-term supply disruption fears (Al Jazeera, June 17, 2026). If Brent settles in the $70–80 range and the Strait reopening is durable, the energy component of CPI should provide disinflationary relief in the June, July, and August prints.
The lagged second-round effects will take longer to unwind. Wage growth that has been pulled higher by workers’ cost-of-living concerns does not retreat immediately when pump prices fall. Transportation costs embedded in goods pricing take months to work out of supply chain contracts. Services inflation — already running hot before the conflict — has limited sensitivity to oil prices in either direction.
The base case, shared by most economists surveyed ahead of the June FOMC meeting, is that inflation moderates back toward 3% by year-end as energy effects dissipate — but that the Fed holds rates steady at best, and hikes once at worst. The stagflationary risk — where growth slows meaningfully while inflation remains above target — is not the central scenario but is no longer a tail risk.
Discover more from The Economy
Subscribe to get the latest posts sent to your email.
IPO
IPO Summer 2026: Anthropic, OpenAI, and the Race to Price Artificial Intelligence on Public Markets

With SpaceX now public, Anthropic has confidentially filed at a ~$965 billion valuation and OpenAI follows at $852 billion. We break down what their IPOs mean for public markets, AI competition, and investors.
Key Takeaways
- Anthropic confidentially filed its S-1 with the SEC on June 1, 2026; OpenAI followed on June 8
- Anthropic’s latest funding values it at approximately $965 billion; OpenAI targets a $852 billion debut valuation
- Anthropic’s annualised revenue run rate crossed $44–47 billion in May 2026, growing at roughly 10x per year
- Both Goldman Sachs and Morgan Stanley are bookrunning both deals, each expected to raise at least $60 billion
- Together with SpaceX, the three mega-IPOs could demand north of $200 billion from public markets in 2026
The Year Public Markets Had to Price AGI
SpaceX’s June 12 debut was historic. But in the longer narrative arc of 2026, it may prove to be the prelude. With Elon Musk’s rocket company now trading on the Nasdaq and raising $85.7 billion in the largest IPO in history, Wall Street’s attention has pivoted immediately to the next act: Anthropic and OpenAI, the two companies whose products are reshaping global knowledge work, coding, legal services, healthcare, and finance — and whose valuations are asking public markets to price something it has never priced before: the plausible path to artificial general intelligence.
The sequence is moving fast. Anthropic confidentially filed its S-1 with the SEC on June 1, 2026, the company confirmed in a blog post that day (Fortune, June 1, 2026). OpenAI followed exactly one week later, on June 8, announcing its own filing rather than allowing it to leak — a signal from Sam Altman’s team that they intend to control the IPO narrative (FutureSearch, June 2026). Both are bookrun by the same dual-bank syndicate: Goldman Sachs and Morgan Stanley, each expected to raise at least $60 billion (FutureSearch).
Anthropic: The Quiet Frontrunner
Twelve months ago, Anthropic was universally described as OpenAI’s challenger. Today, by several key metrics, it has pulled ahead. The company’s annualised revenue run rate crossed $44–47 billion in May 2026, compounding at approximately 10x per year — a growth rate that makes OpenAI’s roughly 3.4x annualised growth look almost conventional by comparison (IndMoney, June 2026; BitMEX).
Anthropic raised $30 billion in a Series G round in February 2026 at a $380 billion post-money valuation, before a $65 billion Series H-1 round in May pushed the private valuation to approximately $965 billion — eclipsing OpenAI’s valuation for the first time (Fortune, June 2026). The company is also on track to post its first-ever operating profit in Q2 2026, projecting approximately $559 million on $10.9 billion in quarterly revenue (IndMoney).
The enterprise thesis is central to Anthropic’s public market story. Approximately 80% of revenue comes from enterprise customers, and Anthropic’s share of the enterprise AI market surpassed OpenAI’s for the first time in April 2026, driven by Claude’s dominance in agentic coding workflows, legal research, and financial analysis (IG UK, June 2026). Anthropic has told investors its annualised run rate will surpass $50 billion by July, and has projected $70 billion in revenue with $17 billion in free cash flow by 2028 (IG UK).
The risks are real. A $5.6 billion net loss in 2024 and a 2028 cash-flow profitability target — rather than an immediate one — mean investors must take a long-dated view. The company is also embroiled in a legal dispute with the U.S. government after the Pentagon designated it a supply-chain risk, a designation Anthropic argues could jeopardise billions in revenue (Fortune). Additionally, a June 12 regulatory action suspending the “Claude Fable” model export has widened the tail risk on Anthropic’s IPO timeline, pushing the p10 downside date out to April 2028 in some analyst models (FutureSearch).
The consensus target date for Anthropic’s listing is December 2026, with a first-day market cap median of approximately $1.10 trillion — which would make it the first pure-enterprise AI safety company to trade publicly, and one of the most valuable companies ever to debut (FutureSearch).
OpenAI: Bigger by Brand, Smaller by Growth Rate
OpenAI carries extraordinary brand recognition — ChatGPT crossed 900 million weekly active users by early 2026 — and its revenue trajectory, while slower than Anthropic’s in percentage terms, is still formidable in absolute terms: revenues grew from approximately $2 billion annualised in 2023 to over $20 billion by end-2025 (IndMoney).
But the loss picture gives public investors pause. FutureSearch estimates OpenAI’s 2026 GAAP net loss at $25–26 billion against a widely cited $14 billion non-GAAP figure — a gap that reflects the difference between the story management is telling on the roadshow and the financial reality a public company must disclose in quarterly filings (FutureSearch). The 90-day post-IPO market cap estimate of $0.86 trillion — materially below the first-day median — reflects the prediction that institutional models, once they have time to fully digest the loss line, will price more conservatively than day-one narrative demand.
OpenAI’s $852 billion debut valuation target positions it slightly below Anthropic’s pre-IPO mark (Fortune, June 2026). The later it lists, the more revenue compounds under the number — meaning OpenAI has a structural incentive to maximise quality of disclosure ahead of its September target rather than rush to beat Anthropic to market.
The Capital Markets Challenge: Can the System Absorb It?
The scale of capital being demanded is genuinely unprecedented. SpaceX alone raised $85.7 billion. Anthropic and OpenAI are each expected to raise at least $60 billion. Total 2026 U.S. IPO proceeds could reach approximately $160 billion, according to Goldman Sachs projections — against a 2025 baseline of $45 billion (IndMoney).
The liquidity case is that there is an estimated $8 trillion sitting in U.S. money market funds. SpaceX’s $85.7 billion raise represents roughly 1% of that pool. Institutional investors who have spent years gaining AI exposure indirectly — via Nvidia for chips, Microsoft for its OpenAI stake, Alphabet for its Anthropic investment — now have the option of owning the underlying models directly. The pent-up demand for pure-play AI exposure is enormous.
The displacement risk is subtler but real. Money rotating into SpaceX, Anthropic, and OpenAI must come from somewhere — and that somewhere is likely existing Magnificent 7 positions or cash allocations that would otherwise flow into other sectors (IndMoney). The portfolio rebalancing triggered by three mega-listings could create meaningful headwinds for established large-cap tech stocks in the second half of 2026.
The Race to First-Mover Advantage
Anthropic’s decision to file first was strategically deliberate. By going to market ahead of OpenAI, the company avoids being overshadowed by its more famous rival and benefits from scarcity — institutional investors who buy Anthropic have less capital available for OpenAI when it comes. OpenAI, meanwhile, gains a tactical advantage from watching how the market prices audited frontier AI financials before committing to its own price.
It is worth noting, as IG UK observes, that both companies filed within days of each other despite being direct competitors — suggesting that both management teams made independent calculations that the post-SpaceX IPO window represents an optimal moment for AI listings, when investor appetite for frontier technology is at a verifiable high and the SpaceX roadshow has done the work of educating institutional allocators on how to think about pre-profitability, mission-driven, deeply moated technology businesses (IG UK).
2026: The Year That Changes Public Markets Forever
If SpaceX, Anthropic, and OpenAI all complete their listings before year-end, 2026 will be remembered as the year public markets were forced to price artificial general intelligence for the first time. Their combined target valuations of approximately $3.6 trillion equal the GDP of France — and they are not asking investors to value what they earn today, but what humanity becomes tomorrow (IndMoney).
That is a proposition without precedent in the history of capital markets. Whether public markets accept it enthusiastically, price it conservatively, or — as some veteran investors warn — create the conditions for a correction of historic proportions when the gap between narrative and quarterly earnings becomes undeniable, is the central investment question of 2026.
Discover more from The Economy
Subscribe to get the latest posts sent to your email.

Goldman Sachs: “The Circulatory System Is Not Working”

Why the U.S. Budget Airline Model Is Running Out of Runway

China’s Oil Shock Absorber: How Beijing Kept Crude Prices Half of What Analysts Predicted

CRH Nears Biggest-Ever Deal to Acquire Arcosa

U.S. Inflation at a Three-Year High: How the Iran War Turned an Economic Recovery Into a Stagflation Risk

IPO Summer 2026: Anthropic, OpenAI, and the Race to Price Artificial Intelligence on Public Markets

Strait of Hormuz Crisis 2026: How a Waterway War Broke Global Oil Markets

Kevin Warsh’s Fed Debut: Rate Hikes Now on the Table as U.S. Monetary Policy Enters a New Era

SpaceX IPO 2026: Inside the $85.7 Billion Listing That Made Elon Musk the World’s First Trillionaire

PSX KSE-100 Up 500+ Points: The Geopolitical Impact on Stocks

Did Anthropic Talk Its Way Into an AI Export Ban?

Big Bonuses for South Korea’s Chip Workers Put Central Bank on Inflation Alert

Easing Iran Tensions Push Mortgage Rates Lower — But a Potential Fed Hike Clouds the Outlook

Paramount’s $111 Billion Warner Bros. Discovery Merger Clears DOJ, But Faces New Hurdles

China Overhauls the World’s Biggest Surveillance Network with Advanced AI

How AI Is Forcing McKinsey and Its Peers to Rethink Pricing

SpaceX IPO: Inside the $2 Trillion Market Debut

KPMG Australia CEO Resigns After Whistleblower Claims Exposed Investigation Failures

PwC China Partner Payouts Cut Amid Evergrande Audit Fraud

Broadcom Market Value Loss: Revenue Forecast Disappoints

The Guardrails Are Down: How Meta and Google’s AI Models Fold Under Pressure

Pakistan Budget FY 2026-27: Relief, Prospects, and the Tightrope Walk

Benefitbay Raises $18M to Build the Plumbing for America’s ICHRA Shift

Nasdaq Tumbles 4% as Chip and Memory Stocks Sink: A $1.2 Trillion Wipeout

Here’s How Much It’ll Cost You to Be Part of SpaceX’s Record-Breaking $75 Billion IPO

Japanese Mid-Sized Firms Flock to Southeast Asia for Growth

Southeast Asia Energy Shock: Economies Struggle to Cope

Singapore Puts a Clock on Wealth: MAS Orders Banks to Halve Account-Opening Times
-

 Markets & Finance6 months ago
Top 15 Stocks for Investment in 2026 in PSX: Your Complete Guide to Pakistan’s Best Investment Opportunities
-

 Analysis4 months ago
Top 10 Stocks for Investment in PSX for Quick Returns in 2026
-

 Analysis5 months ago
Brazil’s Rare Earth Race: US, EU, and China Compete for Critical Minerals as Tensions Rise
-

 Analysis4 months ago
Johor’s Investment Boom: The Hidden Costs Behind Malaysia’s Most Ambitious Economic Surge
-

 Banks5 months ago
Best Investments in Pakistan 2026: Top 10 Low-Price Shares and Long-Term Picks for the PSX
-

 Investment5 months ago
Top 10 Mutual Fund Managers in Pakistan for Investment in 2026: A Comprehensive Guide for Optimal Returns
-

 Global Economy6 months ago
15 Most Lucrative Sectors for Investment in Pakistan: A 2025 Data-Driven Analysis
-

 Global Economy6 months ago
Pakistan’s Export Goldmine: 10 Game-Changing Markets Where Pakistani Businesses Are Winning Big in 2025