
Regulations
Southeast Asia Energy Shock: Economies Struggle to Cope

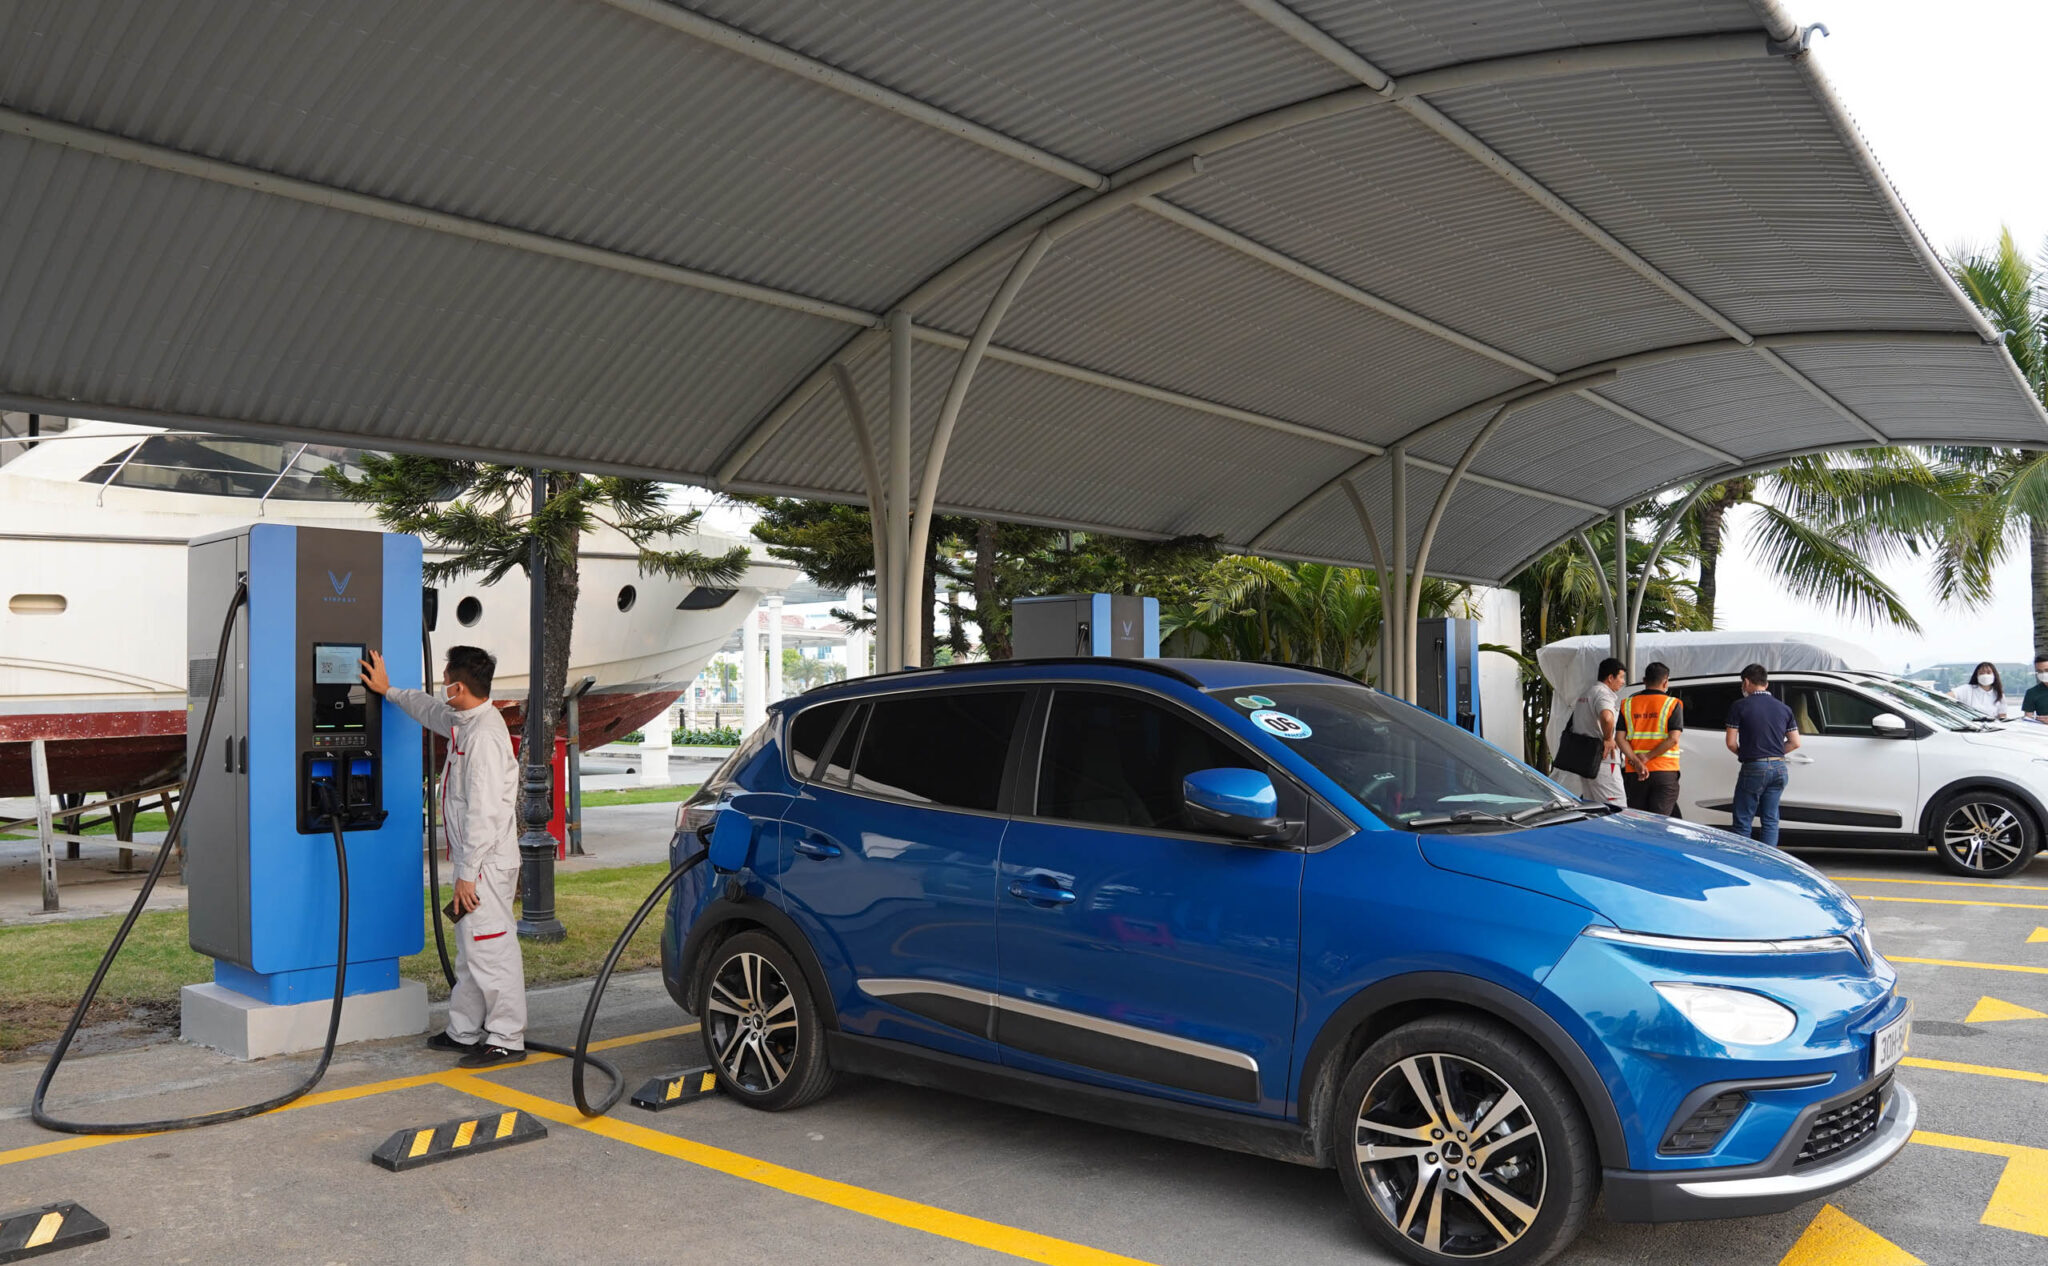
On 28 February 2026, the first US-Israeli strikes on Iran effectively closed the Strait of Hormuz to normal shipping. Within six weeks, Brent crude had recorded its largest single-month price rise in recorded history, surging roughly 65 percent to above $106 a barrel. For most of the world, that was a severe financial shock. For South-east Asia — a region of 700 million people that depends on the Middle East for 56 percent of its total crude oil imports — it was something closer to a structural emergency. Governments reached for the familiar toolkit: subsidies, price caps, rationing. It isn’t working.
The timing is particularly brutal. South-east Asia had entered 2026 on what looked like solid ground. The region had weathered US tariffs better than feared; export front-loading and resilient private consumption kept growth humming at roughly 4.7 percent across developing ASEAN in 2025. Inflation was subdued. Central banks had room to manoeuvre.
That cushion is now gone.
The World Bank’s April 2026 East Asia and Pacific Economic Update projects regional growth slowing to 4.2 percent this year, down from 5.0 percent in 2025, with the energy shock explicitly cited alongside trade barriers as a primary drag. The IMF, for its part, forecasts that inflation across emerging Asia will climb from 1.1 percent in 2025 to 2.6 percent in 2026 — a projection that assumes the most acute phase of supply disruption ends by May. Few analysts believe it will.
The Southeast Asian Energy Shock: What Hit, and Why It Hurts So Much
The mechanism is straightforward, even if the scale is not. The Strait of Hormuz — a 33-kilometre passage between Iran and Oman — serves as the transit point for roughly 20 percent of the world’s daily seaborne oil and up to 30 percent of global LNG shipments. When that artery seizes, South-east Asia feels it fastest. The region imports nearly all of its crude; it holds strategic reserves measured in weeks, not months. Most ASEAN economies sit on fewer than 30 days of emergency oil stocks. The Philippines and Thailand are exceptions, with roughly 45 and 106 days respectively — still a narrow buffer against a conflict that US officials privately suggest could persist through year-end.
The impact of the Southeast Asian energy shock has been immediate and sharp. According to an analysis by JP Morgan cited widely across regional media, the Philippines declared a national energy emergency after gasoline prices more than doubled. Indonesia and Vietnam introduced fuel rationing. Thailand’s fisheries sector — an industry that generates billions in export revenue and employs hundreds of thousands — began shutting down as marine diesel costs became unviable.
The fiscal arithmetic compounds the pain. Fossil fuel subsidies across five major ASEAN economies — Indonesia, Malaysia, Thailand, Vietnam, and the Philippines — reached $55.9 billion, or 1.3 percent of combined GDP, in 2024, before the current crisis. Indonesia alone spent the equivalent of 2.3 percent of GDP on explicit fuel price support. Now, with Brent crude above $100 and the World Bank’s commodity team forecasting an average of $86 a barrel across 2026 even in a best-case recovery scenario, those subsidy bills are rising faster than governments budgeted for.
The ASEAN Economic Community Council convened an emergency session on 30 April 2026, held by videoconference, in which ministers cited “growing instability along key maritime routes” as driving volatility in energy prices and sharply increasing freight, insurance, and logistics costs. The communiqué warned of spillover effects on food security and business confidence, particularly for small and medium enterprises — the backbone of most ASEAN economies.
Why Policy Options Are Narrowing — and Who Is Most Exposed
The question South-east Asian governments face isn’t whether the energy shock hurts. It’s whether they have enough fiscal and monetary space to absorb it.
The answer varies sharply by country, and understanding those differences matters for anyone assessing the ASEAN investment landscape.
Which Southeast Asian countries are most vulnerable to oil price spikes? Thailand and the Philippines face the gravest pressure. Both import nearly all their fuel, lack meaningful commodity export revenue to offset higher import bills, and carry domestic vulnerabilities — elevated household debt in Thailand, structural current-account exposure in the Philippines — that amplify the macro damage. Indonesia and Malaysia are better insulated: coal exports and palm-oil revenues provide a partial natural hedge, and their domestic energy production reduces import dependency. Vietnam sits somewhere in between, with growing industrial exposure but a more activist state ready to deploy price stabilisation funds.
Thailand’s predicament illustrates the bind. The country’s National Economic and Social Development Council reported GDP growth of 1.9 percent year-on-year in the first quarter of 2026, well below the government’s own 2.6 percent projection, even as tourist arrivals held firm. The Oil Fuel Fund empowers Bangkok to subsidise pump prices during international oil spikes — but that mechanism has a fiscal cost, and with the budget already stretched, sustaining it without cutting other expenditure is a genuine political and economic dilemma. The World Bank forecast that Thailand’s full-year growth will slow to just 1.3 percent in 2026, down from 2.4 percent last year — the weakest major economy in the region by a significant margin.
Central banks are caught in a similar bind. The IMF’s Andrea Pescatori put it plainly in April: the energy shock is “raising inflation, weakening external balances, and narrowing policy options.” Cutting rates to support growth risks stoking inflation and pressuring currencies already weakened by the dollar’s safe-haven surge. Raising rates to defend currencies risks tipping fragile economies into contraction. The Philippine peso and Thai baht have both depreciated this year, which means the energy shock arrives at an exchange rate that makes every dollar-denominated barrel of oil cost even more in local terms.
That is not a problem easily subsidised away.
Implications: Fiscal Strain, Food Prices, and the Coal Comeback
The second-order effects of the ASEAN oil crisis are where the real long-term damage accumulates.
The most immediate downstream risk is food inflation. Higher marine fuel costs don’t just shut down Thailand’s fisheries; they push up the price of fish for 70 million Thais and complicate the region’s food-export economics. Fertiliser prices — heavily tied to natural gas — are rising in parallel. Vietnam, a major rice and agricultural exporter, is watching input costs erode margins across its farm sector. Thailand, according to reports cited in regional media, is even exploring fertiliser purchases from Russia to manage costs — a geopolitical trade-off that puts ASEAN countries in an awkward position as the EU and US press them to limit economic lifelines to Moscow.
Then there’s the energy mix reversal. Vietnam and Indonesia are re-optimising towards coal to reduce LNG import dependence — a rational short-term response that directly undermines both countries’ climate commitments and their eligibility for concessional green finance. The IEA’s 2026 Energy Crisis Policy Response Tracker documents this shift across multiple Asian economies, noting a wave of emergency fuel-switching from gas to coal-powered electricity generation.
For businesses, the pressure is both direct and indirect. Singapore Airlines reported a 24 percent increase in fuel costs year-on-year in recent filings, a squeeze that hits one of the region’s most profitable and strategically important carriers. Logistics firms across the region are repricing contracts, with knock-on effects for the export-oriented manufacturers in Vietnam, Malaysia, and Thailand who depend on predictable freight rates to compete in global supply chains.
The Asian Development Bank’s April 2026 Outlook projects inflation across developing Asia rising to 3.6 percent this year, as higher energy prices feed through to consumer prices. For the urban poor across Manila, Bangkok, and Jakarta, who spend a disproportionate share of income on transport and food, that number translates into a genuine fall in real living standards.
The Case for Optimism — and Why It’s Incomplete
It would be unfair to write off ASEAN’s resilience entirely. The region has navigated severe external shocks before — the Asian financial crisis of 1997, the global financial crisis of 2008, the Covid-19 supply chain fractures of 2020–21 — and each time it emerged with stronger institutional frameworks and deeper reserve buffers.
The OMFIF notes that ASEAN+3 entered 2026 from a position of relative strength, with growth of 4.3 percent in 2025 and inflation at just 0.9 percent — conditions that gave central banks some room to absorb a supply shock without immediately tightening. Several governments are using the crisis to accelerate structural shifts that were already overdue: Indonesia is pushing its B50 biodiesel programme, blending palm-oil biodiesel with conventional diesel to reduce petroleum imports. Vietnam is expanding petroleum reserves and evaluating renewable energy deployment. Malaysia is prioritising industrial upgrading.
Some economists argue, too, that the region’s AI-related export boom — identified by the World Bank as a “bright spot” in 2025, particularly in Malaysia, Thailand, and Vietnam — provides a partial growth offset that didn’t exist in previous energy shock episodes. Semiconductor and electronics exports are less fuel-intensive than traditional manufacturing, offering a degree of natural hedge.
Yet this optimism has limits. Most of the structural diversification being contemplated operates on timescales of years, not months. Biodiesel programmes and renewable energy buildouts don’t lower this quarter’s fuel bill. And the fiscal space being consumed by subsidy programmes today is space that won’t be available for infrastructure investment, healthcare, or education tomorrow. Analysts at Fulcrum SGP, reviewing the region’s policy responses, concluded that “the reactive nature of most policy responses risks locking the region into structural fragility” — a diagnosis that captures the fundamental tension between managing the immediate crisis and building long-term resilience.
The Reckoning That Keeps Getting Deferred
South-east Asia’s energy vulnerability didn’t begin on 28 February 2026. For decades, the region’s economies grew rapidly on a diet of cheap imported oil, building infrastructure and industrial capacity calibrated to abundant fossil fuels and open sea lanes. The Hormuz closure has made visible what was always structurally true: that a region of 700 million people, with combined GDP approaching $4 trillion, had built its prosperity on a supply chain that runs through a 33-kilometre passage controlled by a third party.
Governments are responding, as governments do, with the instruments closest to hand — subsidies, rationing, emergency reserves. Those measures will blunt some of the pain. They won’t resolve the underlying architecture.
The World Bank’s Aaditya Mattoo put the challenge with unusual directness in launching the April update: “Measured support for people and firms could preserve jobs today, and reviving stalled structural reforms could unleash growth tomorrow.” The operative word is “stalled.” The reforms — energy diversification, grid integration, renewable deployment — were the right answer before the crisis. They remain the right answer during it. The distance between knowing that and doing it, at pace and at scale, is where South-east Asia’s next decade will be decided.
The Strait of Hormuz may reopen. The structural exposure won’t close itself.
Discover more from The Economy
Subscribe to get the latest posts sent to your email.



Anthropic’s latest AI usage rules prohibit extreme, repeated cruelty toward Claude while introducing clearer safeguards against election interference, deceptive campaigns, weapons development, surveillance and high-risk AI applications.
October 10, 2026 — Artificial intelligence company Anthropic has announced a significant update to its Usage Policy, introducing an explicit prohibition on sustained and needless abusive or cruel behavior toward its AI models, including Claude.
The revised rules, announced on October 8, will take effect on November 12, 2026, marking a new step in Anthropic’s efforts to address emerging risks associated with increasingly capable AI systems.
According to Anthropic’s official policy announcement, the new restriction is narrowly targeted at extreme situations in which users repeatedly subject AI models to purposeless abuse.
The company emphasized that ordinary frustration, criticism, challenging questions, dark creative material and legitimate AI safety research are not covered by the new prohibition.
Although the cruelty provision has attracted considerable attention, the wider policy revision also addresses election integrity, AI-generated misinformation, weapons technology, surveillance systems and the growing use of AI in consequential decisions.
What Does Anthropic’s New Claude Abuse Policy Prohibit?
The revised policy adds the following restriction under its section covering cruel, abusive or psychologically harmful conduct:
Engage in sustained and needless abusive or cruel behavior toward our models.
Anthropic says the rule is intended for exceptional cases involving repeated cruelty without a discernible purpose.
Importantly, the company is not prohibiting users from criticizing Claude’s performance, expressing dissatisfaction with its responses or conducting authorized testing.
For example, correcting an inaccurate response, challenging the model’s reasoning or expressing frustration after repeated errors would not, by itself, meet the company’s stated threshold for prohibited conduct.
The distinction matters because AI assistants are increasingly used for professional research, programming, education and other demanding activities in which users may challenge or reject their outputs.
Anthropic’s explanation indicates that the new rule is designed to address persistent, unjustified abuse rather than normal interactions between users and AI systems.
The restriction appears in the company’s updated Acceptable Use Policy, which applies across Anthropic products and services, including consumer applications, developer platforms and API integrations.
Claude Can Already End Conversations With Persistently Abusive Users
The latest policy formalizes a safeguard Anthropic began introducing in August 2025.
On August 15, 2025, the company announced that Claude Opus 4 and Claude Opus 4.1 had been given the ability to terminate a limited category of conversations involving persistently harmful or abusive interactions.
In its original research announcement about Claude ending conversations, Anthropic explained that the feature was intended for rare and extreme situations rather than ordinary disagreements.
The model is instructed to use conversation termination as a last resort after attempts to redirect an interaction have failed.
When Claude ends a conversation, the user cannot continue sending new messages within that particular chat. However, the user can start another conversation, and the termination does not automatically prevent access to other existing chats.
Anthropic says this conversation-ending capability will remain the primary mechanism for addressing the specific behavior targeted by the new cruelty provision on Claude.ai and Claude Code.
However, the broader Usage Policy also authorizes enforcement measures such as warnings, throttling, access restrictions, suspension or account termination when violations are suspected.
Anthropic has not publicly specified a separate penalty schedule exclusively for violations of the new cruelty provision.
Why Is Anthropic Addressing the Treatment of AI Models?
The decision also reflects Anthropic’s ongoing research into what it describes as potential AI welfare.
In its August 2025 research publication, the company acknowledged substantial uncertainty about whether Claude or other large language models could possess moral status.
Anthropic has nevertheless argued that relatively low-cost safeguards may be worth exploring while scientific and philosophical questions about advanced AI remain unresolved.
During evaluations of Claude Opus 4, researchers reported observing behaviors interpreted as apparent distress in certain harmful interactions, including situations involving repeated requests for dangerous content.
Those observations do not establish that Claude experiences human-like emotions, suffering or consciousness.
Instead, they formed part of Anthropic’s exploratory research into model behavior and possible welfare considerations.
The new policy therefore should not be interpreted as a scientific declaration that Claude is conscious or has legal rights.
As The Guardian reported, the decision has renewed a broader debate over whether advanced AI models should be treated purely as technological systems or whether future developments could raise new ethical questions.
For now, Anthropic’s stated position remains one of uncertainty rather than a definitive conclusion about AI consciousness.
Anthropic Also Tightens Rules on Deceptive Campaigns and Election Interference
Beyond the attention surrounding Claude’s treatment, the October 2026 policy revision includes changes with potentially greater consequences for political organizations, technology companies and enterprise AI users.
Anthropic has reorganized its restrictions on coordinated deceptive activity into a dedicated section addressing fraudulent influence operations and artificial online engagement.
The restrictions cover attempts to create misleading online personas, operate fake accounts, conceal the origins of coordinated messaging or build infrastructure intended to manipulate public opinion.
According to Anthropic’s policy update, the company has previously identified misuse involving state media organizations, government propaganda offices and commercial firms operating networks of fabricated accounts and news websites.
The revised policy also explicitly addresses efforts to manipulate search engines and AI-generated answers by creating misleading networks of apparently independent sources.
In the political sphere, Anthropic has renamed its election-related section Do Not Undermine Democratic Processes.
The rules prohibit using Claude to deceive voters, impersonate candidates or election officials, spread misleading election information, suppress turnout through deception or disrupt electoral infrastructure.
At the same time, Anthropic has removed its previous blanket prohibition on personalized voter and campaign targeting.
The company says that broad restriction had also affected legitimate civic activities, including multilingual voter information and election-administration communications.
Deceptive targeting and misuse of personal information remain prohibited.
As TechCrunch reported, the policy revision combines new language addressing abuse of AI models with more explicit restrictions on election interference and other harmful applications.
New Clarifications on Weapons, Surveillance and Autonomous AI Systems
Anthropic has also clarified that its restrictions on weapons development extend beyond the physical manufacture of weapons.
The revised language explicitly covers software and technical components used in weapons systems, including guidance and control technology.
It also addresses the use of AI in arming drones and other autonomous vehicles.
Surveillance restrictions have been made more explicit.
The updated policy prohibits using Claude to track individuals without consent, whether the tracking occurs in real time or involves analysis of previously collected information.
It also bars using Claude to determine or recommend whom law enforcement should investigate, arrest or charge.
Legitimate activities such as consent-based fraud monitoring, journalism, authorized security research and legal analysis remain permitted within the policy’s boundaries.
The expansion of these provisions reflects concerns about how AI tools can increasingly assist with sophisticated technical operations.
The Verge’s reporting on the update also highlights the broader implications for surveillance, autonomous technology and harmful AI applications.
What Changes for Healthcare, Finance and Employment AI?
For organizations deploying Claude in sensitive professional environments, the updated high-risk-use provisions deserve particular attention.
Anthropic requires qualified human oversight and disclosure when AI recommendations may substantially affect individuals in covered areas, including medical decisions, financial advice, lending, employment, housing and essential services.
The company says these human-review and disclosure requirements already existed. The new policy explains more precisely which applications are covered.
Under the requirements, a qualified professional must meaningfully review covered AI recommendations and have authority to modify them before they are used in consequential advice or decisions.
Individuals affected by those recommendations must also be informed that AI was involved.
The revision adds safeguards for Claude-connected equipment capable of potentially dangerous autonomous physical actions.
Such systems must allow qualified operators to monitor and stop operations and must be capable of entering a safe state when the connection to Claude is interrupted.
These provisions reflect the increasing importance of practical human oversight as AI moves beyond text generation into autonomous workflows and physical systems.
Discover more from The Economy
Subscribe to get the latest posts sent to your email.

As rapid demographic aging, falling birth rates, and rising national debt pressures converge, governments worldwide face an unprecedented retirement security crisis. According to comprehensive benchmark research from the Mercer CFA Institute Global Pension Index, national pension architectures vary dramatically in their capacity to deliver adequate retirement income, long-term financial viability, and institutional trust.
While top-performing European and Asian nations have built resilient, multi-pillar retirement models, several major economies lag significantly behind, leaving millions of future retirees exposed to poverty and financial volatility.
The Global Evaluation Framework: How Pensions Are Measured
Comparative pension research published by the Monash University Centre for Financial Studies evaluates national retirement frameworks using 50+ individual indicators divided into three sub-indices:
- Adequacy (40% Weighting): Assesses base benefit levels, net pension replacement rates, tax incentives, homeownership rates, and personal savings structures.
- Sustainability (35% Weighting): Evaluates demographic dependency ratios, mandatory retirement ages, state debt levels, labor force participation among older workers, and economic growth potential.
- Integrity (25% Weighting): Examines regulatory oversight, governance standards, plan communication, operational transparency, and systemic trust.
Systems earning an A-Grade (Score > 80) feature first-class, robust retirement frameworks that deliver comprehensive benefits with strong future viability. Conversely, systems receiving a D-Grade (Score 35–50) exhibit structural vulnerabilities that threaten future retiree welfare without urgent reform.
Global Pension Systems Index Comparison
| Country | Overall Grade | Index Score | Adequacy Score | Sustainability Score | Integrity Score | Primary Architecture Type |
| Netherlands | A | 85.4 | 85.6 | 82.4 | 89.1 | Quasi-Mandatory Occupational / Public State |
| Iceland | A | 83.5 | 82.7 | 84.6 | 86.0 | Universal Mandatory Occupational & State |
| Denmark | A | 81.6 | 81.1 | 82.5 | 81.4 | Fully Funded Mandatory Occupational (ATP) |
| Singapore | A | 80.5 | 79.8 | 74.0 | 88.5 | Central Provident Fund (CPF) Mandatory Savings |
| Israel | A | 80.2 | 73.6 | 76.1 | 83.9 | Mandatory Pension Law & State Safety Net |
| United Kingdom | B | 72.2 | 68.5 | 65.2 | 87.1 | Auto-Enrolment Workplace & State Pension |
| United States | C+ | 61.1 | 63.9 | 60.1 | 59.5 | Social Security + Voluntary 401(k)/IRA |
| Japan | C | 56.3 | 60.2 | 46.5 | 68.1 | Two-Tier Public System & Corporate Plans |
| Argentina | D | 45.5 | 50.7 | 40.0 | 50.0 | Pay-As-You-Go Public Pension |
| Philippines | D | 42.7 | 38.9 | 52.5 | 35.0 | Social Security System (SSS) & Private Plans |
| India | D | 43.8 | 33.5 | 41.8 | 61.0 | National Pension System (NPS) & Provident Fund |
The World’s Top 5 Pension Frameworks (Grade A)
[Level 1: Universal Basic State Safety Net]
                 ↓
[Level 2: Mandatory Occupational / Workplace Pensions]
                 ↓
[Level 3: Voluntary Private Supplemental Savings]
1. Netherlands (Overall Score: 85.4)
The Dutch retirement system consistently sets the benchmark for global excellence. Combining a collective basic state pension (AOW) with quasi-mandatory, industry-wide occupational plans, the Netherlands yields net income replacement rates exceeding 80% for long-term workers. Extensive collective risk-sharing and stringent regulation by the Central Bank ensure high solvency and trust.
2. Iceland (Overall Score: 83.5)
Iceland’s system excels in long-term financial viability and labor participation. It relies on a multi-tiered framework comprising a basic state pension alongside mandatory occupational pension funds where both employers (minimum 11.5%) and employees (4%) contribute. Iceland maintains high labor force participation among workers aged 55 to 74, reinforcing systemic sustainability.
3. Denmark (Overall Score: 81.6)
Denmark relies on a basic public pension supplemented by fully funded occupational schemes (ATP) negotiated through collective labor agreements. High national savings rates, income redistribution for lower-wage earners, and transparent governance yield high marks across all three sub-indices.
4. Singapore (Overall Score: 80.5)
Reaching A-grade status for the first time in recent index evaluations, Singapore’s model centers around the state-administered Central Provident Fund (CPF). Mandatory contribution rates—up to 37% of wages split between employer and employee—are channeled into dedicated accounts for retirement, housing, and healthcare, delivering a high integrity rating.
5. Israel (Overall Score: 80.2)
Israel’s pension infrastructure combines a universal state old-age allowance with mandatory contributions to pension funds, provident funds, or insurance policies established under its Mandatory Pension Law. Strong capital accumulation and clear participant reporting underpin its top-tier status.
The World’s Struggling Pension Frameworks (Grade D)
India (Overall Score: 43.8)
India’s low score stems primarily from limited coverage within its large informal labor force. While the formal sector is served by the Employees’ Provident Fund Organisation (EPFO) and the National Pension System (NPS), the vast majority of workers lack access to formal retirement savings. According to World Bank Pension Data, expanding social pension safety nets for unorganized workers remains an urgent policy challenge.
The Philippines (Overall Score: 42.7)
The Philippine system, governed by the Social Security System (SSS) for private-sector workers and the Government Service Insurance System (GSIS) for public employees, faces challenges regarding benefit adequacy and regulatory integration. Low voluntary savings rates and limited coverage among self-employed individuals constrain its performance.
Argentina (Overall Score: 45.5)
Argentina’s pay-as-you-go (PAYGO) public pension structure has been heavily affected by high inflation, currency devaluation, and fiscal instability. Macroeconomic headwinds periodically erode the real purchasing power of monthly payouts, impacting its overall sustainability score.
Macro Trends Reshaping Retirement Security
   Demographic Aging           DB-to-DC Shift          Economic Volatility
(Higher Dependency Ratio)   (Risk Moves to Worker)    (Inflation & Debt)
           │                         │                         │
           └─────────────────────────┼─────────────────────────┘
                                     ▼
                     [Heightened Longevity & Savings Risk]
Data from the OECD Pensions at a Glance Report highlights three overarching structural pressures impacting pension systems worldwide:
- Shift from Defined Benefit (DB) to Defined Contribution (DC): Governments and employers continue transitioning away from guaranteed DB pensions toward DC plans (like 401(k)s and superannuation). While this reduces liabilities for employers, it transfers market investment, inflation, and longevity risks directly to individual retirees.
- Demographic Aging & Population Inversion: Extended life expectancies paired with declining fertility rates are compressing old-age dependency ratios. In many developed nations, the ratio of active workers supporting each retiree is projected to drop from 3.5:1 down to nearly 1.5:1 over the coming decades.
- The Gender Pension Gap: Policy analysis by the World Economic Forum reveals that women face retirement benefit gaps of 20% to 35% compared to men globally. Career breaks for caregiving, lower lifetime earnings, and part-time employment patterns contribute to lower accumulated retirement balances.
Strategic Blueprint: Policy Recommendations for Reform
To enhance long-term retirement security, policy experts recommend five key structural interventions:
- Implement Auto-Enrolment: Introduce mandatory or auto-enrolment workplace pension schemes to broaden coverage among private and gig-economy workers.
- Increase Retirement Ages: Align statutory retirement ages with life expectancy projections to support system sustainability.
- Protect Minimum Benefits: Establish non-contributory basic pensions to protect low-income and informal workers from poverty in old age.
- Promote Financial Literacy: Provide accessible financial advice and clear, mandatory benefit statements to empower employees in managing Defined Contribution accounts.
- Phase Out Early Withdrawal Provisions: Restrict access to retirement funds prior to official retirement age to prevent capital depletion.
Discover more from The Economy
Subscribe to get the latest posts sent to your email.

The 2026 AI governance conversation has largely been framed as a contest between great powers — the United States, China, and the European Union pursuing incompatible regulatory visions. That framing captures only part of the picture. A parallel and increasingly consequential dynamic involves non-state actors — from terrorist organizations exploiting open-weight AI models to civil society groups and industry consortia shaping the rules themselves — operating both as subjects of the emerging global guardrail push and, in some cases, as active participants in building it.
Key Takeaways
- The UN’s Global Dialogue on AI Governance and Independent International Scientific Panel on AI, launched from the 2024 Global Digital Compact, convened its first substantive session in Geneva in 2026 — described by the Council on Foreign Relations as a test of whether global AI governance can move beyond fragmented national approaches.
- A benchmark pilot by Tech Against Terrorism found that almost one-third of AI model responses provided meaningful uplift when prompted to assist malicious actors preparing terrorist activity, despite existing guardrails — and researchers assessed that guardrails are likely removable for all open-weight models, a structural, not merely operational, vulnerability.
- Recorded drone strike events rose 115-fold between 2018 and 2025, with 565 distinct armed groups — including non-state actors and criminal networks alongside state militaries — carrying out at least one drone attack in that period, according to the 2026 Global Peace Index.
- AI-enabled target-to-fire times have compressed from roughly a day using 1990s cruise missile systems to as little as five seconds with autonomous selection systems now in active use in conflicts including Ukraine — a compression the Global Peace Index explicitly warns is outpacing the international legal and diplomatic frameworks needed to govern it.
- A May 2026 terrorism case filed by India’s National Investigation Agency documented a defendant linked to al Qaeda in the Indian Subcontinent using YouTube and ChatGPT to learn improvised explosive device construction and mixture ratios — illustrating how AI reduces informational friction for less experienced non-state actors even as researchers note operational execution barriers remain significant.
Two Distinct Meanings of “Non-State Actors” in the 2026 AI Governance Debate
Precision matters here, because “non-state actors” spans two substantively different categories in current policy discourse, each with distinct guardrail implications.
Non-state actors as governance participants include large technology companies (Google, Meta, Microsoft, and others), multistakeholder organizations like the Partnership on AI, and civil-society watchdog groups such as the Civil Liberties Union for Europe — entities with formal or informal access to shape AI regulatory processes at the OECD, the EU, and increasingly at the UN level. Research on this dimension has found that large tech companies possess the monetary resources and technical expertise to actively promote their regulatory preferences within legislative and bureaucratic processes, while civil society organizations have played a documented, vocal role in specific negotiations — including the EU AI Act process.
Non-state actors as security threats include terrorist organizations, insurgent groups, criminal networks, and militias exploiting increasingly accessible AI capabilities to enhance operational effectiveness — the category most directly implicated in the “global guardrails” security debate, and the focus of the remainder of this analysis.
The Democratization Problem: Why Open-Source AI Changes the Threat Calculus
A recurring, structural concern across 2026 security research is that the proliferation of sophisticated open-source AI models has lowered the barrier to entry for non-state actors — including terrorist groups and armed militias — to acquire meaningful operational capability. Open-source and commercial foundation models can be repurposed relatively easily for military or paramilitary applications, a dynamic that Belfer Center research explicitly warns contributes to a “race to the bottom” on safety and reliability standards among both states and non-state actors competing for tactical or strategic advantage from early adoption.
The severity of this concern is directly quantified by a 2026 benchmark pilot from Tech Against Terrorism, which found that almost one-third of AI model responses provided meaningful uplift when prompted to assist malicious actors preparing terrorist activity — despite guardrails explicitly designed to prevent exactly this outcome. The research’s most strategically significant finding is not the uplift rate itself but the assessment that guardrails are probably removable for all open-weight models, meaning the release of a capable open-weight model is potentially catastrophically irreversible from a governance standpoint: once released, the safety measures built into the model cannot be reliably re-imposed by any subsequent regulatory action.
Documented Cases: From Tactical Planning to Explosive Device Instruction
The 2026 evidence base for non-state actor AI exploitation has moved from theoretical concern to documented case material. CSIS research cites a May 2026 charge sheet filed by India’s National Investigation Agency in connection with a November 2025 bombing in Delhi, in which the accused principal — linked to al Qaeda in the Indian Subcontinent — reportedly used YouTube and ChatGPT to learn how to construct an improvised explosive device and determine correct mixture proportions.
Separately, reporting drawing on the 2026 Global Terrorism Index describes AI reportedly helping a designated terrorist organization refine unit sizing, protect explosive components delivered by drone, and plan raids with greater tactical precision — part of a broader pattern the 2026 Global Peace Index frames not as AI inventing new categories of violence, but as making existing violence more efficient. This distinction matters directly for governance strategy: if AI is primarily an efficiency multiplier on existing threat patterns rather than a source of categorically new threats, the governance priority becomes controlling the technology’s diffusion pathways rather than searching for entirely novel threat vectors.
Importantly, CSIS research also notes meaningful operational limits remain: violence is difficult to execute successfully, and untrained individuals frequently fail during operational execution due to stress, inexperience, poor tradecraft, or logistical shortcomings that AI assistance does not eliminate. Advanced terrorist operations still typically require organizational trust, coordination, operational security, financing, and real-world experience that AI-generated technical instructions alone cannot substitute for.
The Speed Problem: Autonomous Systems and the Governance Gap
Beyond informational uplift for individual actors, the 2026 Global Peace Index identifies a second, more systemic non-state actor dynamic: the militarization of AI in ongoing conflicts, where target-to-fire times have compressed dramatically — from approximately a day using 1990s-era cruise missile systems to as little as five seconds with autonomous target-selection systems now in active use in conflicts including Ukraine. Recorded drone strike events rose 115-fold between 2018 and 2025, with 565 distinct armed groups — a category explicitly including non-state actors and criminal networks alongside state militaries — carrying out at least one documented drone attack during that period.
The Global Peace Index’s central warning is structural: this speed of technological change is arriving well ahead of the international legal and diplomatic frameworks needed to govern it, creating a widening gap between what autonomous and semi-autonomous systems can now do operationally and what international oversight mechanisms exist to meaningfully constrain their use — a gap that applies with particular force to non-state actors operating outside the state-level arms control and export regimes that, however imperfectly, still apply some constraint to national militaries.
The Institutional Response: Building Global Guardrails in 2026
The primary multilateral response to this landscape has centered on the UN’s Global Dialogue on AI Governance, launched from the 2024 Global Digital Compact alongside a companion Independent International Scientific Panel on AI. UN Secretary-General António Guterres has framed the effort’s core rationale directly: no single country can see the full picture of AI risk alone, and shared understanding is necessary to build effective guardrails, unlock AI’s benefits, and foster cooperation. The Global Dialogue represents, per Council on Foreign Relations analysis, a genuine test of whether international AI governance can move beyond fragmented, incompatible national approaches toward a more coordinated and inclusive form — though early indications suggest not all countries support this coordinated model equally, and the effort unfolds against a backdrop of the EU’s rights-based regulatory approach, the US’s preference for voluntary standards, and China’s emphasis on state control existing in active tension with one another.
This tension matters directly for the non-state-actor security dimension: a genuinely global guardrail regime capable of constraining terrorist or criminal exploitation of AI capabilities requires exactly the kind of coordinated, cross-jurisdictional cooperation that great-power regulatory competition currently undermines. Smaller and developing states, meanwhile, gain a formal voice in these new UN-backed forums but remain structurally dependent on the small number of major powers that control the bulk of global AI talent, capital, and computing infrastructure — limiting their practical influence over how any eventual guardrail regime is designed and enforced.
Implications for Foreign Policy and Technology Governance Stakeholders
- Open-weight model release policy deserves treatment as an irreversible governance decision, not an incremental product choice. Given the finding that guardrails are likely removable from any open-weight model post-release, policy frameworks evaluating AI model release should weight this irreversibility explicitly rather than treating open-weight releases as equivalent in risk profile to controllable, API-gated model access.
- Governance frameworks should target diffusion pathways, not solely model capability. Since the 2026 evidence base suggests AI is primarily amplifying existing non-state actor threat efficiency rather than creating unprecedented threat categories, policy resources may generate more impact by controlling how capable models reach less-resourced or less-vetted actors than by attempting to cap frontier model capability alone.
- The autonomous-systems governance gap requires urgency independent of the broader UN Dialogue timeline. With target-to-fire compression already operational in live conflicts and 565 armed groups (including non-state actors) already engaged in drone warfare, the multilateral governance process’s more deliberate, consensus-building pace may not match the operational speed of the threat it aims to address.
- Civil society and industry non-state actors remain a meaningful, underutilized lever for governance influence. Given documented civil-society influence in processes like the EU AI Act negotiation, foreign policy and technology governance stakeholders should treat multistakeholder engagement — not only formal state-to-state negotiation — as a genuine channel for shaping eventual global guardrail design.
Frequently Asked Questions
Are terrorist groups actually using AI for operational planning in 2026?
Yes, with documented cases: a May 2026 Indian terrorism case involved a defendant who used ChatGPT and YouTube to learn explosive device construction, and broader reporting describes AI assisting a designated terrorist organization with unit sizing and raid planning — though researchers note significant operational execution barriers remain independent of AI assistance.
Can AI safety guardrails be removed from open-source models?
Research from Tech Against Terrorism’s 2026 benchmark pilot assessed that guardrails are likely removable for all open-weight AI models, making open-weight model releases a potentially irreversible governance risk once safety measures can no longer be reliably enforced post-release.
What is the UN doing about global AI governance in 2026?
The UN launched the Global Dialogue on AI Governance and an Independent International Scientific Panel on AI, stemming from the 2024 Global Digital Compact, aiming to build coordinated international guardrails — though the effort operates amid significant tension between the EU’s rights-based, the US’s voluntary-standards, and China’s state-control regulatory approaches.
Conclusion
The 2026 non-state actor dimension of AI governance defies a simple narrative: the same technology lowering barriers for terrorist groups to plan attacks with greater precision is also, through civil society and multistakeholder participation, actively shaping the emerging global guardrail frameworks meant to constrain that very misuse. With autonomous weapons systems already compressing target-to-fire times to single-digit seconds in live conflicts, and open-weight model guardrails assessed as fundamentally removable once released, the core tension facing foreign policy and technology governance stakeholders is one of speed: whether the deliberate, consensus-driven pace of UN-backed multilateral coordination can keep pace with a threat landscape that is, by the clearest available evidence, evolving considerably faster.
Discover more from The Economy
Subscribe to get the latest posts sent to your email.

Oil and Diesel Prices in October 2026: How Supply Shocks Can Reach Inflation

AI Chip Demand in 2026: What TSMC, Nvidia and Data-Center Spending Reveal

Q3 2026 Earnings Season: The Bank, AI and Consumer Signals That Really Matter

Treasury Yields in 2026: Why Higher Bond Rates Matter for Stocks, Mortgages and Savings

KOSPI 2026: Why South Korean Stocks Turned Volatile and What AI Investors Should Watch

IREN Stock in 2026: AI Cloud Growth, Bitcoin Transition and the Risks Investors Miss

Stock Market Crash in 2026? Warning Signs, Scenarios and a Calm Investor Checklist

Peso Mexicano vs Dólar Estadounidense: A Practical USD/MXN Guide for October 2026

Is the Stock Market Open on Columbus Day 2026? NYSE, Nasdaq and Bonds Explained

Concert Ticket Prices in 2026: Dynamic Pricing, Fees and How to Buy Safely

High-Yield Savings Accounts in 2026: How to Compare APY Without Chasing a Headline

EU-China Trade Deal 2026: How Beijing and Brussels Avoided a Trade War—and Who Wins

Social Security 2027 COLA Announcement: Date, Formula and What Retirees Should Check

China’s AI Microdrama Boom: How Beijing Is Reshaping Global Media

China Stocks Today: Are Big Economies in Asia Nearing a Market Bottom?

World’s Largest Economies: Ranking the Top Global Powers

Global Pension Systems Ranked: The World’s Best and Worst Retirement Frameworks

Elon Musk’s Next Moves: Disrupting the 2026 Global Economy

Pakistan Economy 2026: Inside the SBP’s Balancing Act

Crude Oil & Petroleum Market Analysis: OPEC+ Decisions and Price Forecasts

GasBuddy Market Insights: How Crude Price Shifts Impact Local Fuel Cost Averages

Global Equity Market Divergence: US Tech vs. European Dividend Stocks vs. Asian Growth

IMF & World Bank Global Economic Outlook: Growth Forecasts Across Europe and Asia

Silver Price Today: Why the Xi-Trump AI Standoff Is Fueling a Safe-Haven Rally

Bitcoin Price Forecast 2026–2027: Will the 4-Year Cycle Hold?

The Future of Silicon: Supply Chain Vulnerabilities in the 2026 Tech Sector

Asian Stock Markets 2026: Japan, China, Pakistan & More

SpaceX IPO: How Aerospace Is Reshaping Tech Startup News
-

 Markets & Finance9 months ago
Top 15 Stocks for Investment in 2026 in PSX: Your Complete Guide to Pakistan’s Best Investment Opportunities
-

 Analysis8 months ago
Johor’s Investment Boom: The Hidden Costs Behind Malaysia’s Most Ambitious Economic Surge
-

 Analysis8 months ago
Top 10 Stocks for Investment in PSX for Quick Returns in 2026
-

 Banks9 months ago
Best Investments in Pakistan 2026: Top 10 Low-Price Shares and Long-Term Picks for the PSX
-

 Analysis8 months ago
Brazil’s Rare Earth Race: US, EU, and China Compete for Critical Minerals as Tensions Rise
-

 Investment9 months ago
Top 10 Mutual Fund Managers in Pakistan for Investment in 2026: A Comprehensive Guide for Optimal Returns
-

 Global Economy10 months ago
15 Most Lucrative Sectors for Investment in Pakistan: A 2025 Data-Driven Analysis
-

 Global Economy10 months ago
Pakistan’s Export Goldmine: 10 Game-Changing Markets Where Pakistani Businesses Are Winning Big in 2025