
Analysis
When the World’s Oil Tap Runs Dry: Inside the Strait of Hormuz Crisis Reshaping Global Energy Markets
There is a number that haunts every finance minister, central banker, and airline CFO on the planet right now: $114. That was the intraday peak for Brent crude on Monday, May 4th — a staggering 60% above where it traded just ten weeks ago, before the world woke up to the most severe oil supply disruption in recorded history. It is a number that means $6-a-gallon gasoline on California’s freeways, fuel rationing queues in Karachi and Dhaka, and the spectre of 1970s-style stagflation returning to haunt a global economy that was only just finding its footing.
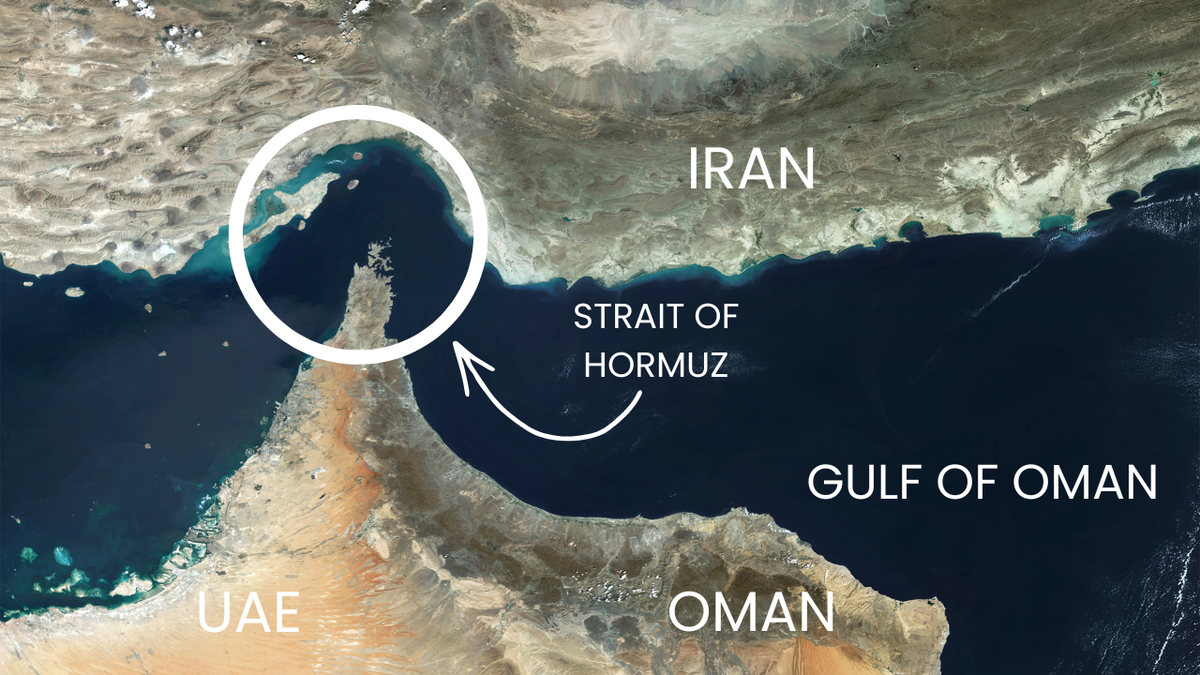
The story of how we arrived here — how a waterway barely 33 kilometres wide at its narrowest point came to hold the entire global economy in a chokehold — is, at its core, a story about the lethal intersection of nuclear brinkmanship, the fragility of energy infrastructure, and three decades of strategic miscalculation by policymakers who assumed the Strait of Hormuz would always, eventually, stay open.
It will not always stay open. We are living through the proof.
The Price Shock: What the Numbers Are Actually Telling Us
Let’s start with the raw data, because the numbers themselves are extraordinary.
Brent crude surged nearly 6% to close at $114.44 per barrel on Monday — its highest level since May 2022 — before pulling back to $113.24 on Tuesday morning as a fragile ceasefire showed signs of fracture. WTI, the U.S. benchmark, settled at $106.42 before easing to $104.57. Both contracts remain up roughly 60% since the U.S. and Israeli-led air war against Iran began on February 28th — the steepest two-month rally in the history of the crude oil market.
What the price action tells us about trader psychology is revealing: markets are not pricing in a resolution. They are pricing in prolonged uncertainty with intermittent ceasefire noise providing brief relief. The classic “buy the rumour, sell the fact” dynamic has been replaced by something grimmer — a market that has become structurally adapted to crisis, where every diplomatic statement is greeted with scepticism and every escalation triggers mechanical, algorithmic buying.
The volatility itself is informative. A 6% single-session spike in Brent is not normal market behaviour; it reflects genuine fear that the next morning’s headlines could remove another tranche of supply. As ING’s commodities strategist Warren Patterson noted in a research note to clients: “The oil market has moved from over-optimism to the reality of the supply disruption we are seeing in the Persian Gulf. The longer this disruption persists, the less the market can rely on inventory, and the greater the need for further demand destruction.”
The only mechanism that drives demand destruction, as Patterson implicitly acknowledges, is higher prices. Which is precisely why Exxon Mobil CEO Darren Woods warned investors on Friday that the market still hasn’t absorbed the full impact of the disruption. “There’s more to come,” Woods said on Exxon’s Q1 earnings call. He wasn’t bluffing.
The Strait That Runs the World: A Geography Lesson the World Learned Too Late
| Key Metric | Pre-Crisis (Feb 2026) | Current (May 2026) |
|---|---|---|
| Daily oil flow through Hormuz | ~20 million barrels/day | ~3.8 million barrels/day |
| Brent Crude Price | ~$70/barrel | ~$113/barrel |
| Global oil supply disruption | Baseline | -10.1 million barrels/day |
| Strait traffic vs. peacetime | 100% | Approx. 4% (Goldman est.) |
| IEA global observed oil inventories (March drop) | — | -85 million barrels |
The Strait of Hormuz — 21 miles across at its narrowest, straddling Iran to the north and Oman to the south — was, until February 28th, the conduit for roughly 20% of the world’s seaborne oil trade and 20% of its LNG. The numbers were always known; the vulnerability was always documented; the strategic risk was always theorised. What was not adequately war-gamed was what happened when Iran chose to act on its most extreme leverage rather than merely threaten it.
Iran’s Revolutionary Guard Corps has laid sea mines in the strait, boarded and attacked merchant vessels, and issued warnings forbidding transit. According to the IEA’s April 2026 Oil Market Report, shipments through Hormuz had by early April fallen to just 3.8 million barrels per day — compared to more than 20 million before the crisis. The IEA’s executive director did not mince words, calling it “the greatest global energy security challenge in history.”
Goldman Sachs analysts, meanwhile, estimated that the combined effect of the Strait’s closure and attacks on energy infrastructure has reduced global daily production by a staggering 14.5 million barrels. To put that figure in context: at its peak disruption, the 1973 Arab Oil Embargo removed approximately 4.4 million barrels per day from global markets. The current shock is more than three times larger.
The IEA confirms that global oil supply plummeted by 10.1 million barrels per day in March alone, the largest single-month drop in the agency’s five-decade history. Global observed inventories fell by 85 million barrels in March, with stocks outside the Middle East drawn down by a significant 205 million barrels as flows through Hormuz were choked off.
Fire at Fujairah: When Infrastructure Becomes a Weapon
Monday’s renewed market shock arrived at 6 a.m. UAE time, when Iranian drones breached Emirati air defenses and struck the Fujairah oil hub — one of the world’s largest bunkering ports and a critical chokepoint for tanker re-fuelling operations. The UAE’s defense ministry confirmed that it intercepted 12 ballistic missiles, three cruise missiles, and four drones launched from Iran, but the drone that slipped through ignited a fire at the storage terminal.
Three people were injured. The financial damage is incalculable.
The attack on Fujairah was not random. It was a calculated strike on one of the few alternative energy export routes available to Gulf producers attempting to bypass the blocked strait. Saudi Arabia’s East-West Pipeline (Petroline), with roughly 5 million barrels per day of theoretical capacity, and the Abu Dhabi Crude Oil Pipeline, which routes around the Strait to Fujairah itself, represent the only meaningful alternatives to Hormuz transit for the region’s producers. Hitting Fujairah is Iran’s way of closing the escape hatch.
The U.S. military confirmed that Iran’s IRGC also launched cruise missiles at American warships and commercial vessels in the waterway, while U.S. forces reported “defending all commercial ships” against drones and small boats. Two American-flagged vessels did manage to transit the strait under naval escort — a symbolic, if operationally limited, proof-of-concept for President Trump’s “Project Freedom” initiative. Markets were unimpressed. As one analyst quipped: escorting two ships through a mined strait to demonstrate normalcy is rather like opening one lane of a motorway after a major earthquake and declaring traffic flowing.
The Supply Arithmetic: Why Recovery Will Take Months, Not Weeks
Here is the analytical dimension that the breathless daily price commentary tends to miss: even if Hormuz reopened tomorrow, the supply problem would not be solved quickly.
According to Wood Mackenzie’s Head of Upstream Analysis, Fraser McKay, it could take Iraq alone up to nine months to reach prior production levels after a reopening — due to reservoir management complexities and resource constraints. Some wells, shut in hastily in the opening days of the conflict, may have been permanently damaged.
The IEA estimates that even after reopening, it would take around two months to re-establish steady exports, and initial volumes would remain below pre-conflict levels. More pointedly: essentially all of the world’s meaningful spare production capacity — housed in Saudi Arabia and the UAE — is itself trapped behind the blockade. The U.S. shale sector, often romanticised as a swing producer capable of absorbing global shocks, simply cannot substitute for the scale of disruption here.
Goldman’s base case, as of late April, assumed Hormuz normalises by end of June 2026 — a timeline their analysts noted carried “considerable scepticism” even when written. Under sustained production losses near 2 million barrels per day, Goldman projects Brent reaching the $115–$120 range in Q3 and Q4 2026. But that assumes June reopening. The ceasefire announced on April 8th has already frayed dramatically.
The U.S. blockade of Iranian ports, initiated on April 13th, has created what analysts are calling a “dual blockade” — Iran blocking ships from leaving the Gulf, the U.S. blocking ships from reaching Iran. The result is an energy purgatory from which there is no technical exit, only a diplomatic one.
Ripple Effects: From Petrol Forecourts to Supply Chains to the Dining Table
The economic damage extends far beyond crude prices, and its full scope is only beginning to be understood.
For consumers: Californian pump prices have topped $6 a gallon for 87-octane gasoline — a level last seen during the worst post-COVID supply crunch. European fuel prices are rising sharply. In Asia and the developing world, the pain is more acute: Pakistan, Bangladesh, Vietnam, and Zimbabwe are experiencing severe fuel shortages. The Philippines declared a state of emergency in March.
For food security: The Strait of Hormuz carries over 30% of global urea exports — the critical fertiliser input for corn and wheat production. Disruption to the fertiliser supply chain during the spring planting season is now seeping into food price projections. The Food Policy Institute in London has warned of long-term food price increases. Gulf states, which depend on the Strait for over 80% of their caloric imports, are experiencing a concurrent grocery supply emergency — with retailers like Lulu Retail airlift-pricing staples after 70% of the region’s food imports were disrupted.
For airlines: Jet fuel shortages are now being reported across parts of Asia and Oceania, complicating flight schedules and hammering airline margins. Shipping costs have surged as major carriers including Maersk, CMA CGM, and Hapag-Lloyd rerouted around Africa’s Cape of Good Hope, adding weeks to transit times and hundreds of millions in fuel costs per voyage.
For central banks: The macroeconomic script that was written through 2024 and early 2025 — disinflation, rate normalisation, soft landing — has been shredded. The IEA characterises this crisis as echoing the 1970s energy crisis through “acute supply shortages, currency volatility, inflation, and heightened risks of stagflation and recession.” Interest rate reductions expected earlier this year are now either postponed or, in some cases, being reconsidered as upward moves to combat imported inflation.
Investment Implications: The Winners, the Losers, and the Structural Shifts
For investors navigating this landscape, the crisis is simultaneously a pricing windfall and a structural warning.
Integrated oil majors — ExxonMobil, Shell, BP, TotalEnergies — are reporting sharply stronger Q1 earnings. Saudi Arabia, with a fiscal breakeven of approximately $70–$80 per barrel, is generating substantial surplus revenue at current prices. These are, for now, the crisis’s clearest beneficiaries.
Oil-importing economies face the sharpest medium-term pain. India, which imports approximately 85% of its crude oil requirements, is one of the most exposed large economies. Indian refiners have pivoted aggressively toward Russian crude imports as Middle Eastern supplies evaporated. The government has raised export duties on diesel and aviation fuel to protect domestic availability — a politically costly but economically necessary intervention.
The structural shift accelerating beneath the headlines is more significant than the daily price chart. Every board room energy conversation that previously categorised renewable transition as a “long-term strategic priority” is now being revisited with urgency. Solar, wind, battery storage, and nuclear capacity — politically contested and economically uncertain in February — now represent an obvious insurance policy against the geopolitical volatility that fossil fuel dependency inescapably entails.
The crude lesson of the Hormuz crisis — a lesson that will be written into energy policy curricula for decades — is that diversification is not a luxury. It is a survival strategy.
What Comes Next: Three Scenarios
Scenario 1 — Diplomatic resolution (base case, but fading): U.S.-Iran negotiations produce a framework agreement. Hormuz reopens by late June or July. Brent stabilises in the $90–$100 range through H2 2026 as inventories slowly rebuild and production restarts. Inflation pressure eases; central banks resume rate cuts. Markets rally.
Scenario 2 — Prolonged stalemate (increasingly plausible): The current dual blockade persists through Q3. Brent tests the $120–$130 range. Global growth forecasts are cut. Several emerging market economies enter recession. Demand destruction becomes the only mechanism that rebalances the market, and it is brutal.
Scenario 3 — Escalation (tail risk, non-negligible): A miscalculation — a U.S. warship struck, or Iranian infrastructure in the Gulf hit by a significant attack — tips the standoff into broader military confrontation. Brent exceeds $150. Strategic petroleum reserves are released globally. The global economy enters the most severe energy crisis since World War II.
ING’s Patterson and Manthey wrote on Tuesday that markets may find some relief following President Trump’s comments suggesting the conflict could continue for two to three weeks — implying, at least, a defined timeline. But the analysts added a crucial caveat: markets would view this with “considerable scepticism, given the recent escalation and the repeated extensions of projected timelines for ending hostilities since the conflict began.”
The market has heard this before. Every week for ten weeks.
FAQ: Oil Prices and the Hormuz Crisis
Q: Why have oil prices surged above $110 per barrel? Iran’s blockade of the Strait of Hormuz has removed approximately 20% of the world’s seaborne oil trade from the market since late February 2026, creating the largest supply disruption in history. Combined with attacks on energy infrastructure across the Gulf, global oil supply has fallen by more than 10 million barrels per day.
Q: What is the Strait of Hormuz and why does it matter? The Strait of Hormuz is a narrow sea lane between Iran and Oman through which approximately 20% of global oil and 20% of global LNG passed before the crisis. There is no viable full alternative: bypass pipelines through Saudi Arabia and the UAE collectively carry roughly 6.5 million barrels per day, a fraction of Hormuz’s prior throughput of over 20 million.
Q: How long could oil prices stay this high? Goldman Sachs projects Brent will average $90 per barrel in Q4 2026 in its base case (up nearly $30 from pre-crisis levels), assuming Hormuz reopens by end of June. If the blockade persists, $115–$120 Brent in Q3/Q4 is a real scenario, and $130+ cannot be ruled out in a further escalation.
Q: Will U.S. shale production offset the supply loss? Not meaningfully at this scale. The disruption is simply too large — over 10 million barrels per day of shut-in production — and U.S. shale ramp-up timelines are measured in months. The world’s spare production capacity is itself largely trapped in the Gulf behind the blockade.
Q: What does this mean for inflation and interest rates? The supply shock is unambiguously inflationary for energy-importing economies. Central banks that had been expected to cut rates through 2026 are now in a wait-and-see posture. A prolonged shock risks entrenching a new inflationary cycle that could require rate increases rather than cuts.
Q: How will this affect renewable energy investment? The crisis will likely accelerate it. Oil above $110 makes renewables economically competitive across a wider range of use cases. The strategic argument — that fossil fuel dependence creates catastrophic geopolitical exposure — has rarely been made more viscerally.
Q: Is a diplomatic resolution possible? It is the only resolution. There is no military path that reopens Hormuz quickly. The question is whether U.S.-Iran negotiations can produce a framework acceptable to both Tehran and Washington — and, critically, whether the terms of any nuclear deal can be agreed before the economic damage becomes irreversible.
Discover more from The Economy
Subscribe to get the latest posts sent to your email.


Oil Markets
China’s Oil Shock Absorber: How Beijing Kept Crude Prices Half of What Analysts Predicted

Analysts predicted oil above $200 during the Hormuz crisis. China’s intervention kept prices roughly half that. Fortune and Bloomberg explain how Beijing did it — and why the strategy has limits that markets have not fully priced in.
The $200 Oil That Never Arrived
When Iranian forces declared the Strait of Hormuz closed in early March 2026, the analytical consensus in energy markets shifted rapidly toward a catastrophic scenario. The Strait carries 27% of globally traded crude oil and petroleum products (Congressional Research Service, 2026). Iran had demonstrated both the capability and willingness to enforce that closure through attacks on shipping. A sustained blockade, analysts projected, could push Brent crude to $150, $175, or even above $200 per barrel — levels not seen since the 1970s oil shocks in real terms.
Brent reached approximately $113 at its peak in April. That is a severe price spike by any historical standard — a 100%-plus rise from January levels of around $56. But it is emphatically not $200. And the primary reason it is not $200, according to reporting from Fortune and Bloomberg, is China (Fortune, June 2026).
How Beijing managed to suppress oil prices to roughly half of what the most bearish forecasters projected — and why analysts warn that capability has limits — is one of the most consequential and under-analysed stories in global energy markets this year.
Key Takeaways
- Analyst consensus during the Hormuz closure was for Brent crude to potentially breach $200/barrel
- China’s strategic reserve releases, demand management, and alternative supply sourcing kept prices around $100–113 at their peak
- China receives approximately one-third of its total oil imports via the Strait of Hormuz
- Beijing is reportedly running out of its ability to continue suppressing oil price volatility through reserves alone
- The longer-term consequence may be a permanent reshaping of Asian energy supply chains away from Gulf dependence
China’s Structural Exposure and Its Response
China is not merely a passive participant in global oil markets. It is, by a significant margin, the world’s largest crude oil importer, and the Strait of Hormuz occupies a central role in its energy security architecture. Approximately one-third of China’s total oil imports — representing about 3–4 million barrels per day — transits the Strait of Hormuz (Wikipedia / 2026 Hormuz Crisis). The disruption of that supply was not an abstract geopolitical concern for Beijing; it was a direct threat to industrial production, electricity generation, and economic stability.
China’s response operated on multiple fronts simultaneously. The most immediate was the release of strategic petroleum reserves — a buffer that Beijing has been systematically expanding since the early 2000s precisely in anticipation of supply disruptions. China’s strategic reserve capacity, estimated at approximately one billion barrels by the time of the conflict, provided a multi-month cushion that allowed Chinese refineries to maintain throughput without paying spot prices at the elevated levels that would otherwise have cleared the market (Wikipedia / Hormuz Crisis).
Simultaneously, Beijing accelerated the diversification of its spot purchasing toward West African, Russian, and Central Asian supply — suppliers not exposed to the Strait bottleneck. Russia, whose pipeline export routes run overland through Central Asia and whose Pacific coast ports access Chinese markets without Middle East transit, saw a significant increase in contracted volumes. The rapid rerouting of demand is a function of commercial relationships that China’s National Petroleum Corporation and Sinopec have been cultivating for precisely this scenario for over a decade.
Demand Management: The Hidden Tool
Less visible but equally important was demand-side management. China’s centralised economic planning apparatus has tools that market economies simply do not possess. When spot crude prices spiked, Chinese industrial regulators directed state-owned enterprises in energy-intensive sectors — aluminum smelting, steel production, cement manufacturing — to reduce output or shift to pre-accumulated inventory rather than purchase at market prices.
This is not a price mechanism adjustment; it is a direct administrative intervention in the quantity of oil demanded. By reducing industrial throughput in sectors where the marginal cost of a production pause is relatively low, Beijing effectively shifted the demand curve downward during the period of peak supply disruption — suppressing the equilibrium price without directly intervening in international markets.
The geopolitical complexity of this strategy should not be overlooked. China’s demand management created cover for an implicit diplomatic position: Beijing was neither supporting the U.S.-led international effort to reopen the Strait nor openly backing Tehran’s closure. It was simply managing its own economic exposure — a position that Xi Jinping could maintain with public statements calling the Strait’s openness “in the common interest of regional countries and the international community” while privately doing whatever was necessary to insulate the Chinese economy from the worst consequences (Wikipedia / Hormuz Crisis).
Why the Strategy Has Limits
Fortune’s analysis is clear: China’s oil shock absorption cannot continue indefinitely, and cannot protect global markets much longer at current intensity (Fortune, June 2026).
The strategic petroleum reserve, however large, is a finite buffer. It is designed to cover weeks or a few months of disruption — not a sustained multi-year reorientation of global supply chains. Every barrel released from reserve must eventually be replaced, and replacement purchases at a time of market tightness push prices back up. If the Hormuz situation were to deteriorate again after a partial reopening, China’s reserve cushion would be materially depleted compared to its pre-crisis level.
The administrative demand management approach also carries economic costs that compound over time. Cutting aluminum or steel output during a supply shock is tolerable for weeks. Sustained output reductions damage trade relationships, create delivery failures on international contracts, and impose real economic costs on the downstream industries that depend on those materials. At some point, the cost of demand suppression exceeds the cost of simply paying higher oil prices.
The most durable consequence of the crisis is not what China did in the short term — it is what it is now doing structurally. Long-term supply agreements with non-Gulf producers, accelerated domestic refinery investment, expanded strategic reserve capacity, and intensified electric vehicle and renewable energy adoption are all being fast-tracked as direct lessons of the 2026 disruption. Those investments will reduce China’s Hormuz dependency over a five-to-ten-year horizon — permanently altering the geopolitical leverage that control of the Strait confers.
What This Means for Global Oil Prices
The two-sided implication for global energy markets is stark. In the near term, as the Hormuz deal is implemented and Chinese reserve releases wind down, the physical oil market will need to find a new equilibrium without Beijing’s suppressive effect. The natural clearing price — in the absence of further disruption — is likely in the $75–90 Brent range, reflecting OPEC-plus production discipline, recovering non-Gulf supply, and the partial demand destruction caused by the price spike.
In the medium term, China’s structural shift away from Gulf dependency represents a secular demand reduction for Hormuz-routed barrels. That reduction, distributed across a five-to-ten year transition, is manageable for Gulf producers who can reroute via pipeline (Saudi Arabia, UAE) but is structurally damaging for those who cannot (Iraq, Kuwait, Qatar).
For energy investors, the China oil story of 2026 offers a counterintuitive insight: the country that was most exposed to the supply disruption also proved to be the most effective damper on the price shock. That capability will not disappear — but it will not be unlimited either. The next disruption will test reserves and administrative levers that are now partially depleted, and the price response, when it comes, may be harder to contain.
Discover more from The Economy
Subscribe to get the latest posts sent to your email.
Analysis
U.S. Inflation at a Three-Year High: How the Iran War Turned an Economic Recovery Into a Stagflation Risk

U.S. inflation hit 4.2% in May 2026 — its highest since April 2023 — driven by an oil price surge linked to the U.S.-Iran conflict and the Strait of Hormuz closure. Here’s what it means for households, the Fed, and economic growth.
Key Takeaways
- U.S. CPI rose 4.2% year-on-year in May 2026, the highest reading since April 2023
- Core CPI (ex-food and energy) is more contained at 2.9%, limiting but not eliminating the Fed’s concern
- WTI crude rose from ~$57/barrel in January to a peak of $113 in April — nearly doubling in three months
- The Federal Reserve has revised its 2026 PCE inflation forecast up sharply, from 2.7% to 3.6%
- The risk of second-round inflationary effects — where energy costs embed into the broader price level — is Citigroup’s primary concern
From Recovery to Renewed Pressure
Entering 2026, the U.S. economic outlook appeared broadly constructive. Inflation had trended down from post-pandemic peaks; the Federal Reserve had delivered three successive quarter-point rate cuts in the final months of 2025; the labour market, while cooling, remained healthy; and consumer spending was proving more resilient than many forecasters expected.
Then, in late February 2026, the United States and Israel launched military operations against Iran, and the macroeconomic calculus changed almost overnight.
The Consumer Price Index rose 4.2% year-on-year in May 2026 — the highest annual reading since April 2023, and a dramatic reversal of the disinflationary trajectory that had defined 2024 and most of 2025 (CBS News, June 2026). The Federal Reserve revised its headline PCE inflation forecast for 2026 up from 2.7% to 3.6% at the June FOMC meeting — a 90-basis-point upward revision in a single quarter, the most aggressive single-meeting inflation reassessment in years (Fox Business, June 17, 2026).
The Oil Price Channel: From $57 to $113
The transmission mechanism is straightforward. Iran’s declaration that the Strait of Hormuz was “closed” on March 4, 2026 — through which approximately 27% of globally traded crude flows — created an immediate and severe supply shock. West Texas Intermediate crude futures rose from approximately $57 per barrel at the start of the year to a peak of $113 in April (U.S. Bank Asset Management, June 2026).
At the pump, the consequences were immediate. U.S. gasoline prices track crude oil prices closely, with a lag of several weeks. By the time WTI peaked in April, American consumers were paying materially more to fill their tanks, heat their homes, and power their businesses. Energy is both a direct component of the CPI and an indirect input cost for virtually every sector of the economy — transportation, manufacturing, agriculture, and retail alike.
The energy shock was the primary driver behind the May CPI reading. Core inflation — which strips out volatile food and energy prices and is the Fed’s preferred gauge of underlying price dynamics — came in at a more contained 2.9% (NPR, June 17, 2026). That 130-basis-point gap between headline and core is the central interpretive challenge facing policymakers: it suggests the inflation is mostly a supply shock rather than a demand-driven phenomenon — but that is cold comfort when households are paying 4.2% more for their consumption basket than they were a year ago.
The Second-Round Effect: The Slow Spread
The more dangerous scenario, from a monetary policy perspective, is not the initial energy price spike — it is what economists call second-round effects. These occur when energy cost increases flow into the prices of non-energy goods and services through transportation costs, higher manufacturing input costs, and wage demands that workers make in response to a higher cost of living.
Citigroup flagged this risk in a late-May research note, warning that the prolonged run-up in crude prices was already beginning to spill into broader inflation pressures, with second-round effects becoming visible in sectors where energy costs are a significant input — logistics, food processing, and industrial manufacturing in particular (CNBC, May 28, 2026). Once second-round effects are embedded in the wage-price dynamic, the supply-shock origin becomes irrelevant: the inflation is self-sustaining regardless of what happens to oil.
This mechanism is why the Federal Reserve — which under normal doctrine would look through a supply-driven energy shock — has moved to a hawkish posture despite the conflict being the source of price pressure. Nine of 18 FOMC members now project a rate hike before year-end 2026 (Fox Business). The committee has explicitly raised its inflation outlook and removed its easing-biased forward guidance. That is not the behaviour of a central bank confident it can look through an energy spike.
Labour Market Complexity
What makes this inflation episode particularly difficult to manage is the backdrop of a surprisingly resilient labour market. U.S. employers added an average of 188,000 jobs per month over the three months to May, and the unemployment rate has held steady at 4.3% for a full year — a remarkably stable number given the geopolitical disruption (CNBC, June 17, 2026).
In a conventional supply-shock inflation scenario, one would expect the real income compression caused by higher energy prices to dampen consumer spending and slow growth — effectively doing the Fed’s tightening work for it. That has not clearly happened yet. Consumer spending has remained resilient, supported by a tight labour market, lower income and corporate taxes enacted earlier in the Trump administration, and fiscal tailwinds from government spending programmes.
The combination of elevated inflation and a still-strong labour market is, in monetary policy terms, the worst of all worlds for a central bank trying to justify patience. It removes the “growth is already slowing” argument that would otherwise support a hold-and-wait posture. The hawks within the FOMC have a clean case: prices are too high, jobs are plenty, and there is no compelling reason to leave rates where they are.
How American Households Are Feeling It
Behind the statistics is a lived economic reality for American households. Inflation has now been running above the Fed’s 2% target for five consecutive years (Fox Business). The compounding effect of sustained above-target inflation on real purchasing power is substantial: a household that was earning $75,000 in 2021 needs approximately $89,000 in 2026 to maintain the same standard of living, even before accounting for the latest energy-driven spike.
The political consequences are significant. Inflation is historically the most potent economic grievance among voters. An inflation reading of 4.2% — after a period when the public narrative had shifted to “inflation is under control” — represents a reputational setback for the administration and a genuine hardship for lower- and middle-income households, who spend a disproportionate share of their income on energy and food.
SNAP benefit restrictions — under active congressional consideration — would compound the impact on the most vulnerable households. Food companies and grocery chains are watching the policy debate closely, as changes to SNAP purchasing rules could meaningfully alter demand patterns for staple goods (CNBC, June 20, 2026).
The Path Forward
The good news — and it is significant — is that the primary driver of the inflation surge is now partially reversing. Brent crude has retreated from its April peak of approximately $113 to approximately $78 by mid-June, as the U.S.-Iran peace framework reduces near-term supply disruption fears (Al Jazeera, June 17, 2026). If Brent settles in the $70–80 range and the Strait reopening is durable, the energy component of CPI should provide disinflationary relief in the June, July, and August prints.
The lagged second-round effects will take longer to unwind. Wage growth that has been pulled higher by workers’ cost-of-living concerns does not retreat immediately when pump prices fall. Transportation costs embedded in goods pricing take months to work out of supply chain contracts. Services inflation — already running hot before the conflict — has limited sensitivity to oil prices in either direction.
The base case, shared by most economists surveyed ahead of the June FOMC meeting, is that inflation moderates back toward 3% by year-end as energy effects dissipate — but that the Fed holds rates steady at best, and hikes once at worst. The stagflationary risk — where growth slows meaningfully while inflation remains above target — is not the central scenario but is no longer a tail risk.
Discover more from The Economy
Subscribe to get the latest posts sent to your email.
IPO
IPO Summer 2026: Anthropic, OpenAI, and the Race to Price Artificial Intelligence on Public Markets

With SpaceX now public, Anthropic has confidentially filed at a ~$965 billion valuation and OpenAI follows at $852 billion. We break down what their IPOs mean for public markets, AI competition, and investors.
Key Takeaways
- Anthropic confidentially filed its S-1 with the SEC on June 1, 2026; OpenAI followed on June 8
- Anthropic’s latest funding values it at approximately $965 billion; OpenAI targets a $852 billion debut valuation
- Anthropic’s annualised revenue run rate crossed $44–47 billion in May 2026, growing at roughly 10x per year
- Both Goldman Sachs and Morgan Stanley are bookrunning both deals, each expected to raise at least $60 billion
- Together with SpaceX, the three mega-IPOs could demand north of $200 billion from public markets in 2026
The Year Public Markets Had to Price AGI
SpaceX’s June 12 debut was historic. But in the longer narrative arc of 2026, it may prove to be the prelude. With Elon Musk’s rocket company now trading on the Nasdaq and raising $85.7 billion in the largest IPO in history, Wall Street’s attention has pivoted immediately to the next act: Anthropic and OpenAI, the two companies whose products are reshaping global knowledge work, coding, legal services, healthcare, and finance — and whose valuations are asking public markets to price something it has never priced before: the plausible path to artificial general intelligence.
The sequence is moving fast. Anthropic confidentially filed its S-1 with the SEC on June 1, 2026, the company confirmed in a blog post that day (Fortune, June 1, 2026). OpenAI followed exactly one week later, on June 8, announcing its own filing rather than allowing it to leak — a signal from Sam Altman’s team that they intend to control the IPO narrative (FutureSearch, June 2026). Both are bookrun by the same dual-bank syndicate: Goldman Sachs and Morgan Stanley, each expected to raise at least $60 billion (FutureSearch).
Anthropic: The Quiet Frontrunner
Twelve months ago, Anthropic was universally described as OpenAI’s challenger. Today, by several key metrics, it has pulled ahead. The company’s annualised revenue run rate crossed $44–47 billion in May 2026, compounding at approximately 10x per year — a growth rate that makes OpenAI’s roughly 3.4x annualised growth look almost conventional by comparison (IndMoney, June 2026; BitMEX).
Anthropic raised $30 billion in a Series G round in February 2026 at a $380 billion post-money valuation, before a $65 billion Series H-1 round in May pushed the private valuation to approximately $965 billion — eclipsing OpenAI’s valuation for the first time (Fortune, June 2026). The company is also on track to post its first-ever operating profit in Q2 2026, projecting approximately $559 million on $10.9 billion in quarterly revenue (IndMoney).
The enterprise thesis is central to Anthropic’s public market story. Approximately 80% of revenue comes from enterprise customers, and Anthropic’s share of the enterprise AI market surpassed OpenAI’s for the first time in April 2026, driven by Claude’s dominance in agentic coding workflows, legal research, and financial analysis (IG UK, June 2026). Anthropic has told investors its annualised run rate will surpass $50 billion by July, and has projected $70 billion in revenue with $17 billion in free cash flow by 2028 (IG UK).
The risks are real. A $5.6 billion net loss in 2024 and a 2028 cash-flow profitability target — rather than an immediate one — mean investors must take a long-dated view. The company is also embroiled in a legal dispute with the U.S. government after the Pentagon designated it a supply-chain risk, a designation Anthropic argues could jeopardise billions in revenue (Fortune). Additionally, a June 12 regulatory action suspending the “Claude Fable” model export has widened the tail risk on Anthropic’s IPO timeline, pushing the p10 downside date out to April 2028 in some analyst models (FutureSearch).
The consensus target date for Anthropic’s listing is December 2026, with a first-day market cap median of approximately $1.10 trillion — which would make it the first pure-enterprise AI safety company to trade publicly, and one of the most valuable companies ever to debut (FutureSearch).
OpenAI: Bigger by Brand, Smaller by Growth Rate
OpenAI carries extraordinary brand recognition — ChatGPT crossed 900 million weekly active users by early 2026 — and its revenue trajectory, while slower than Anthropic’s in percentage terms, is still formidable in absolute terms: revenues grew from approximately $2 billion annualised in 2023 to over $20 billion by end-2025 (IndMoney).
But the loss picture gives public investors pause. FutureSearch estimates OpenAI’s 2026 GAAP net loss at $25–26 billion against a widely cited $14 billion non-GAAP figure — a gap that reflects the difference between the story management is telling on the roadshow and the financial reality a public company must disclose in quarterly filings (FutureSearch). The 90-day post-IPO market cap estimate of $0.86 trillion — materially below the first-day median — reflects the prediction that institutional models, once they have time to fully digest the loss line, will price more conservatively than day-one narrative demand.
OpenAI’s $852 billion debut valuation target positions it slightly below Anthropic’s pre-IPO mark (Fortune, June 2026). The later it lists, the more revenue compounds under the number — meaning OpenAI has a structural incentive to maximise quality of disclosure ahead of its September target rather than rush to beat Anthropic to market.
The Capital Markets Challenge: Can the System Absorb It?
The scale of capital being demanded is genuinely unprecedented. SpaceX alone raised $85.7 billion. Anthropic and OpenAI are each expected to raise at least $60 billion. Total 2026 U.S. IPO proceeds could reach approximately $160 billion, according to Goldman Sachs projections — against a 2025 baseline of $45 billion (IndMoney).
The liquidity case is that there is an estimated $8 trillion sitting in U.S. money market funds. SpaceX’s $85.7 billion raise represents roughly 1% of that pool. Institutional investors who have spent years gaining AI exposure indirectly — via Nvidia for chips, Microsoft for its OpenAI stake, Alphabet for its Anthropic investment — now have the option of owning the underlying models directly. The pent-up demand for pure-play AI exposure is enormous.
The displacement risk is subtler but real. Money rotating into SpaceX, Anthropic, and OpenAI must come from somewhere — and that somewhere is likely existing Magnificent 7 positions or cash allocations that would otherwise flow into other sectors (IndMoney). The portfolio rebalancing triggered by three mega-listings could create meaningful headwinds for established large-cap tech stocks in the second half of 2026.
The Race to First-Mover Advantage
Anthropic’s decision to file first was strategically deliberate. By going to market ahead of OpenAI, the company avoids being overshadowed by its more famous rival and benefits from scarcity — institutional investors who buy Anthropic have less capital available for OpenAI when it comes. OpenAI, meanwhile, gains a tactical advantage from watching how the market prices audited frontier AI financials before committing to its own price.
It is worth noting, as IG UK observes, that both companies filed within days of each other despite being direct competitors — suggesting that both management teams made independent calculations that the post-SpaceX IPO window represents an optimal moment for AI listings, when investor appetite for frontier technology is at a verifiable high and the SpaceX roadshow has done the work of educating institutional allocators on how to think about pre-profitability, mission-driven, deeply moated technology businesses (IG UK).
2026: The Year That Changes Public Markets Forever
If SpaceX, Anthropic, and OpenAI all complete their listings before year-end, 2026 will be remembered as the year public markets were forced to price artificial general intelligence for the first time. Their combined target valuations of approximately $3.6 trillion equal the GDP of France — and they are not asking investors to value what they earn today, but what humanity becomes tomorrow (IndMoney).
That is a proposition without precedent in the history of capital markets. Whether public markets accept it enthusiastically, price it conservatively, or — as some veteran investors warn — create the conditions for a correction of historic proportions when the gap between narrative and quarterly earnings becomes undeniable, is the central investment question of 2026.
Discover more from The Economy
Subscribe to get the latest posts sent to your email.

Goldman Sachs: “The Circulatory System Is Not Working”

Why the U.S. Budget Airline Model Is Running Out of Runway

China’s Oil Shock Absorber: How Beijing Kept Crude Prices Half of What Analysts Predicted

CRH Nears Biggest-Ever Deal to Acquire Arcosa

U.S. Inflation at a Three-Year High: How the Iran War Turned an Economic Recovery Into a Stagflation Risk

IPO Summer 2026: Anthropic, OpenAI, and the Race to Price Artificial Intelligence on Public Markets

Strait of Hormuz Crisis 2026: How a Waterway War Broke Global Oil Markets

Kevin Warsh’s Fed Debut: Rate Hikes Now on the Table as U.S. Monetary Policy Enters a New Era

SpaceX IPO 2026: Inside the $85.7 Billion Listing That Made Elon Musk the World’s First Trillionaire

PSX KSE-100 Up 500+ Points: The Geopolitical Impact on Stocks

Did Anthropic Talk Its Way Into an AI Export Ban?

Big Bonuses for South Korea’s Chip Workers Put Central Bank on Inflation Alert

Easing Iran Tensions Push Mortgage Rates Lower — But a Potential Fed Hike Clouds the Outlook

Paramount’s $111 Billion Warner Bros. Discovery Merger Clears DOJ, But Faces New Hurdles

China Overhauls the World’s Biggest Surveillance Network with Advanced AI

How AI Is Forcing McKinsey and Its Peers to Rethink Pricing

SpaceX IPO: Inside the $2 Trillion Market Debut

KPMG Australia CEO Resigns After Whistleblower Claims Exposed Investigation Failures

PwC China Partner Payouts Cut Amid Evergrande Audit Fraud

Broadcom Market Value Loss: Revenue Forecast Disappoints

The Guardrails Are Down: How Meta and Google’s AI Models Fold Under Pressure

Pakistan Budget FY 2026-27: Relief, Prospects, and the Tightrope Walk

Benefitbay Raises $18M to Build the Plumbing for America’s ICHRA Shift

Nasdaq Tumbles 4% as Chip and Memory Stocks Sink: A $1.2 Trillion Wipeout

Here’s How Much It’ll Cost You to Be Part of SpaceX’s Record-Breaking $75 Billion IPO

Japanese Mid-Sized Firms Flock to Southeast Asia for Growth

Southeast Asia Energy Shock: Economies Struggle to Cope

Singapore Puts a Clock on Wealth: MAS Orders Banks to Halve Account-Opening Times
-

 Markets & Finance6 months ago
Top 15 Stocks for Investment in 2026 in PSX: Your Complete Guide to Pakistan’s Best Investment Opportunities
-

 Analysis4 months ago
Top 10 Stocks for Investment in PSX for Quick Returns in 2026
-

 Analysis5 months ago
Brazil’s Rare Earth Race: US, EU, and China Compete for Critical Minerals as Tensions Rise
-

 Analysis4 months ago
Johor’s Investment Boom: The Hidden Costs Behind Malaysia’s Most Ambitious Economic Surge
-

 Banks5 months ago
Best Investments in Pakistan 2026: Top 10 Low-Price Shares and Long-Term Picks for the PSX
-

 Investment5 months ago
Top 10 Mutual Fund Managers in Pakistan for Investment in 2026: A Comprehensive Guide for Optimal Returns
-

 Global Economy6 months ago
15 Most Lucrative Sectors for Investment in Pakistan: A 2025 Data-Driven Analysis
-

 Global Economy6 months ago
Pakistan’s Export Goldmine: 10 Game-Changing Markets Where Pakistani Businesses Are Winning Big in 2025