
Analysis
SpaceX IPO: Inside the $2 Trillion Market Debut
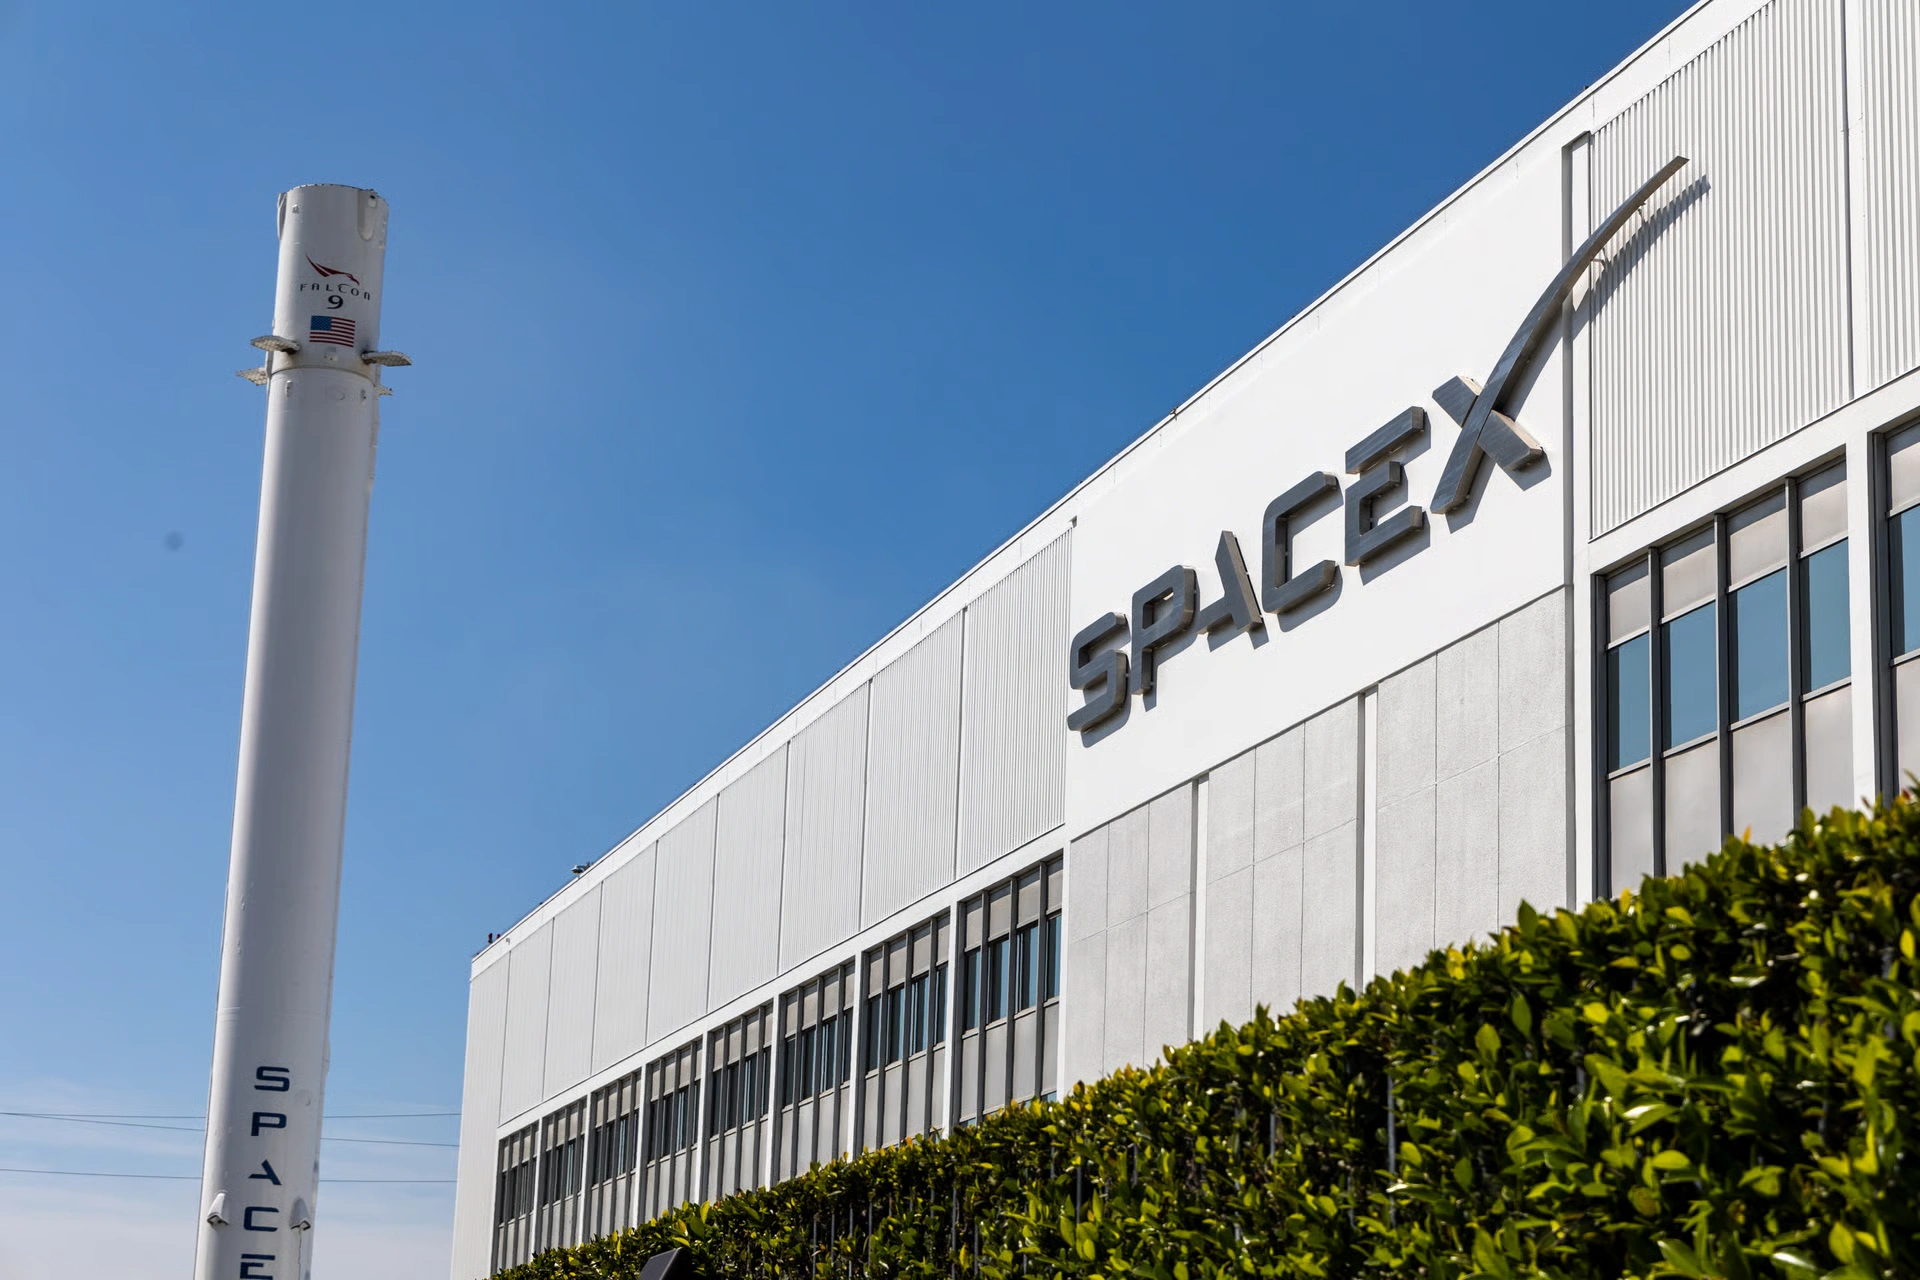
The prospectus runs 330 pages. It mentions asteroid mining. It promises passenger transport to Mars and invokes “the true nature of the universe.” Somewhere in its dense middle sections — beneath the soaring rhetoric about extending “the light of consciousness to the stars” — sits a balance sheet carrying $41.3 billion in accumulated losses and a net loss of $4.3 billion in a single quarter. On May 20, 2026, SpaceX filed its S-1 with the Securities and Exchange Commission, confirming plans to list on Nasdaq under the ticker SPCX with a debut pencilled in for June 12. The target: raise up to $80 billion at a valuation of $1.75 trillion to $2 trillion. It would be the largest IPO in history. By more than three times.
The Market That Made This Moment Possible
The SpaceX IPO arrives at a peculiar moment for capital markets. Equity benchmarks have climbed to fresh all-time highs in 2026, risk appetite has returned in force, and a cohort of long-awaited mega-listings — OpenAI and Anthropic among them — is forming in the queue behind SpaceX. The company’s debut is the centrepiece of what many on Wall Street call the most consequential IPO calendar since the dot-com era.
The scale is genuinely without precedent. Saudi Aramco, the current record holder, raised $25.6 billion in December 2019 — itself a landmark moment for the kingdom’s Vision 2030 ambitions. SpaceX isn’t trying to beat that record. It’s trying to triple it. At the top of its announced valuation range, the offering would also make SpaceX the first company in history to list publicly at a valuation exceeding $1 trillion — a threshold that took Apple, Microsoft, and Nvidia years of public trading to cross. That single fact tells you something important about the ambition — and the assumptions — embedded in this deal.
Twenty-three financial institutions are underwriting the offering, including Goldman Sachs, Morgan Stanley, Citigroup, and JPMorgan. Morgan Stanley, notably, brought back veteran dealmaker Michael Grimes as chairman of investment banking earlier this year specifically in preparation for this mandate. When Wall Street assembles a bench that deep, it signals both the size of the fee pool and the complexity of what they’re selling.
The SpaceX IPO: What the Numbers Actually Say
The SpaceX IPO, as it arrives in public markets, is not a simple rocket company story. It’s three distinct businesses priced as though all three will win simultaneously — and the S-1 makes that structure impossible to ignore.
SpaceX generated $18.67 billion in revenue for full-year 2025, up from $14 billion the prior year — a 33% year-on-year increase that, in isolation, looks compelling. The adjusted EBITDA figure of $6.58 billion for the same period is the number underwriters will put at the top of their roadshow slides. It’s real, and it matters. Yet the GAAP net loss for 2025 reached $4.94 billion, with a further loss of $4.3 billion in Q1 2026 alone against revenues of $4.69 billion. The accumulated deficit stands at $41.3 billion. This is not a company at the edge of profitability. It’s a company in active, accelerating cash consumption.
The gap between EBITDA and GAAP loss is driven by stock-based compensation, depreciation on the Starlink satellite constellation, and AI infrastructure capital expenditure — costs that are either genuinely cash-consumptive or structurally ongoing. Stripping them out doesn’t make them disappear; it makes them easier to overlook.
Break out the three segments and the picture sharpens. Connectivity — overwhelmingly Starlink — generated $11.39 billion in 2025 revenue with an operating profit of $4.42 billion, growing 49.8% year-on-year. It is the only segment making money. The Space segment (launch services, government contracts) operates at a loss. The AI segment, which now includes the merged xAI operation, lost more than $6 billion in 2025 and burned a further $2.5 billion in Q1 2026 alone.
SpaceX completed an all-stock merger with Musk’s xAI in February 2026 at a combined entity valuation of $1.25 trillion. The filing references xAI 356 times; Tesla appears 87 times. The document’s preoccupation with Musk’s broader corporate network isn’t incidental. It’s structural, and it’s a disclosure that sophisticated investors will read as a warning. SpaceX is also proposing to allocate up to 30% of IPO shares to retail investors — roughly three times the typical Wall Street norm. On an $80 billion raise, that’s approximately $24 billion in shares offered to individual buyers, a retail-accessibility play that echoes the stock split Musk executed on May 4, 2026, adjusting all per-share figures 5-for-1.
What Is SpaceX Really Worth? The Valuation Logic and Its Limits
The valuation question is where the SpaceX IPO gets genuinely hard to settle.
At $1.75 trillion, against approximately $21 billion in projected annual revenue, SpaceX is priced at roughly 83 times sales — a higher multiple than almost any major public technology company commands today. Even Nvidia, whose GPU dominance in AI training drove one of history’s most extraordinary equity runs, traded at multiples well below that figure at comparable revenue scale.
What is SpaceX’s IPO valuation and how is it justified?
SpaceX’s S-1 targets a valuation of $1.75 trillion to $2 trillion, implying roughly 83 times projected 2026 revenue. The bull case rests on Starlink’s 10.3 million subscribers across 164 countries, its 49.8% revenue growth rate, and SpaceX’s prospectus claim to have “identified the largest total addressable market in human history.” At the top of that range, the IPO would surpass every previous public listing in deal size and opening valuation.
The bull case does have structural grounding. Starlink is the fastest-growing broadband network in history. Direct-to-cell capability is still in early deployment phases. The prospectus frames orbital AI computing infrastructure — Starlink as a cloud layer competing with Amazon Web Services and Microsoft Azure — as a first-in-class opportunity. If that framing is even partially correct, the addressable market extends well beyond satellite internet subscriptions.
Still, the entire growth thesis is load-bearing on one thing: Starship. The fully reusable super-heavy launch vehicle underpins next-generation Starlink economics, orbital data centres, and Mars colonisation timelines alike. Across 11 flight tests, Starship’s upper stage experienced three consecutive “rapid unscheduled disassembly” events in early 2025 — Flights 7, 8, and 9 all exploded. The first actual payload delivery to orbit isn’t expected until H2 2026. SpaceX invested $930 million in Starship R&D in Q1 2026 alone, on top of $3 billion in 2025. Capital expenditures overall surged to $20.7 billion last year. These are extraordinary sums for a programme that hasn’t yet put commercial cargo into orbit.
Prediction markets are, for now, optimistic. Polymarket assigns a 94% probability to the IPO closing in the June 2026 window and a 72% chance of the post-IPO market cap exceeding $2 trillion. The synthetic SPCX perpetual contract on Hyperliquid implies a $2.4 trillion valuation. These are not independent forecasts — they’re reflexive price signals from investors who have already decided they want in.
The Downstream Consequences: For Markets, Rivals, and Governance
Assume the IPO prices within range and the debut is orderly. What happens next?
The most immediate effect is passive and automatic. If SpaceX enters major indices — Nasdaq fast-entry rules and potential S&P 500 eligibility are both plausible — index funds must buy the stock mechanically, regardless of analytical conviction. At a $2 trillion market cap, that creates structural buying pressure from pension funds, sovereign wealth vehicles, and passive ETFs managing trillions in tracked assets. The demand is forced, not analytical, and it creates a floor that has nothing to do with whether Starship achieves orbital payload delivery on time.
For the space industry broadly, a successful listing transforms the financing landscape. Rocket Lab, Blue Origin, and a cohort of European and Asian launch startups are watching carefully. A credible public comparator at trillion-dollar scale resets what private capital will value unproven space assets at — typically upward, and often independent of near-term profitability.
The governance structure is the more durable concern. Through Class B shares carrying ten votes each against one for Class A, Musk controls 85.1% of SpaceX’s voting power at listing. SpaceX is formally classified as a “Controlled Company” under Nasdaq rules, exempting it from standard independent director and governance committee requirements. Public shareholders will own equity but wield negligible influence over capital allocation, strategic direction, or related-party dealings.
That arrangement isn’t novel — Meta and Alphabet went public with similar structures. What’s different here is the density of the related-party ecosystem. The xAI GPU leasing arrangements disclosed in the S-1 amount to more than $20 billion in total contracted value. Gwynne Shotwell, SpaceX’s president and chief operating officer, appears as the fifth-largest individual holder of Class A shares — a continuity figure who has run the company’s day-to-day operations through its most consequential years. Around 20% of SpaceX’s 2025 revenue came from U.S. federal agencies, concentrating the company’s finances in a way that makes political exposure a genuine balance sheet variable.
The Case for Caution: What the Sceptics Have Right
There’s a version of this story that ends badly for early public investors, and it has historical weight.
Since 1999, five brand-name mega-IPOs have debuted in U.S. markets alongside Saudi Aramco’s 2019 listing. Only Visa traded higher six months after its debut. Facebook, Alibaba, GM, UPS, and Aramco all declined between 8% and 38% in the six months post-listing, before many later recovered to deliver strong long-run returns. The pattern is consistent: emotional pricing at debut, followed by a painful settling period as reality is absorbed.
With SpaceX, sceptics have three substantive objections worth taking seriously. The first is xAI. Grok, the AI assistant born from the merger, has struggled to differentiate meaningfully against OpenAI’s GPT series, Google’s Gemini, and Anthropic’s Claude. Losses exceeding $6 billion in 2025 for an AI service still searching for competitive traction represent a substantial liability that public investors — unlike patient private backers — will interrogate quarterly.
The second is the Starship timeline. The bull case for a $2 trillion valuation requires Starship to begin reliable commercial payload delivery in H2 2026 and scale to dozens of flights per year within 24 months. After three consecutive vehicle losses in 2025, that timeline carries genuine execution risk. Each month’s delay cascades: next-generation Starlink satellites can’t launch at cadence, which delays the mobile service expansion, which delays the orbital compute pitch, which undermines the premium multiple.
The third is governance opacity — not corruption, but complexity. At 85.1% voting control, Musk can theoretically redirect capital, alter internal relationships, or shift strategic priorities without meaningful shareholder check. The S-1’s 38 pages of risk factors include $530 million in legal exposure and a 2024 Brazilian court order that froze Starlink’s local assets over a dispute connected to Musk’s X Corp. The filing names Musk himself as a material risk factor. That’s a rare and pointed act of corporate candour — and a signal that the company’s own lawyers believe the association is worth insuring against in writing.
None of this is an argument that SpaceX is a bad company. It’s an argument that extraordinary companies can still make poor IPO investments, and that the distance between the two is often measured in the multiple at which you bought in.
What Comes After the Largest IPO in History
The SpaceX IPO is, at its core, a wager on whether a company with a declared mission to colonise another planet can be financially disciplined enough to generate durable returns for ordinary shareholders on this one. The tension isn’t between ambition and execution — SpaceX has proved its execution capacity more convincingly than almost any private company in history, conducting 82% of all U.S. space launches in 2025 with a reusable rocket system that redefined the economics of getting to orbit.
The tension is between the physics of capital allocation and the gravitational pull of a story so large it bends market reality.
Starlink is real, profitable, and growing fast. Starship is real, technically sophisticated, and currently unreliable at scale. The xAI bet is real, burning cash at pace, and competitively unresolved. And the man at the centre of all three is, by his own company’s admission, a material risk.
That’s not a reason to dismiss the listing. It’s a reason to read the 330 pages very carefully before signing the order ticket.
The light of consciousness, as Musk’s prospectus has it, may yet reach the stars. It’s the journey from SEC filing to first profitable quarter that tends to be the hard part.
Discover more from The Economy
Subscribe to get the latest posts sent to your email.


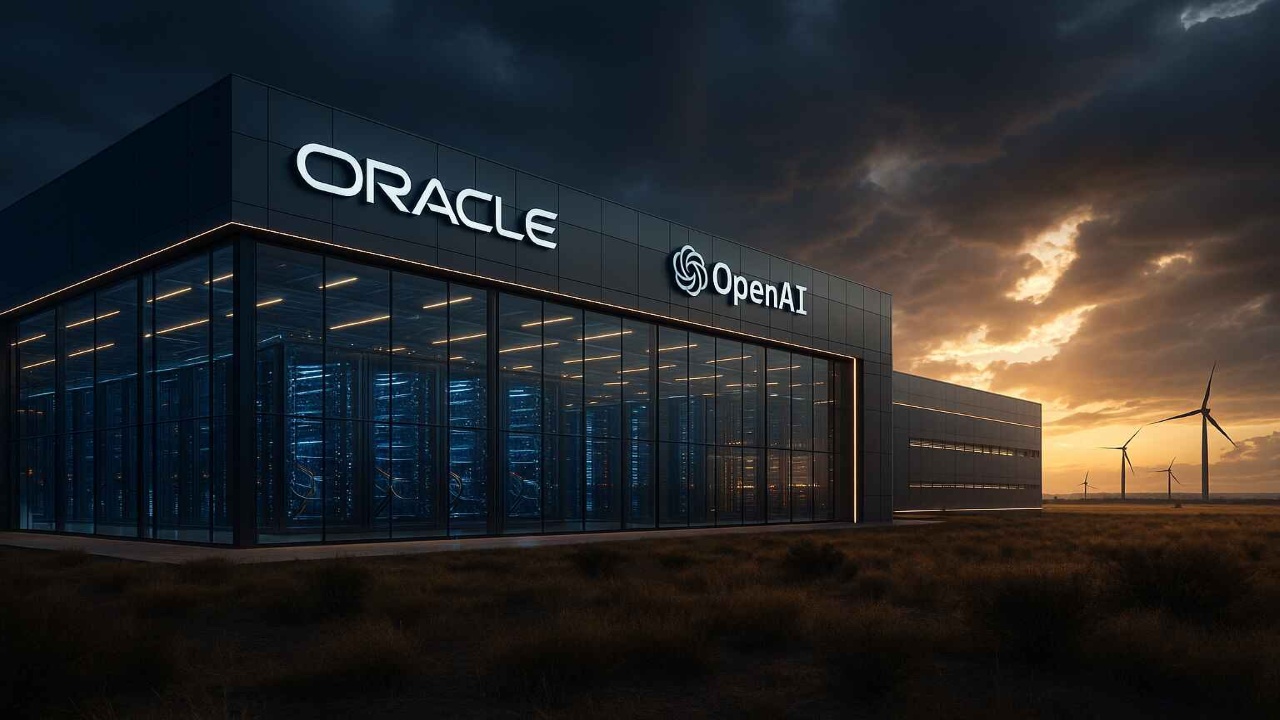
Oracle’s stock collapsed 24% in 2026 as $130 billion in AI debt and negative free cash flow of $23.7 billion rattled markets. Inside the hyperscaler’s existential reckoning.
Larry Ellison’s audacious pivot to AI infrastructure is drawing comparisons to the dot-com implosion — and for good reason.
Oracle Corp. closed out the week of June 27, 2026 with a stock price of $148.53, down 19% in a single week — the worst weekly performance since the 2001 technology bust. The collapse has shaken not just Oracle shareholders but the entire ecosystem of AI infrastructure optimism that has dominated capital markets for the better part of two years. What began as a generational pivot into cloud computing has become a cautionary tale about how quickly leverage can transform ambition into crisis.
The Numbers Behind the Nosedive
The arithmetic is stark. Oracle’s capital expenditures surged 162% to nearly $56 billion in fiscal year 2026, leaving the company with negative free cash flow of $23.7 billion — a dramatic deterioration from just a $394 million deficit in fiscal 2025. Long-term debt ballooned to approximately $124.7 billion by the end of the third fiscal quarter, making Oracle one of the most leveraged technology companies in history relative to its operating cash generation.
Despite posting total revenue of $67.4 billion for fiscal 2026 — a 17% year-on-year gain — investors focused on what was missing rather than what was achieved. Cloud infrastructure revenue did surge 93% to $5.8 billion in the fourth quarter, and total cloud revenue climbed 47% to $9.9 billion, demonstrating genuine demand. But those gains are being funded by capital markets in a way that is testing the boundaries of investor patience.
Having already raised $43 billion in debt and $5 billion in equity during fiscal 2026, Oracle announced plans to secure a further $40 billion in fiscal 2027 — on top of a previously disclosed $20 billion at-the-market equity programme. The announcement sent shares tumbling roughly 10% in after-hours trading on the day of the earnings call.
The OpenAI Dependency Problem
Central to investor anxiety is Oracle‘s lopsided reliance on OpenAI. The ChatGPT developer accounts for the majority — at least $300 billion — of Oracle’s remaining performance obligations. The concentration risk is extraordinary for a company of Oracle’s scale. If OpenAI stumbles in its own fundraising or fails to monetise its products at the projected pace, the cascade effects on Oracle’s revenue backlog — which rose 325% to an eye-catching figure that initially thrilled analysts — could be severe.
D.A. Davidson analysts warned in a December 2025 note that, “considering Oracle is already barely hanging on to an investment grade rating, we would be concerned about Oracle’s ability to live up to these obligations without restructuring its OpenAI contract.” The concern is not hypothetical: the cost to insure Oracle’s debt against default on credit default swap markets has hit record levels, a signal that bond investors are demanding higher risk premiums.
Morgan Stanley estimates that AI-related global debt issuance will more than double to nearly $570 billion in 2026, with hyperscaler spending potentially exceeding $1 trillion by 2027. Oracle sits at the most precarious position in that ecosystem — large enough to be systemic, but without the balance sheet cushion of Amazon, Microsoft, or Alphabet to absorb multi-year cash burn.
The Margin Trap
There is a structural problem embedded in Oracle’s strategy that goes beyond near-term financing concerns. The company’s traditional enterprise software business carries gross margins of approximately 77%. Infrastructure — the business it is pivoting toward — runs at margins closer to 49% at maturity, according to FactSet analyst consensus. That is a punishing dilution for a company that has historically been valued on premium software economics.
Analysts estimate Oracle will burn roughly $34 billion in cumulative free cash flow over the next five years before the infrastructure business turns cash-flow positive in 2029. “Four or five years is a long time,” Eric Lynch, managing director at Suncoast Equity Management, told Bloomberg. “That’s just not within our investment discipline.” The concern is compounded by reports — which Oracle denied — that completion dates for data centres tied to OpenAI contracts had been pushed back from 2027 to 2028.
Meanwhile, headcount declined 13% to 141,000 employees in fiscal 2026, with pullbacks concentrated in sales and marketing — the exact functions needed to defend the existing software business from AI-native competitors. Larry Ellison, absent from the most recent earnings call, has been surpassed on the global wealth rankings by Larry Page, Sergey Brin, Jeff Bezos, and Michael Dell as the stock’s decline eroded the paper value of his stake.
What Evercore and the Bulls Are Still Saying
Not every analyst has abandoned the thesis. Evercore maintained a buy recommendation, noting that “financing/leverage and the pace of equity issuance” would remain the central investor debate “even as demand signals stay strong.” The company’s fiscal 2027 revenue guidance of $90 billion was left intact, and adjusted EPS targets were nudged higher to $8.05. Evercore analysts argue that the backlog growth and infrastructure demand pipeline are real — the question is whether markets will extend the runway needed to prove it.
The broader tech software sector offers context: the iShares Expanded Tech-Software ETF (IGV) is down 16% year-to-date in 2026, while Oracle has fallen 24% — worse than the index but not in isolation. The investor thesis on enterprise software has broadly softened on fears that large language models will automate away categories of software that have historically commanded subscription premiums.
The Systemic Warning
Oracle’s distress carries implications well beyond its own share price. Fortune reported that Morgan Stanley wealth management’s Lisa Shalett flagged Oracle’s credit default swap widening as an early warning indicator for the broader AI investment complex. If confidence in Oracle’s ability to service its debt erodes, it signals that markets are beginning to reprice the risk embedded in the entire hyperscaler debt stack — a reassessment that could spread to data centre REITs, AI chip suppliers, and enterprise cloud vendors.
The debt load, the leadership transition to dual CEOs Clay Magouyrk and Mike Sicilia, the OpenAI concentration risk, and the structural margin compression collectively make Oracle the most visible stress test of the AI infrastructure buildout in 2026. Whether it passes or fails that test will shape capital allocation across the technology sector for years to come.
Discover more from The Economy
Subscribe to get the latest posts sent to your email.
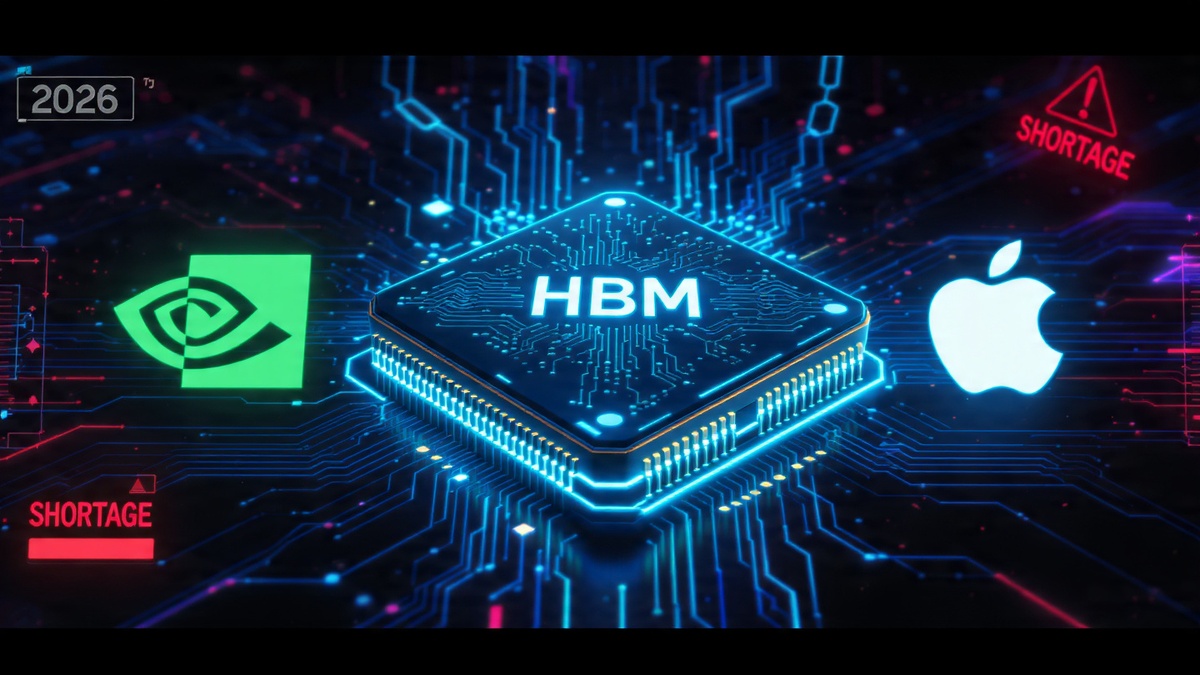
A global memory chip shortage is hitting AI hyperscalers, tanking Nvidia and Apple shares, and triggering a Wall Street rotation. Here’s what the AI sector’s supply crisis means for investors.The artificial intelligence boom that has driven Wall Street’s most extraordinary bull run in a generation is running headlong into a physical constraint: the world cannot produce memory chips fast enough to feed it.
On Friday, June 26, 2026, technology stocks extended a brutal weekly decline even as the broader market stabilized and advancing shares outnumbered declining ones. Nvidia slipped another 1% in early trading and was on pace for an 8% weekly loss—its worst five-day stretch in more than a year. Apple dived after announcing price increases for several iPad and Mac models, citing higher costs from memory chip shortages. Oracle and CoreWeave fell after the New York Times reported that OpenAI was considering delaying its initial public offering to as late as 2027.
What the headlines share is a single underlying cause: the cost of the memory chips that power AI infrastructure is rising faster than even the most aggressive hyperscaler budgets assumed, and the shortage driving that cost increase is not expected to ease before 2028.
The Architecture of the Crisis
Memory chips—specifically the high-bandwidth memory, or HBM, used in AI accelerators—are produced by a small number of manufacturers: SK Hynix, Micron, and Samsung. Demand for HBM has exploded because each new generation of Nvidia’s AI chips requires substantially more of it. As Nvidia pushes its product cycle faster to maintain competitive advantage, each cycle pulls forward enormous new demand for chips that take 18 to 24 months to ramp in production.
Micron reported strong quarterly earnings—its results have been spectacular—but the very strength of those results is the problem for the rest of the tech sector. Micron’s margins are rising because memory is scarce and expensive. The companies buying that memory—Microsoft, Amazon, Alphabet, Meta, and the rest of the hyperscaler complex—are absorbing higher input costs on a scale that is beginning to show up in margin guidance.
Analysts at Charles Schwab noted a “growing wedge” in the technology sector between memory producers like Micron—which is posting massive gains—and the hyperscaler stocks that are watching their AI infrastructure economics deteriorate. The latter group includes names like Microsoft, Amazon, and Alphabet, which are collectively projected to spend between $660 billion and $700 billion on AI infrastructure in 2026, according to research from Fair Observer.
Nvidia’s Problem Is a Market Concentration Problem
Nvidia entered 2026 having crossed a $5 trillion market capitalization—larger by GDP comparison than all but four national economies. That concentration made the stock not merely a bet on AI but a systemic weight in the S&P 500. Nvidia and its mega-cap technology peers now account for roughly 30% of the entire index—the highest concentration in half a century.
When Nvidia corrects, it does not correct in isolation. It reprices the risk premium of every fund manager with an S&P 500 benchmark, which is nearly every institutional investor in the world. The 8% weekly decline in late June—attributed to a combination of rising memory costs, margin anxiety among hyperscaler customers, and a broader rotation away from high-multiple AI stocks—had ripple effects across semiconductor infrastructure names including Lumentum, Marvell Technology, and Corning.
Apple Raises Prices—and Reveals the Exposure
Apple’s announcement of price increases for iPad and Mac models was notable for two reasons. First, Apple’s supply chain is among the most sophisticated on earth; if Apple could not absorb memory cost increases without raising consumer prices, the margin pressure is acute. Second, Apple’s pricing decision revealed an exposure that consumer electronics companies had managed to keep largely invisible through inventory buffers.
Those buffers, built up when memory was cheap, are now depleted. The shortage is forecast to persist through 2027 and potentially into 2028, driven by Nvidia’s accelerated chip release cadence and the insatiable demand of AI data centers for high-bandwidth memory. Analysts at Briefing.com noted that higher memory costs are seen “persisting throughout 2027 and perhaps into 2028, driven by increasing data center demand and Nvidia’s rapid introduction of updated AI chips.”
OpenAI Delays Its IPO—Absorbing the Lesson From SpaceX
The reported delay in OpenAI’s public offering is a direct consequence of two market developments: the broader tech weakness driven by the memory supply crisis, and the troubled IPO debut of SpaceX earlier in June, whose shares suffered heavy losses in the days following listing as global markets repriced risk.
OpenAI executives, who had targeted 2026 for a public offering, are now said to be evaluating a 2027 launch—giving markets time to stabilize and giving the company time to demonstrate that its AI infrastructure economics are sustainable at the scale that a public market valuation would demand.
The Rotation That May Define the Rest of 2026
The most significant market dynamic emerging from the memory chip crisis is not the decline in any single stock but the rotation it is enabling. As the mega-cap AI trade faces margin headwinds, investors are moving into financial and industrial companies, healthcare, and energy—sectors that had been overshadowed for years by the AI growth narrative. The Dow, weighted toward those steadier names, was holding up even as the Nasdaq declined through the final week of June.
That divergence—Dow up, Nasdaq down—is a familiar pattern in sector rotation cycles. It does not necessarily signal a bear market. It may signal the beginning of a more broadly distributed bull market, one less concentrated in five or seven names. The memory supply crisis, in that reading, is not the end of the AI boom—it is the first serious test of whether the boom’s economics are durable enough to survive contact with physical constraints.
Discover more from The Economy
Subscribe to get the latest posts sent to your email.
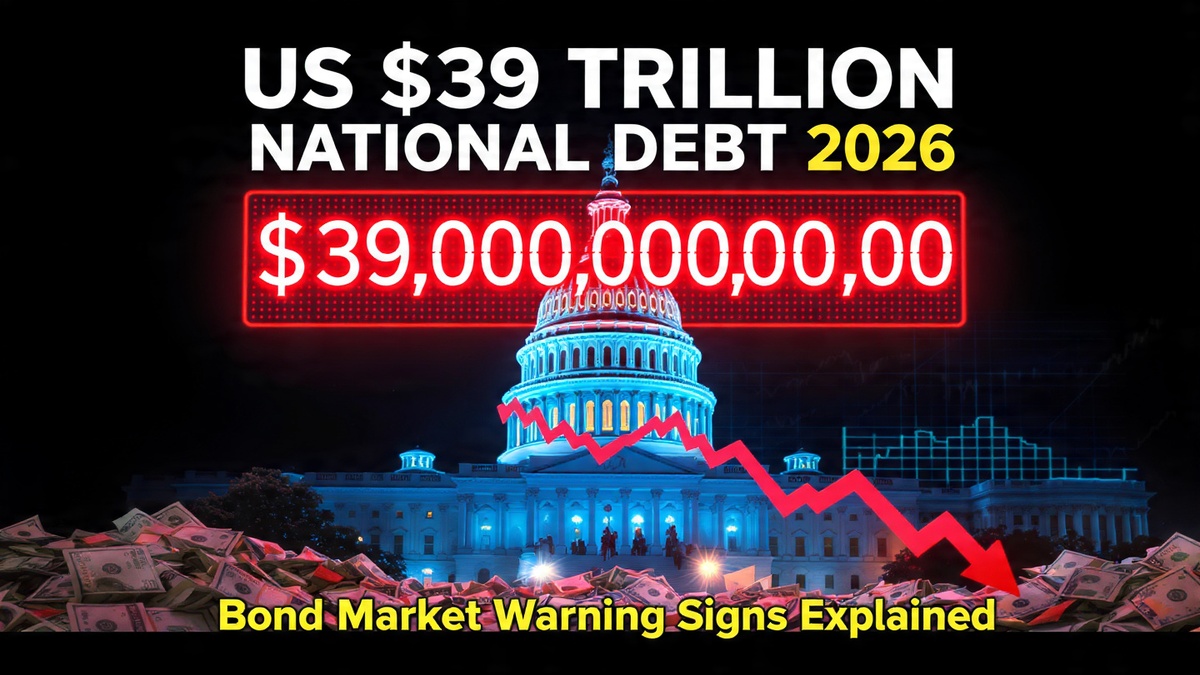
US national debt has crossed $39 trillion, bond yields are spiking, and Treasury auctions are showing soft demand. Here is what the bond market knows that Washington refuses to acknowledge.The United States crossed a number this year that no country in history has ever reached: $39 trillion in total federal debt. Not in inflation-adjusted terms. Not as a percentage of GDP. In raw dollars, the figure that sits on the public ledger of the world’s largest economy grew by $1 trillion in five months and $2 trillion in seven and a half months—and it is not slowing down.
What makes the velocity of that accumulation remarkable is the context in which it occurred. The Iran war added direct military expenditure at a pace that budget analysts said was accelerating. The 2025 tax cuts continued to erode revenue. And rising interest rates—the same rates the Federal Reserve is now signaling it may push higher still—are compounding the cost of servicing all that outstanding debt in a feedback loop that the bond market has quietly begun to price.
What the Auctions Are Saying
The most direct readout of market confidence in U.S. fiscal sustainability is the Treasury auction market, where the government sells new debt every week. Recent auctions have produced signals that bond investors usually describe in muted, technical language—but the direction is consistent.
A recent three-year Treasury auction cleared at 4.192%, well above the 3.965% at the prior auction. Yields rise when demand is soft. Soft demand at U.S. Treasury auctions is not a crisis signal—these are still among the most liquid securities in the world—but the trend line is one that fixed-income analysts at institutions ranging from J.P. Morgan to the Council on Foreign Relations have flagged as requiring close attention.
Foreign investors currently hold just above 30% of the Treasury market. Alarm bells rang briefly after April 2025’s Liberation Day tariffs—when U.S. bonds, equities, and the dollar all sold off together, the rarest of Wall Street trifectas—but subsequent data showed no dramatic reallocation away from Treasuries by foreign holders. That relative stability, however, depends on the continuation of conditions (a strong dollar, a functioning petrodollar system, geopolitical faith in U.S. institutions) that several of those conditions’ own architects now question.
The Interest Payment Problem
Of that $39 trillion, roughly $31.4 trillion is held by the public—the portion traded in financial markets globally. At current yields, the annual interest cost the U.S. government pays is on track to exceed $1 trillion for the first time in the country’s history. That figure is not a forecast. It is an arithmetic consequence of the debt level and the rate environment.
For context: U.S. defense spending in 2026 is approximately $900 billion. The federal government will spend more on interest payments than on the entire military. More than on Medicaid. More than on all discretionary non-defense programs combined. That structural reality constrains fiscal policy in ways that economists at the Deloitte Center for Financial Services have described as the most significant long-term challenge facing the U.S. economy.
“Higher bond yields affect U.S. fiscal dynamics in a number of ways,” analysts at the Council on Foreign Relations noted in their examination of tariff and Treasury interactions. “As interest payments on debt increase and use a greater share of available government funds, policymakers become more constrained around other fiscal priorities. They also can be more challenged when they need to respond to economic shocks.”
Three Credit Downgrades, Zero Course Correction
The United States has now been downgraded by all three major credit ratings agencies: S&P in 2011, Fitch in 2023, and Moody’s in May 2025. Each downgrade arrived with similar language—concerns about fiscal trajectory, political dysfunction over the debt ceiling, and a structural unwillingness to match revenues with spending. Each was followed by a brief market convulsion and then, effectively, nothing. Congress did not respond. The debt continued growing.
That pattern—of consequences being absorbed rather than heeded—is what makes the current moment structurally different from prior debt discussions, according to analysts who study sovereign fiscal crises. In those prior episodes, the U.S. still had room to maneuver: rates were low, the global appetite for dollar-denominated safe assets was rising, and alternative reserve currencies were even less credible than they are today. The margin for error has narrowed on all three dimensions.
The Political Ceiling on Solutions
The challenge is not primarily economic—it is political. Addressing a $39 trillion debt requires some combination of higher revenues, lower spending, or both. In the current Washington environment, tax increases are politically radioactive for one party and spending cuts face equivalent resistance from the other—particularly for the entitlement programs (Social Security, Medicare, Medicaid) that account for the largest share of mandatory outlays.
Markets have not yet priced the national debt as an immediate crisis, as analysts at U.S. Bank noted in their midyear market review: investors continue to watch whether rising debt eventually requires higher interest rates to attract enough Treasury buyers. The passive construction of that sentence—”continue to watch”—captures the market’s posture precisely. It is waiting. It is not yet acting.
The bond market’s message, in the language of Treasury yields and auction results, is being sent in increments rather than in a single shock. Washington is not listening. The question is not whether the message will eventually become impossible to ignore—it is how high rates must rise, and how much growth must slow, before the political system treats the ledger as a constraint rather than an abstraction.
Discover more from The Economy
Subscribe to get the latest posts sent to your email.

Oracle AI Debt Crisis 2026: $130 Billion Gamble Triggers Worst Stock Crash Since Dot-Com Bust

Male Labor Force Participation Rate 2026: Why Men Are Leaving & Economic Impact

Trump Tariffs 2026: Economic Impact, Household Costs & Trade War Outlook

China Economy 2026: Export Boom Masks Property Crisis & Investment Slump

US Inflation 4% May 2026: Is the Worst Over? Fed, Oil Prices

AI Memory Chip Shortage 2026: Nvidia, Apple & What Comes Next

US $39 Trillion National Debt 2026: Bond Market Warning Signs Explained

Ray Dalio US Suez Moment 2026: Dollar Decline, $39 Trillion Debt & Empire’s End

Kevin Warsh Fed Rate Hike 2026: What His Hawkish Pivot Means for Markets

Gold Price 2026: Will Gold Hit $6,000? JPMorgan Forecast, Drivers & Investment Guide

US Recession 2026: Four Key Threats, Warning Signs & How to Protect Your Portfolio

AI Energy Demand 2026: Data Centres, Power Grids & the $725B Infrastructure Boom

AI Semiconductor Selloff 2026: Micron Crash, Nasdaq Pullback & What Comes Next

US Tariffs 2026: How Trump’s 11.7% Effective Rate Is Reshaping Global Trade & Inflation

KPMG Australia CEO Resigns After Whistleblower Claims Exposed Investigation Failures

PwC China Partner Payouts Cut Amid Evergrande Audit Fraud

Broadcom Market Value Loss: Revenue Forecast Disappoints

Investors Pile Into Bullish Dollar Bets as ‘US Exceptionalism’ Trade Returns

Here’s How Much It’ll Cost You to Be Part of SpaceX’s Record-Breaking $75 Billion IPO

Nasdaq Tumbles 4% as Chip and Memory Stocks Sink: A $1.2 Trillion Wipeout

How to Fix Pakistan’s Debt Economy: A Structural Blueprint

Smash Capital Leads $200M Funding for Allen Control Systems

Democrats Draw a Red Line Around Military AI — And the Pentagon Is Already Pushing Back

New Investment Super-Cycle: AI, Green Energy & Re-Shoring

Xponential Fitness Franchise Lawsuit: The $3.97M Judgment

Middle East Conflict Oil Prices: The $4 Surge Explained

Grinding the Already Ground: Pakistan’s Inflation Crisis

The End of the Chatbot: Why OpenAI is Tearing Up Its Most Successful Product
-

 Markets & Finance6 months ago
Top 15 Stocks for Investment in 2026 in PSX: Your Complete Guide to Pakistan’s Best Investment Opportunities
-

 Analysis4 months ago
Top 10 Stocks for Investment in PSX for Quick Returns in 2026
-

 Analysis5 months ago
Brazil’s Rare Earth Race: US, EU, and China Compete for Critical Minerals as Tensions Rise
-

 Analysis4 months ago
Johor’s Investment Boom: The Hidden Costs Behind Malaysia’s Most Ambitious Economic Surge
-

 Banks5 months ago
Best Investments in Pakistan 2026: Top 10 Low-Price Shares and Long-Term Picks for the PSX
-

 Investment6 months ago
Top 10 Mutual Fund Managers in Pakistan for Investment in 2026: A Comprehensive Guide for Optimal Returns
-

 Global Economy6 months ago
15 Most Lucrative Sectors for Investment in Pakistan: A 2025 Data-Driven Analysis
-

 Global Economy6 months ago
Pakistan’s Export Goldmine: 10 Game-Changing Markets Where Pakistani Businesses Are Winning Big in 2025