
Analysis
Singapore EV Charging Prices: Why Stability Ends in April and What It Means for Drivers

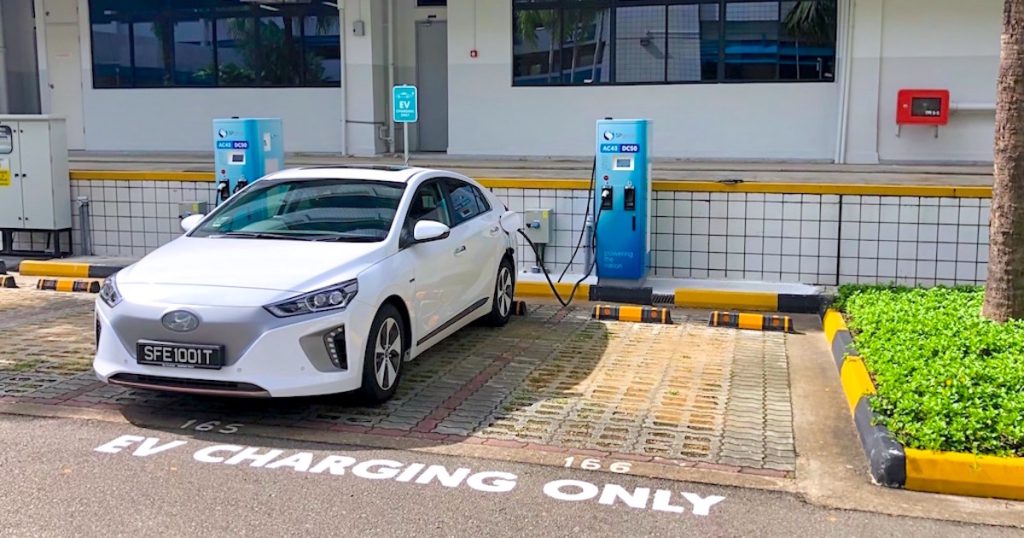
Singapore EV charging prices remain stable despite Middle East tensions, but the Q2 2026 electricity tariff hike—driven by surging LNG costs—signals inevitable increases from April. Here’s what drivers need to know.
There is a curious calm settling over Singapore’s electric vehicle charging networks these days. At HDB carparks in Toa Payoh and private lots in Orchard Road, the rates blinking on charging screens have barely budged—hovering around a median S$0.66/kWh in public estates and S$0.74/kWh in commercial ones . Pump prices, by contrast, have been on a tear: 95-octane petrol climbed 16 percent since mid-February, with diesel surging more than 27 percent as Middle East turmoil rattles oil markets .
For EV drivers, this feels like vindication. Their fuel of choice—electricity—has remained insulated from the geopolitics convulsing the Strait of Hormuz. But if you are one of the 62,000-plus EV owners in Singapore, or contemplating joining their ranks, enjoy the reprieve while it lasts . Because April is coming, and with it, a reckoning.
The mathematics of Singapore’s energy architecture is unforgiving. This city-state generates 95 percent of its electricity from imported natural gas . And natural gas—specifically the liquefied variety priced against the Japan-Korea Marker (JKM) benchmark—has gone parabolic. Asian spot LNG prices now trade roughly 80 percent above pre-conflict levels, touching US$18 per million British thermal units . The only reason EV charging rates haven’t reflected this is timing: Singapore’s regulated electricity tariffs adjust quarterly, using a lagged formula based on average natural gas prices from the preceding two-and-a-half months .
That lag is about to expire.
The April Inflection Point
When the Energy Market Authority (EMA) announces the Q2 2026 regulated tariff later this month, the numbers will not be pretty. The current Q1 rate of 26.71 cents/kWh (before goods and services tax) reflects natural gas prices from October through mid-December 2025—a period before the latest escalation in the Middle East . The next revision will capture the price surge that followed recent disruptions near the Strait of Hormuz, through which a fifth of global LNG trade passes.
A senior manager at one of Singapore’s major charging point operators (CPOs), speaking to The Business Times, put it bluntly: if the electricity tariff increase is modest, operators might absorb some of it. But if the jump is significant—and all signs point that way—charging rates will have to rise .
This is not merely a story about passing through costs. It is a stress test for Singapore’s carefully calibrated green transition.
The Vulnerability Beneath the Stability
Singapore’s electricity pricing mechanism was designed for predictability, not insulation. The quarterly tariff-setting formula, which smooths fuel cost volatility by averaging prices over several months, has served households and businesses well . But it cannot repeal the laws of energy economics. The natural gas that feeds power plants like Senoko and Tuas is largely contracted on oil-indexed terms, and those contracts eventually reflect market reality .
What makes the current moment different is the confluence of structural pressures. LNG import dependence is rising across Southeast Asia; S&P Global Commodity Insights projects regional imports to hit 56 million metric tons by 2030, nearly triple 2023 levels . Singapore, despite its reputation for diversification, remains exposed. Last year, 42.5 percent of its LNG came from Qatar alone . When geopolitical risk spikes in the Gulf, the transmission to Singaporean wallets is nearly direct.
The CPOs caught in the middle face an unenviable choice. Raise prices and risk slowing EV adoption—precisely when the government aims for 60,000 charging points by 2030 and EVs already constitute nearly one-third of new car registrations . Or absorb costs and squeeze margins on infrastructure that remains capital-intensive to deploy and maintain.
What the Hike Looks Like
The exact magnitude of the April increase remains uncertain, but we can sketch plausible contours. If wholesale electricity costs rise 15 to 20 percent—not unreasonable given LNG’s 80 percent spike—public charging rates could climb by 10 to 15 percent, based on analysis by National University of Singapore academics . That would push HDB charging toward S$0.73–0.76/kWh and commercial fast charging past S$0.80/kWh.
For a typical EV driver covering 20,000 kilometers annually, the math shifts meaningfully. Today, charging predominantly at public AC points costs roughly S$1,200–1,400 per year in electricity. A 15 percent increase adds S$180–210—not crippling, but enough to nibble at the total-cost-of-ownership advantage over internal combustion engine vehicles .
The comparison with petrol remains favorable, to be sure. At current pump prices of S$3.35/liter for 95-octane, a comparable petrol sedan costs S$2,600–2,800 annually in fuel . But the gap narrows, and perception matters. Early adopters who bought EVs expecting perpetually cheap electrons may experience sticker shock.
Not All Chargers Are Equal
The coming increase will not land uniformly. Fast DC chargers—those 50kW and above units at malls and petrol stations—already command premiums for convenience. Their operating costs are higher, and they serve a clientele (ride-hailers, commercial fleets, time-pressed drivers) with lower price sensitivity .
AC chargers in HDB estates, by contrast, face different economics. These serve overnight parkers—residents for whom charging is a routine, not a emergency top-up. Price sensitivity here is higher, and CPOs competing for LTA tenders must weigh proposed rates in their bids . The Land Transport Authority’s price-quality framework already weights quality more than price in evaluating operators, but the quality threshold does not exempt operators from market discipline .
There is another wild card: some CPOs have locked in renewable energy contracts that partially insulate them from wholesale price spikes . If you charge on a network backed by solar power purchase agreements, your rates may rise less—or later. This will introduce new differentiation in a market that has, until now, felt relatively commoditized.
The Policy Bind
For the government, the timing is awkward. The EV adoption push is hitting its stride. As of February 2026, electric vehicles account for 6.3 percent of Singapore’s total car population—up from under 1 percent in 2022 . The charging network now exceeds 1,600 HDB carparks, with fast chargers rolling out at commercial and industrial locations to support taxi and fleet electrification .
Yet the very success of this rollout creates exposure. More EVs mean more charging demand, which means more sensitivity to electricity prices. The U-Save rebates and EV early adoption incentives that cushioned the transition were designed for upfront costs, not operating expenses . They do not help when the per-kilowatt-hour rate climbs.
Energy Minister Tan See Leng acknowledged as much recently, noting that while Singapore has diversified gas supplies and buffer stocks, global prices ultimately transmit to local tariffs . It was a careful statement—neither alarmist nor reassuring—and it signals that the government expects households and drivers to share some pain.
The Longer View: Resilience or Relapse?
What does April’s looming hike teach us about Singapore’s energy future? Three things.
First, fuel diversification remains an unfinished project. Solar adoption is scaling, but intermittent. Cross-border power imports from Laos and Malaysia are growing, but slowly. Nuclear and other firm low-carbon sources remain years away. Natural gas, for all its emissions intensity relative to renewables, will anchor the system for another decade .
Second, EV charging economics will increasingly segment. Drivers who can charge at home—landed property owners, condos with installed infrastructure—will enjoy relative insulation, paying retail electricity rates rather than marked-up public charging fees . HDB dwellers, who rely on public infrastructure, face greater pass-through risk. This is not merely an equity issue; it is an adoption constraint. If public charging becomes significantly more expensive than home charging, the profile of EV buyers may skew wealthier, slowing mass-market penetration.
Third, CPO business models must evolve. The early land grab—installing chargers to capture market share—is giving way to a more mature phase where pricing strategy, load management, and ancillary services (battery storage, solar integration, demand response) determine profitability . Operators who simply pass through grid costs will lose customers to those who innovate.
What Drivers Should Do Now
If you own an EV—or plan to—April is a pivot point. Consider these moves:
- Lock in home charging if possible. For landed property residents, installing a charger before the tariff hike captures today’s rates. The EV Common Charger Grant and heavy vehicle charger subsidies remain available .
- Compare CPO apps. Not all operators will raise prices equally or immediately. Some may offer off-peak discounts or bundled subscriptions. Charge+ already promotes time-of-use rates; others may follow .
- Factor electricity risk into EV math. The total-cost-of-ownership advantage over petrol remains intact, but the margin matters. If you drive high mileage, especially on public fast charging, run the numbers with a 10–15 percent buffer.
- Watch the Q2 tariff announcement. Due in late March, the precise increase will set the floor for CPO negotiations. A 10 percent tariff hike does not mandate a 10 percent charging hike—operators decide the pass-through.
Conclusion: The End of Exceptionalism
Singapore’s EV charging market has enjoyed a brief golden age: stable prices through global energy chaos, government-backed rollout, and favorable comparisons to volatile petrol. April 2026 marks the end of that exceptionalism.
The stability was never magic; it was math—a lagged formula and a quarterly cycle that temporarily decoupled local rates from global spikes. That decoupling is reversing. The only questions are how much prices rise and who bears the burden.
For policymakers, the episode underscores the urgency of energy diversification and the need to monitor charging affordability as adoption scales. For CPOs, it demands smarter pricing and better hedging. For drivers, it is a reminder that even electrons have geopolitics.
The green transition does not repeal the laws of supply and demand. It merely changes the fuel. And every fuel, eventually, has its April.
Discover more from The Economy
Subscribe to get the latest posts sent to your email.



Navigating Mortgage and Loan Refinancing in a High-Yield Environment
Global public debt crossing critical thresholds has kept central bank policies volatile, resulting in fluctuating US Treasury yields throughout 2026. For homeowners and commercial property holders burdened by previous high-interest borrowing cycles, finding optimal refinance windows has become a high-stakes financial puzzle. Stalled disinflation and stubborn employment numbers mean rate cuts are incremental, requiring borrowers to act with precision.
Timing your mortgage or commercial loan refinance in this environment requires a deep understanding of yield curve movements and lender risk appetites.
Decoding 2026 Refinance Dynamics
The 10-Year Treasury Yield Benchmark
Mortgage rates continue to track closely with the 10-year US Treasury yield. When macroeconomic anxiety spikes debt issuance, yields rise, tightening consumer borrowing capacity. Savvy borrowers monitor weekly Treasury auctions to lock in rates during brief dip windows.
Hybrid ARMs and Alternative Structures
With fixed rates remaining elevated, 7/1 and 10/1 adjustable-rate mortgages (ARMs) have surged in popularity. These products offer lower initial monthly payments, giving borrowers breathing room until central bank easing cycles fully materialize.
| Loan Product | Current Rate Range | Best For | Key Risk Factor |
| 30-Year Fixed Mortgage | 6.2% – 6.8% | Long-term predictability | Higher initial monthly outlay |
| 7/1 Hybrid ARM | 5.5% – 5.9% | Short-term ownership / flipping | Rate reset risk after year 7 |
| Commercial Refinance | 7.0% – 8.2% | Corporate asset restructuring | Strict DSCR lender covenants |
Actionable Steps for Successful Refinancing
To maximize your chances of securing favorable refinance terms in a volatile market, follow a disciplined preparation strategy.
Boost Your Credit Score Immediately: Lenders in 2026 are applying stringent credit tiering; a 20-point increase can drop your APR by a crucial quarter-point.
Shop Regional Credit Unions: Smaller financial institutions often offer portfolio loans with more flexible underwriting than major national banks.
Calculate the Break-Even Point: Ensure your total closing costs are recouped through monthly savings within 24 months of closing.
“Market Strategist View: Refinancing in 2026 is an exercise in opportunistic timing. Borrowers must maintain immaculate financial profiles ready to strike the moment Treasury yields dip.”
Mastering the complexities of today’s debt environment ensures you can successfully lower your debt service costs and protect your long-term financial stability.
Discover more from The Economy
Subscribe to get the latest posts sent to your email.

The days of pulling generic auto insurance quotes based purely on your zip code and age are officially over. In 2026, insurance comparison engines are powered entirely by generative AI and real-time telematics. These platforms digest thousands of live data points—ranging from your driving smoothness via connected vehicle sensors to real-time traffic congestion patterns—to generate hyper-personalized premiums instantly.
For consumers, this evolution represents both a massive opportunity for savings and a hidden trap for penalty pricing. Understanding how AI algorithms evaluate risk is essential for anyone looking to lower their monthly auto insurance premiums.
How AI Comparison Engines Evaluate Your Risk Profile
Behavioral Telematics and Connected Cars
Modern cars stream performance data directly to insurance aggregators. Generative AI models analyze braking sharpness, acceleration curves, cornering G-forces, and phone distraction metrics. Drivers who maintain smooth, defensive habits are rewarded with dynamic rate cuts of up to 40% compared to traditional rating tiers.
Predictive Traffic and Weather Modeling
AI tools now cross-reference your daily commute route with predictive weather and accident probability models. If your standard parking location or driving corridor has a statistically higher incidence of uninsured motorist claims, your quotes will reflect that hyper-local risk assessment.
| Comparison Factor | Traditional Rating Model | 2026 Generative AI Model | Impact on Premium |
| Mileage & Usage | Annual estimated odometer reading | GPS tracking & live trip duration | High (up to 35% savings) |
| Driving Behavior | MVR driving record & accidents | Real-time braking, speed, & G-force | Critical (determines tier) |
| Vehicle Tech | Make, model, and safety rating | ADAS calibration & repair cost data | Moderate |
Strategies to Lower Your AI-Driven Insurance Quote
To outsmart the algorithm and secure the lowest possible premium in 2026, drivers must proactively manage their digital footprint on insurance platforms.
Opt-In for Telematics Trial Periods: Many insurers offer immediate 15% discounts just for installing their driving app; let it track safe habits for 30 days to lock in permanent savings.
Scrub Unverified Public Records: Ensure your motor vehicle report is free of clerical errors that AI risk models misinterpret as reckless behavior.
Compare AI Aggregators: Use platforms that integrate multi-carrier API feeds rather than single-brand comparison sites to find the best risk-adjusted rate.
“Industry Note: AI-driven pricing rewards transparency and precision. Drivers who actively manage their telematics data consistently out-save those relying on legacy quote calculators.”
Embracing AI comparison tools allows savvy policyholders to customize coverage limits precisely to their driving habits, eliminating wasted premium spend while ensuring robust protection.
Discover more from The Economy
Subscribe to get the latest posts sent to your email.

Despite decades of bans and strict handling mandates, asbestos remains a silent killer across legacy manufacturing plants, shipyards, and modern green-energy infrastructure retrofits. In 2026, regulatory changes by the EPA and tightened occupational health standards have triggered a fresh wave of mesothelioma litigation. Manufacturers attempting to fast-track industrial transitions are encountering catastrophic oversight, exposing workers to legacy toxins and opening corporate parent companies to unprecedented liability.
Navigating a mesothelioma claim in 2026 requires understanding how modern industrial supply chains intersect with historical exposure. Trusts established decades ago are being audited under stricter transparency laws, altering payout ratios and accelerating fast-track settlements for terminally ill plaintiffs.
Modern Industrial Exposure Hotspots
Green Retrofitting and Renewable Energy Infrastructure
A primary source of 2026 asbestos exposure occurs during the decommissioning and retrofitting of older industrial facilities for renewable energy production. Workers insulating electrical grids, modernizing HVAC systems, or upgrading manufacturing floors frequently disturb encapsulated asbestos materials that were improperly documented or ignored during facility audits.
Automotive and Aerospace Supply Chains
With advanced manufacturing booming, workers handling specialized friction materials, gaskets, and heat shields face ongoing risks. Supply chain tracing has become more sophisticated, allowing legal teams to pinpoint exact corporate entities responsible for raw material distribution across multinational borders.
| Industry Sector | Primary Exposure Risk | Legal Venue / Trust | Avg. Claim Value Range |
| Green Energy Retrofit | Disturbed insulation, pipe lagging | Federal Tort / Manufacturer Trust | $1.2M – $3.5M |
| Shipbuilding & Marine | Boiler insulation, structural seals | Asbestos Bankruptcy Trusts | $800K – $2.4M |
| Automotive Manufacturing | Brake components, high-heat gaskets | Third-Party Product Liability | $600K – $1.8M |
Securing Maximum Compensation: Steps for Plaintiffs
Time is of the essence in mesothelioma cases. Plaintiffs and their families must act decisively to secure financial recovery before statutes of limitations expire.
Retain Specialized Counsel: Work exclusively with national mesothelioma law firms possessing deep historical databases of asbestos-containing products.
Audit Employment History: Document every job site, supervisor name, and equipment brand encountered throughout your career.
Expedite Medical Filings: Secure a formal pathological diagnosis quickly to qualify for expedited trust fund distribution and priority trial settings.
“Expert Insight: Modern asbestos litigation is no longer just about historical tracking; it is about holding modern corporations accountable for failing to conduct rigorous environmental safety audits before initiating industrial retrofits.”
By combining meticulous work history reconstruction with aggressive multi-trust filings, victims can secure substantial financial relief to cover specialized immunotherapy and family support.
Discover more from The Economy
Subscribe to get the latest posts sent to your email.

Balance of Payments (BOP)

The Falkland Islands Dispute: Sovereign Wealth, Offshore Drilling, and Market Impacts

Gross Domestic Product (GDP): Nominal vs. Real

What is Inflation and the Consumer Price Index (CPI)?

US-China Trade Competition 2026: Supply Chain Relocation Guide

Oil Prices Break $100 in 2026: Middle East Conflict & Energy Markets

South-South Trade Expansion: Digital Integration and Emerging Market Growth

$166B Tariff Refund Tapering Fast: Is Your Business Missing Out?

Stock Market Today: Dow Climbs 500 Points as Markets Shake Off Inflation Jitters

14th WTO Conference 2026: Tariffs & Global Supply Chain Impact

Swish Secures $24M Funding to Disrupt India’s $100B Food Market

Physical AI and Driverless Tech: The Next Trillion-Dollar Industrial Revolution

Enterprise AI Platforms Disrupting B2B SaaS in 2026: Full Analysis

Crypto vs. Safe Haven Assets 2026: Where Institutions Are Hedging

State Farm’s $5B Dividend 2026: Who Qualifies & Payout Dates

US-China Relations in Q3 2026: Trade Tariffs and Supply Chain Risks

Gold’s Wild 2026: From a Record $5,600 Peak to a 24% Crash and Back Toward $4,500

Oil Surges as Strait of Hormuz Traffic Collapses Again

The Rocket That Won’t Quit: Inside SpaceX’s Falcon 9 Launch Machine

Bank of England Set to Hold Rates Through Year-End, Reuters Poll Shows

SpaceX Starship Flight 14: First Orbital Attempt & Starlink V3 Launch Explained

The 2026 Crypto Regulatory Shift: What It Means for Institutional Investors

AI Chip Stocks 2026: The Best Semiconductor Investments Beyond Marvell

Retail Earnings Week: What Home Depot, Target & Walmart Reveal

AI-Powered Training: The Next Multi-Billion Dollar Ecosystem in Fitness

Russia’s Black Sea Oil Exports Fall for a Fifth Straight Week

Global Chip Selloff Deepens: What’s Driving the Aug. 19 Semiconductor Rout

Top 30 Stocks for Investment in PSX for Massive ROI in 2026
-

 Markets & Finance8 months ago
Top 15 Stocks for Investment in 2026 in PSX: Your Complete Guide to Pakistan’s Best Investment Opportunities
-

 Analysis7 months ago
Johor’s Investment Boom: The Hidden Costs Behind Malaysia’s Most Ambitious Economic Surge
-

 Analysis7 months ago
Top 10 Stocks for Investment in PSX for Quick Returns in 2026
-

 Analysis7 months ago
Brazil’s Rare Earth Race: US, EU, and China Compete for Critical Minerals as Tensions Rise
-

 Banks8 months ago
Best Investments in Pakistan 2026: Top 10 Low-Price Shares and Long-Term Picks for the PSX
-

 Investment8 months ago
Top 10 Mutual Fund Managers in Pakistan for Investment in 2026: A Comprehensive Guide for Optimal Returns
-

 Global Economy9 months ago
15 Most Lucrative Sectors for Investment in Pakistan: A 2025 Data-Driven Analysis
-

 Global Economy9 months ago
Pakistan’s Export Goldmine: 10 Game-Changing Markets Where Pakistani Businesses Are Winning Big in 2025